-
-

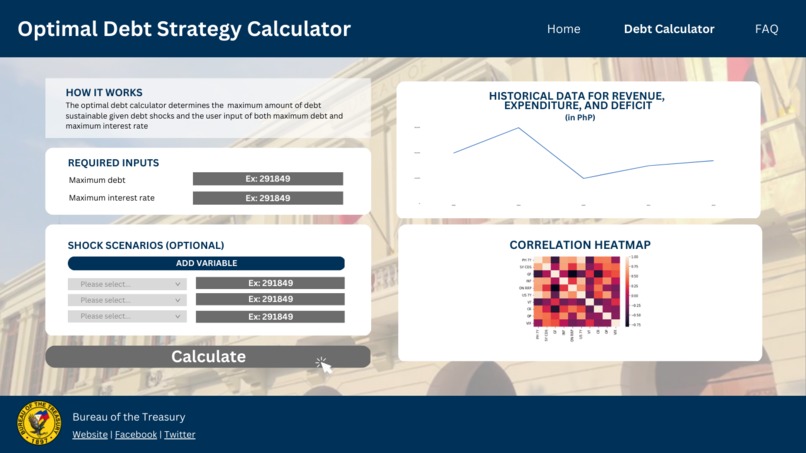
Dashboard Page 1
-
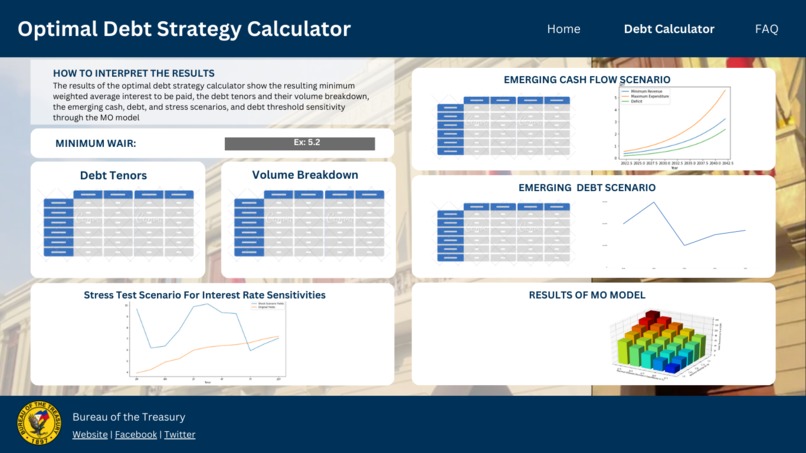
Dashboard Page 2
-
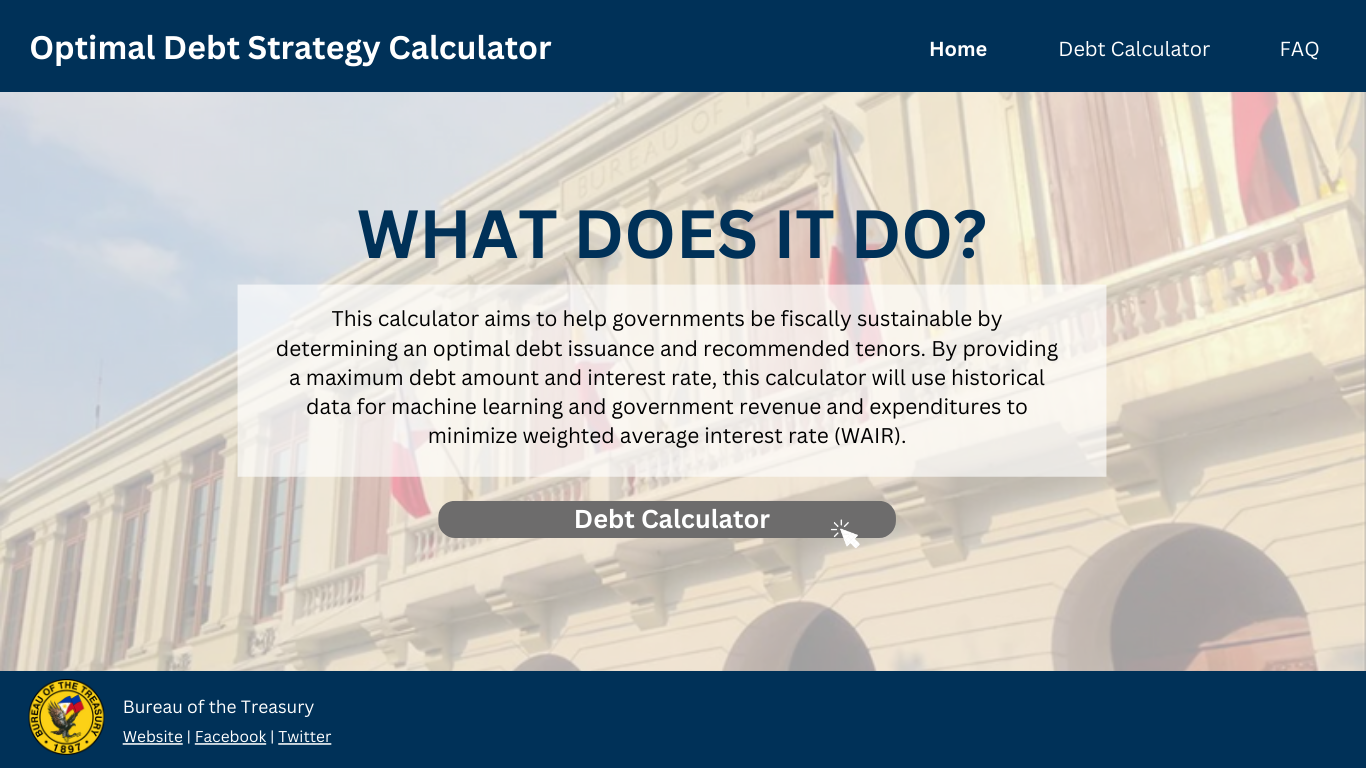
Dashboard Page 3
-

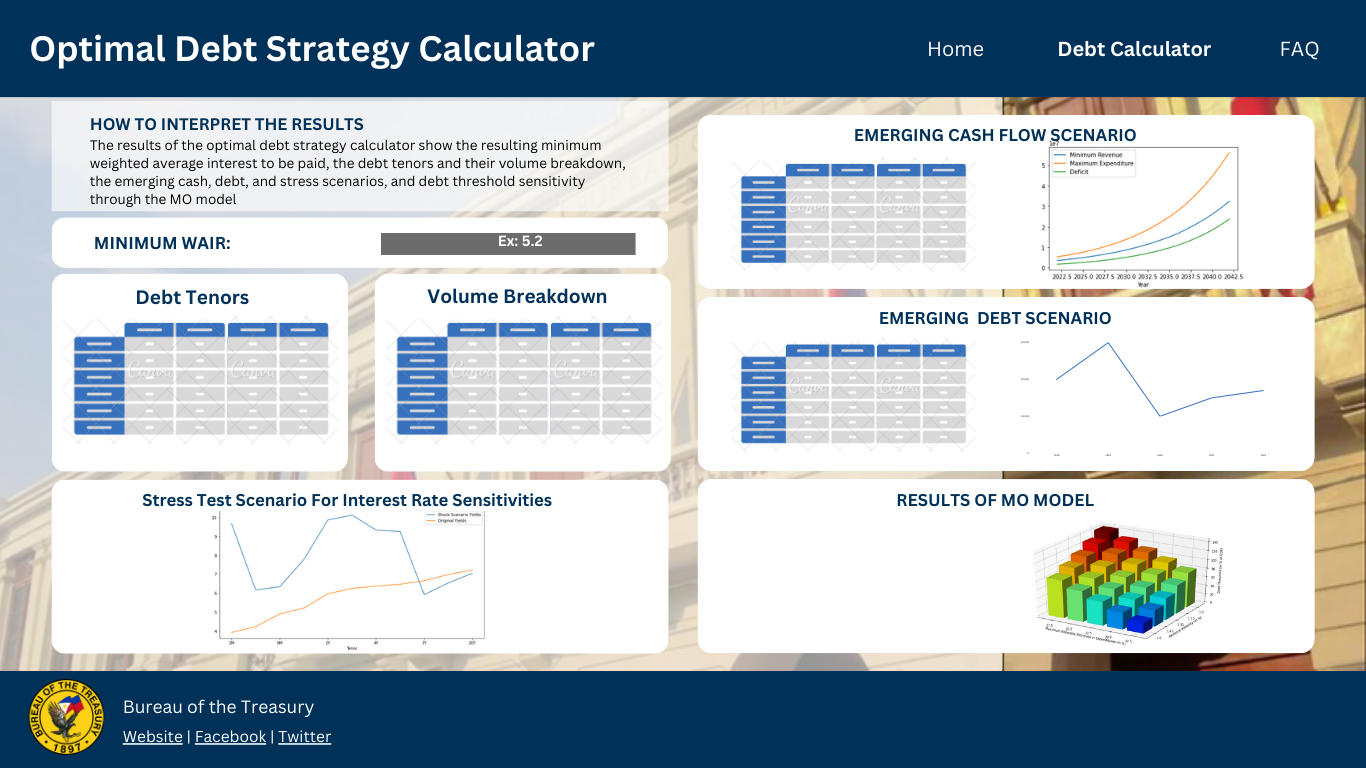
Dashboard Page 4


Inspiration
We live in uncertain times with unanticipated increase in prices, rising interest rates, and other economic challenges. With these prevalent problems, how can we help emerging sovereigns address these challenges? Our team came up with an app solution! We aim to provide economic managers and policy-makers in emerging markets with a tool that is simple, cost-free, and yet flexible enough to accommodate the unique economic and financial circumstances of different countries. With the development of this application tool. we hope that we can all be equipped to face these challenges.
What it does
Create a simple app that first asks the user to provide (1) their historical interest rates and other critical economic and financial variables, (2) historical revenues and expenditures that impact their cash flows, (3) current debt-to-GDP levels, (4) historical cash balance, and (5) maximum average interest rate that they can tolerate.
Based on the stated input, the app will provide output on (1) interest rate shock scenario that tells the users how the interest rates will move in case of shocks, (2) simulation results on revenues and expenditures, (3) maximum sustainable debt level, (4) optimal cash balance it should keep and, ultimately, (5) optimal and sustainable debt strategy on its total debt borrowing and breakdown of down into maturities, along with emerging debt payments and emerging cash flow balance given conservative assumptions. We note that we employed conservative assumptions so that the user will have a worse case overview in case of economic turbulence and therefore have more resiliency in case such scenario materialized.
How we built it
Process 1. Ideation on user input and output.
Our team identified specific user inputs and outputs for each of the 5 steps of the algorithm. We took time to think of the usefulness of the outputs of each of the five steps, and how we can synthesize the 5 steps to come up with an optimal debt strategy recommendation for the user.
Process 2. Visualization of user inputs and outputs through a dashboard
Our team visualized how the user inputs and outputs will look like through a dashboard. This enabled us to further refine the charts that will provide more insight to the user. Moreover, it allowed us to see how the data and critical results of each step altogether can be used to arrive at the optimal debt strategy for the user. Indeed, it greatly helped us tie up the seemingly disparate pieces of the overall puzzle, which is to come up with an optimal debt strategy recommendation for the user.
Process 3. Develop the algorithms that will transform input into output for each of the 5 steps in the app.
We took advantage of the power of Python modules in implementing the machine learning algorithms, performing historical simulation, conducting simple statistical and arithmetic operations to implement economic models and ultimately, perform optimization model with non-linear objective function and constraints.
We note that it is really critical here to synthesize the inputs and how they will fit together in providing an optimal debt strategy recommendation for the user, along with emerging debt and cash flow picture.
Process 4. Conduct a number of testing on each of the 5 steps of the app
After coding in Python, we ran a handful of inputs for each of the 5 steps to ensure that it is free from errors and can accommodate different inputs provided by the user.
Process 5. Conceptualize on marketability of the app for the end-user
Finally, after testing the algorithm, it is of significant importance to build the business case study for the user. Specifically, we organize our code such that the user will simply provide all the necessary inputs at the start. After which, the algorithm will run the 5 steps to provide the user with the critical outputs. Furthermore, we also put in extensive comments on the code so that the user can understand the functionality of the lines of codes and know where in the code can they provide the inputs. Comments are also placed on the outputs to guide the user on how to interpret them.
Challenges we ran into
Important challenges we ran into are as follows:
- How to synthesize the various inputs and outputs from each step to ultimately provide the user with an optimal debt strategy in the last step of the algorithm
- How to explain well the inputs and outputs of the app tool for appreciation of the user
- How to develop the business case on the usability of the app; This is important to ensure that there will be a buy in from the intended user
What allowed us to address these challenges are our technical know how on the techniques used for each step of the algorithm, experience in public finance that enabled us to develop the business case of the study, and more importantly, open communication that allowed us to foresee the challenges and brainstorm on creative ways to synthesize the various inputs and outputs into something useful for the end user.
Accomplishments that we're proud of
We are proud that we have accomplished the 5 steps in the algorithm given limited amount of time. We are also excited that we developed the business case for the app. Ultimately, we came up with an app that can help governments from emerging economies better cope up with uncertain economic conditions through a sustainable debt strategy.
What we learned
Our team learned that it is not just about making sure the algorithm runs but also developing the marketability and usefulness of the app. We saw the significance of understanding the practical application of the app in the chosen domain field. We also learned the importance of tracking the entire Data lifecycle to synthesize the inputs and outputs of the algorithms used. Finally, we came to see the power of machine learning in forecasting recessionary scenarios.
What's next for Helping the Government Create Sustainable Debt Program
We will develop a webpage app that sovereigns can use for their debt and cash flow planning.


Log in or sign up for Devpost to join the conversation.