-
-

logo!
-
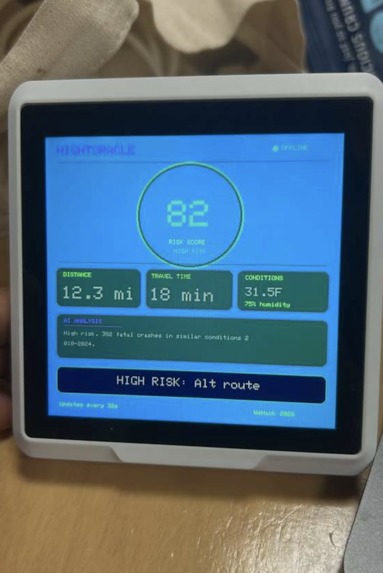
our senseCAP dashboard
-
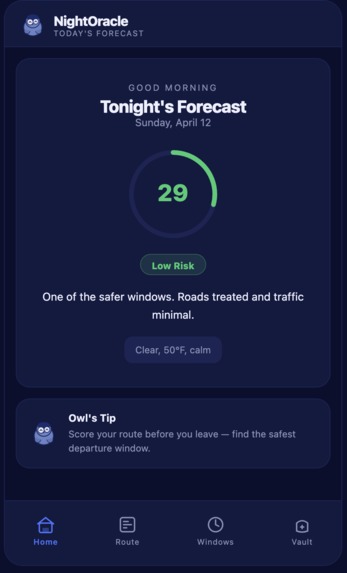
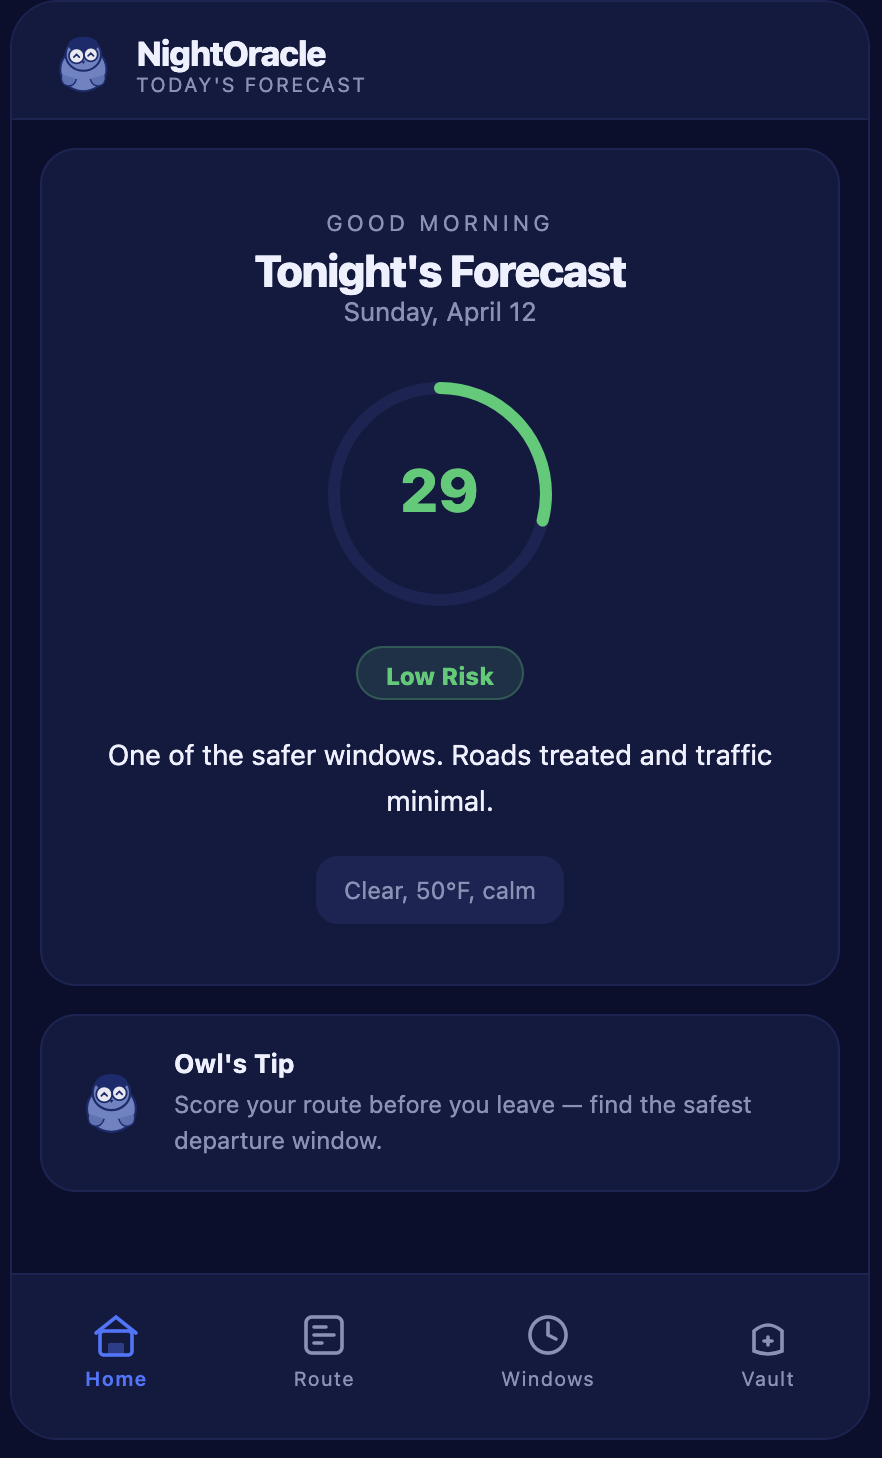
Home Page
-
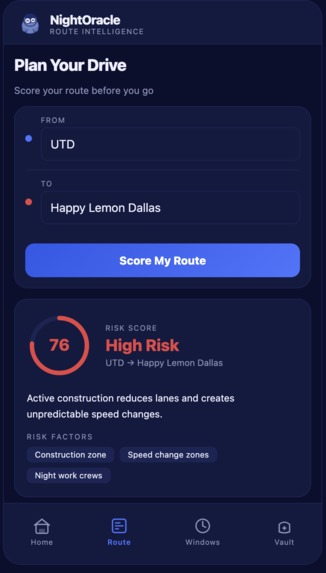
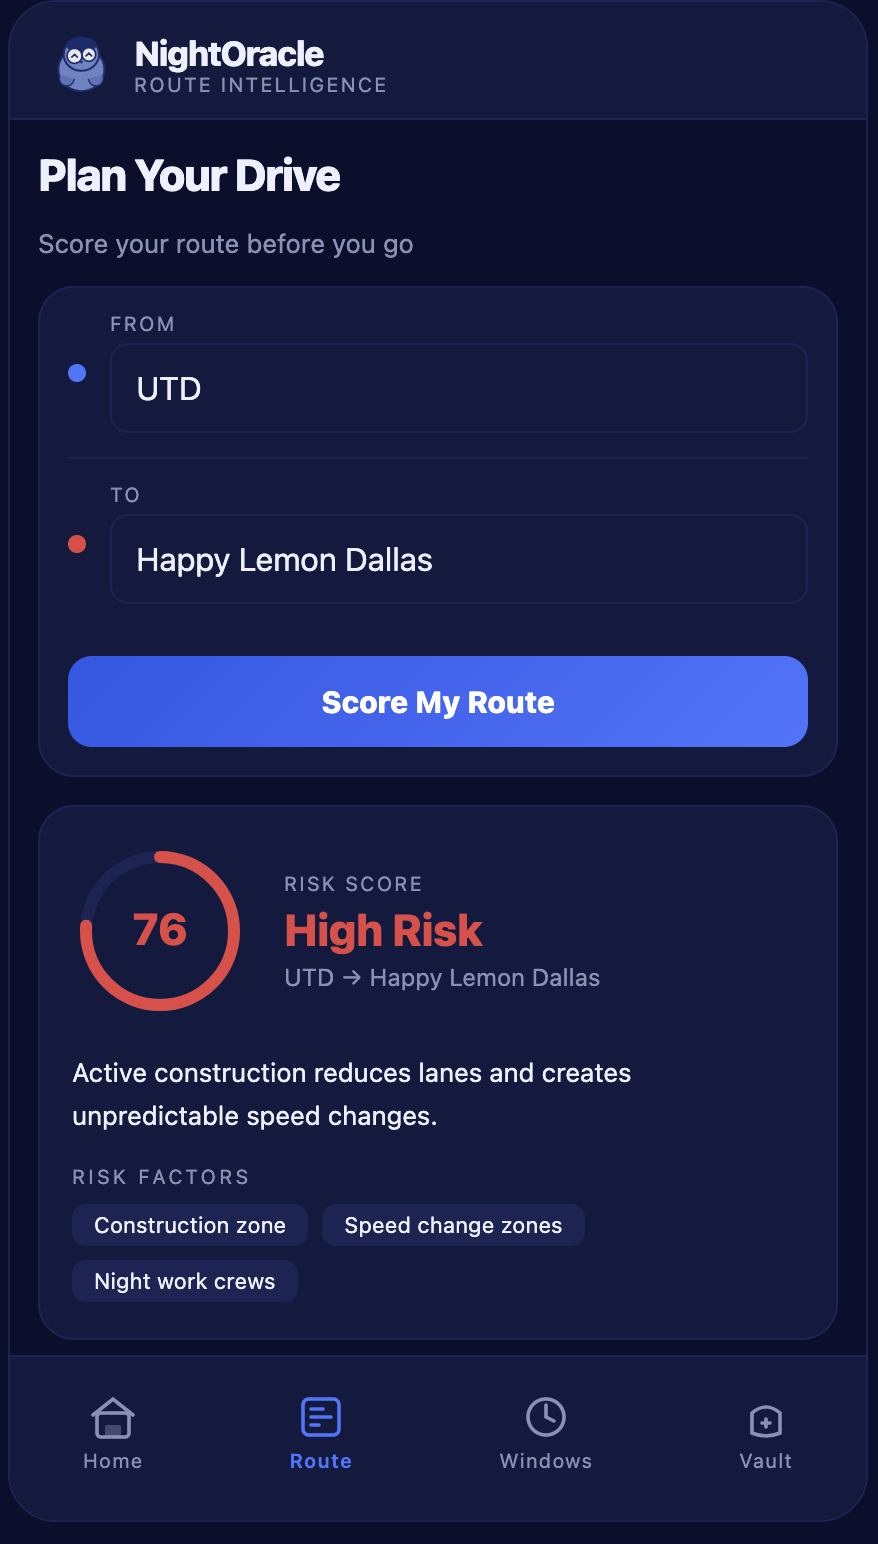
Route Page
-
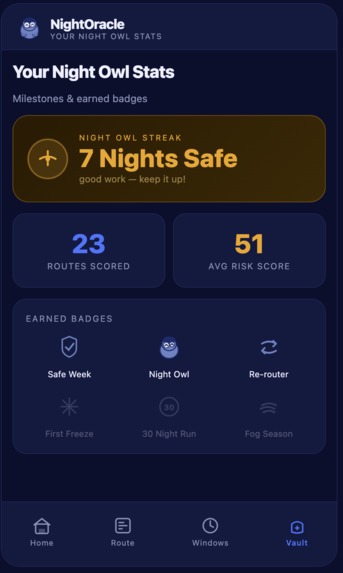
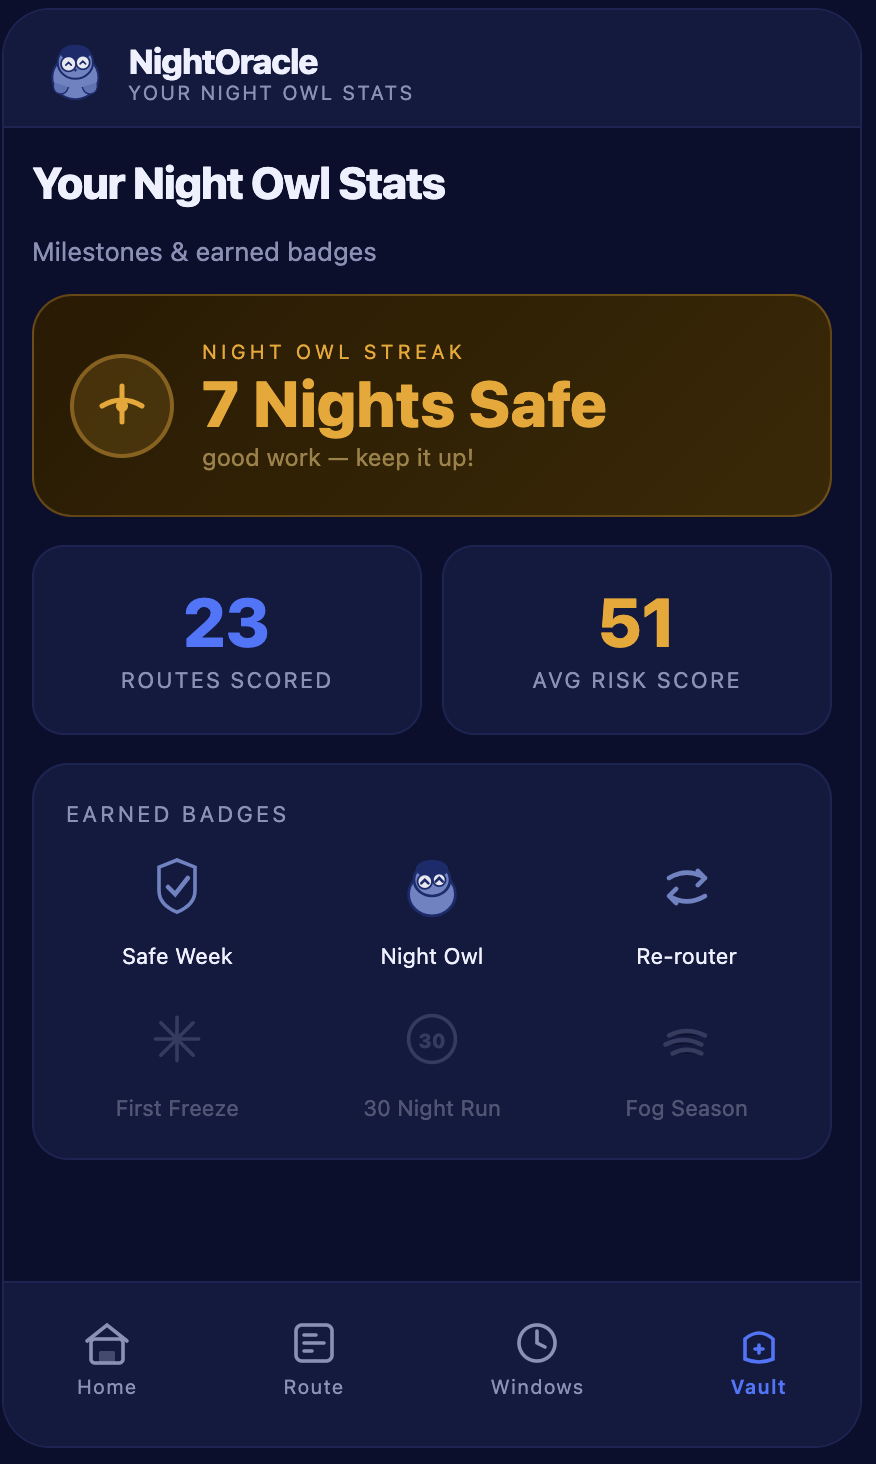
Vault Page
-
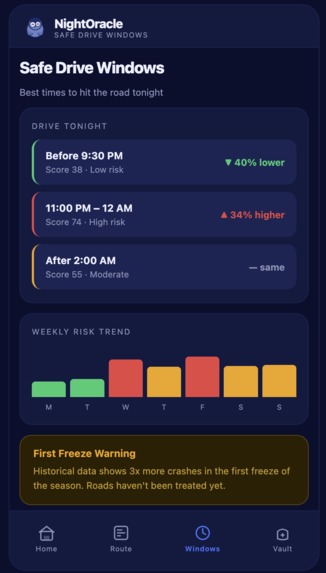
Windows Page


Inspiration
Every night, millions of people get in their cars without knowing that the conditions outside, not their driving skill, are the single biggest predictor of whether they will be in a crash. The NHTSA Fatality Analysis Reporting System has documented 20+ years of exactly when, where, and under what environmental conditions fatal crashes happen. That data is public. It is detailed. And nobody had built a consumer product that puts it in a driver's hands in real time.
The stat that started everything: 50% of traffic fatalities happen during 25% of driving hours at night. We wanted to know if we could turn a government archive into a live safety layer that tells you, before you leave the driveway, which parts of your route are statistically dangerous tonight and what to do about it.
What it does
NightOracle is a real-time driving risk assessment that scores road conditions before you drive, not your behavior, not your history, just the environment around you right now.
The SenseCAP Indicator reads live temperature and humidity. Our ML model is trained on 5 years of NHTSA fatal crash data and scores your route segment by segment from 0 to 100. Gemini translates the model's feature importances into a plain-English explanation that references actual local crash history: "382 fatal crashes happened in conditions like tonight's in Dallas County between 2010 and 2024."
When you hold the SenseCAP sensor in your hand and watch the score update live as your body heat raises the temperature reading. In one moment, conditions change, risk changes, you know about it before you drive.
How we built it
React + Tailwind CSS - Mobile-first frontend with live score card, color-coded Google Maps route overlay, and engagement features including streaks, badges, and weekly risk trend chart.
FastAPI - Core backend API hosted on Vultr, handling sensor ingestion, model inference, route segmentation, and Gemini explanation endpoints.
Gradient Boosting Classifier (scikit-learn) - Trained on the NHTSA FARS dataset filtered for nighttime fatal crashes. Features: temperature, humidity, hour, day of week, month, light condition, road type. Returns a 0-100 risk score and feature importances per prediction.
Gemini API - Receives feature importances from the model and generates plain-English, context-specific safety explanations with historical crash counts.
Google Maps Directions API + Maps JS API - Returns route polylines for segmentation and renders per-segment color grading on the frontend map.
SenseCAP Indicator - Reads live temperature and humidity via USB serial, polled every 30 seconds by a Python script that POSTs directly to the Vultr backend.
Grove Light Sensor - Detects ambient light level in real time via the Arduino Base Shield. When readings drop below the darkness threshold, the system automatically activates night mode and weights the risk score accordingly, since low-light conditions are among the strongest predictors of fatal crashes in the FARS data.
Grove Temperature Sensor - Serves as a hardware fallback if the SenseCAP connection drops. The poller script automatically switches to this sensor and continues pushing readings to the backend without interrupting the live score.
OpenWeatherMap API - Supplements local sensor data with city-scale weather conditions.
Vultr - Hosts the FastAPI backend and React frontend on an Ubuntu VPS behind nginx.
Challenges we ran into
Getting the SenseCAP to reliably send over USB serial was our first blocker. The port enumeration differs across Mac, Windows, and Linux, and we had to handle reconnection logic when the cable was bumped during demo setup.
The NHTSA FARS dataset required significant cleaning before it was usable. Fatal crash records span 20+ years with inconsistent column naming across years, missing environmental readings, and state-specific encoding differences. Getting a clean feature matrix took longer than expected.
Keeping latency under 40 seconds where the sensor read to dashboard update, required careful profiling. The Gradient Boosting inference was fast. The Gemini call was the bottleneck, which is why the cache mattered.
This was our first time working with hardware, so we ended up doing a lot of trial and error with the parts whether it be rebooting them or flashing SD cards.
Accomplishments that we're proud of
The live sensor-to-score pipeline actually works. You hold the SenseCAP, the temperature rises, and the risk score updates on screen within 35 seconds. Causality is visible in real time, that is the thing we are most proud of because it makes the product actually work.
We trained a Gradient Boosting classifier on real federal crash data and hit above our 88% accuracy target on the holdout set. Every number on screen traces back to a real dataset, not a simulation.
The Gemini explanations reference actual crash counts from the FARS data. "382 crashes" is not a made-up number it is a lookup against the same dataset the model was trained on. That specificity is what makes the product feel trustworthy rather than generic.
We designed the privacy architecture before we wrote a single line of frontend code. Zero PII stored is not a disclaimer we added at the end it is a constraint we built around from the start.
What we learned
The hardest part of a real-time IoT pipeline is not the hardware or the model it is everything in between. Serial port handling, JSON parsing edge cases, network timeouts, and graceful fallbacks eat more time than the interesting ML work.
Gemini is genuinely useful when you give it structured inputs. Feature importances from a Gradient Boosting model are exactly the kind of grounded, specific context that makes LLM output trustworthy rather than hallucinated. The combination of ML for scoring and LLM for explanation is a pattern we would use again.
The NHTSA FARS dataset is an underused public resource. Twenty years of granular fatal crash records with environmental conditions attached.
What's next for NightOracle
Live integration with OpenWeatherMap for city-scale supplemental conditions beyond what the local sensor captures wind speed, precipitation, visibility.
Seasonal hazard flags generated from historical FARS patterns: first freeze of the season, fog season onset, high-ice-risk windows by geography. These are predictable from the data and highly actionable.
A safe departure window feature: "Leave before 10pm tonight conditions deteriorate after midnight and your risk score rises 40 points." The model can calculate this hourly; we just have not exposed it in the UI yet.
Longer term: if NightOracle ran passively in the background and nudged drivers toward safer time windows and routes over weeks, the aggregate claim reduction for an insurer would be measurable. That is the real product, not a single risk score, but a behavior change loop that compounds over a driving season.

Log in or sign up for Devpost to join the conversation.