-
-
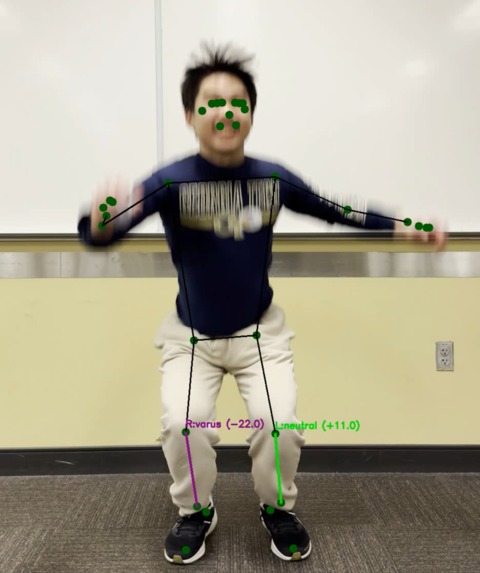
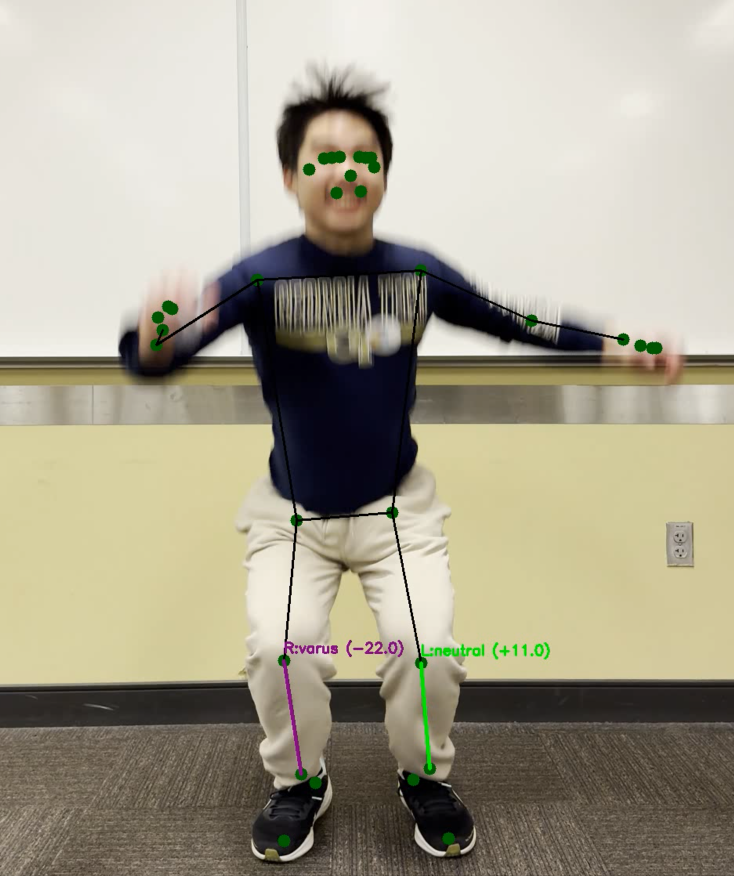
Trajectory Descent Visual Overlay
-
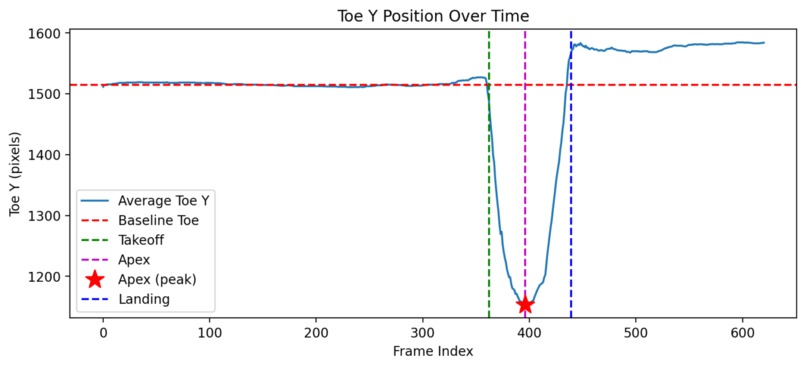
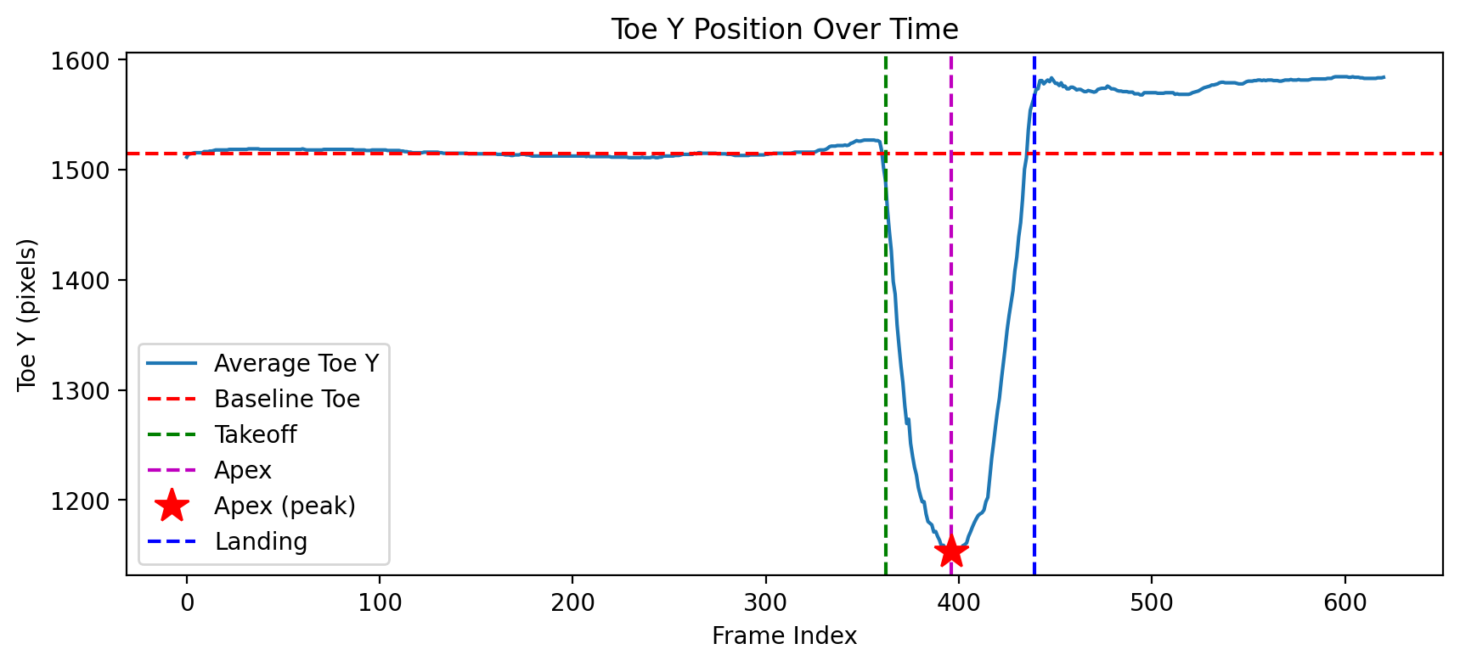
Body Pointer Tracking Over Time
-
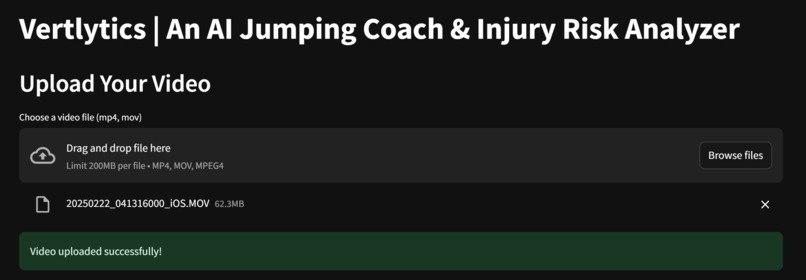
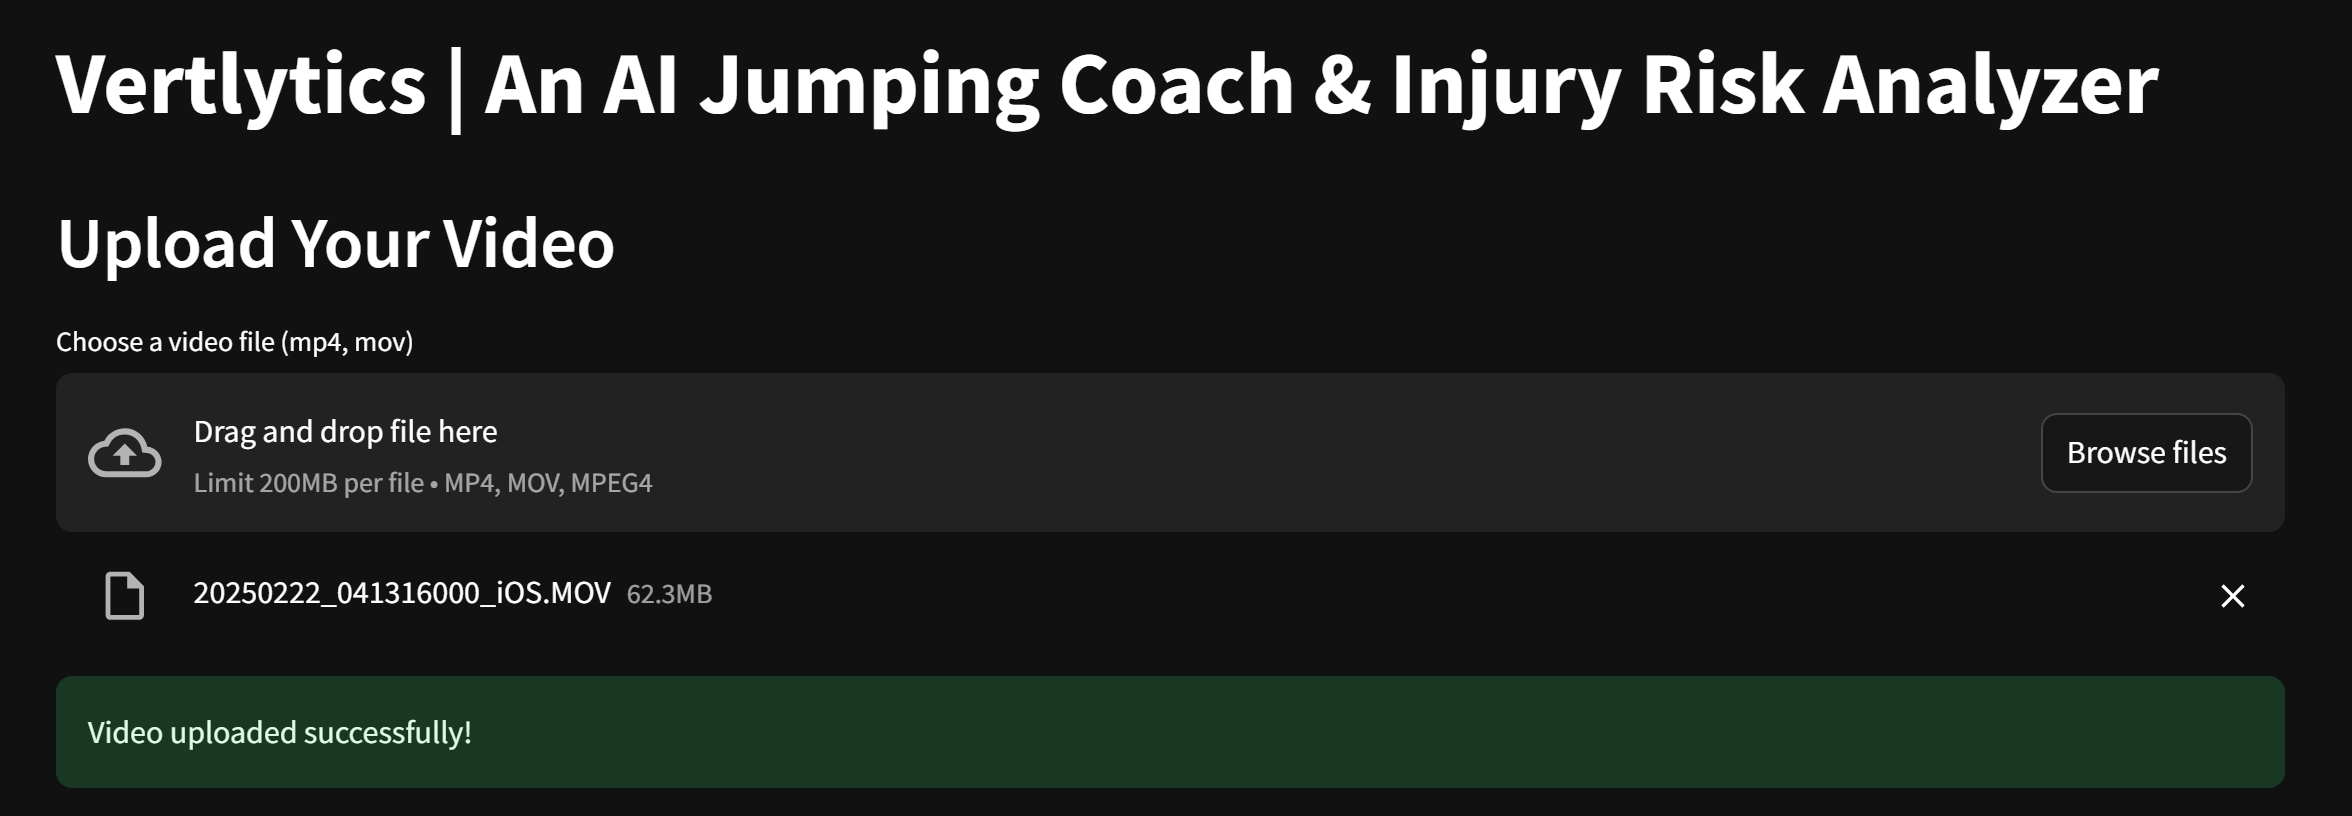
Vertlytics Webpage Header
-
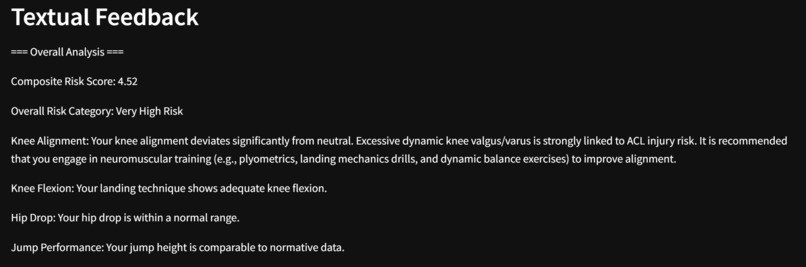
Tailored Recommendation System and Feedback

Introduction
Vertlytics is an innovative, data‑driven web application that leverages computer vision and AI to perform comprehensive lower-body movement analysis from a single video input. Our goal is to democratize professional-level biomechanical analysis, making it accessible to both elite athletes and the general public. By analyzing key metrics derived from a front‑view video of a vertical jump, Vertlytics provides personalized insights and actionable recommendations to help users prevent injuries, especially those related to ACL stress, and improve overall athletic performance.
Background
The Need for Accessible Biomechanical Analysis
In high-impact sports like basketball and volleyball, improper landing mechanics can lead to serious injuries, including ACL tears, chronic knee pain, and long-term mobility issues. However, advanced biomechanical analysis tools are traditionally expensive and reserved for professional settings. Vertlytics fills this gap by enabling users to capture and analyze their jumping mechanics using nothing more than a smartphone camera. The insights provided can be transformative—not only for athletes but also for individuals seeking to prevent injuries from everyday activities.
Inspiration and Concept
The idea for Vertlytics was born from the realization that many sports injuries and movement inefficiencies stem from subtle biomechanical imbalances. Our team recognized that if we could harness modern computer vision techniques and advanced data analytics, we could develop an accessible tool to analyze these critical factors. Vertlytics is designed to give real-time, understandable feedback, allowing users to make informed decisions about their training and rehabilitation.
What Vertlytics Does
Vertlytics offers a multi-faceted analysis of a user’s jump, providing both visual and textual feedback. Key functionalities include:
- Video Analysis: Users upload a single front‑view video of a vertical jump. The system processes the video in real time using computer vision (via OpenCV, MediaPipe, and FFmpeg) to extract key biomechanical landmarks (e.g., toe, knee, hip, ankle).
- Metric Extraction: Vertlytics computes critical metrics such as:
- Knee Alignment (Valgus/Varus): Quantifies how much the knee deviates from neutral during landing.
- Knee Flexion Angle: Measures the degree of knee bend on landing to assess shock absorption.
- Hip Drop: Evaluates the difference between baseline and landing hip positions to identify core and gluteal stability.
- Jump Height: Uses time-of-flight calculations to estimate vertical jump performance.
- Asymmetry & Variability: Assesses differences between left and right limbs and consistency during landing.
- Risk Scoring: Our multi-dimensional risk scoring engine aggregates these metrics, compares them against normative data derived from sports biomechanics literature, and computes a composite risk index. The result is mapped to detailed risk categories such as “Optimal,” “Good,” “Moderate Risk,” “High Risk,” and “Very High Risk.”
- Personalized Recommendations: Based on the risk scoring and component analyses, Vertlytics delivers tailored advice, ranging from corrective landing drills to targeted strength training exercises, ensuring that every user receives actionable feedback.
- Interactive Visualizations: Users can view overlaid video feedback that highlights key events (e.g., takeoff, apex, landing, knee alignment changes) along with interactive plots and detailed textual analytics, all within an intuitive, dark-themed web interface.
Data-Driven Insights and Machine Learning Applications
Leveraging Biomechanical Datasets
At the core of Vertlytics is a robust, data-driven approach to biomechanical analysis. In developing our risk-scoring and performance metrics, we drew on several high-quality datasets and research sources:
- We utilized insights from the CMU Motion Capture Database, which provides detailed recordings of human movement. This dataset helped us understand the variability in joint kinematics and establish baseline ranges for key parameters such as knee flexion and hip drop.
- The Human3.6M dataset offers extensive 3D motion data of everyday human activities, providing us with rich information on joint trajectories and inter-limb coordination, as well as a basis for feedback models with their Fit3D dataset applied to create their FitAI product. Such data was instrumental in designing our algorithms to calculate dynamic metrics from 2D video feeds.
- Several datasets on Kaggle focus on human movement, athlete performance, injury prediction, and more, offering additional context for normative values. We specifically referenced the Human Motion Dataset for Animation Design which contains data gathered from 30 participants who performed a variety of actions, including jumping, for the purpose of 3D analysis and modeling. For example, studies on jump performance and landing mechanics have helped us derive thresholds for metrics like ground contact time and knee alignment variability.
Research-Backed Biomechanics
- ACL Injury Risk: Hewett et al. (2005) demonstrated that excessive dynamic knee valgus is a strong predictor of ACL injury in female athletes. This finding influenced our focus on measuring knee alignment deviations, quantified as the “knee delta,” representing the horizontal distance between the knee and ankle.
- Landing Mechanics: Myer et al. (2005) and others have shown that insufficient knee flexion at landing increases the risk of impact-related injuries. Vertlytics computes knee flexion angles using geometric models and compares them against normative values to assess landing quality.
- Neuromuscular Control and Asymmetry: Studies have linked imbalances in lower limb mechanics, such as asymmetry in knee alignment and variability in joint kinematics, to increased injury risk. By analyzing these factors over the landing phase, Vertlytics provides a comprehensive risk profile.
Machine Learning and Data Analytics
- Data Normalization and Z-Scoring: Each biomechanical metric (e.g., knee alignment, hip drop, jump height) is normalized against established normative values (sourced from the literature and datasets such as Human3.6M). We compute z-scores to quantify how much a user’s performance deviates from the norm.
- Composite Risk Scoring: Our composite risk score is generated by combining several weighted metrics using regression-based techniques. For example, higher weights are assigned to dynamic knee alignment and knee flexion deficits due to their strong association with ACL injury risk. The resulting score maps onto a detailed risk scale ranging from “Optimal” to “Very High Risk.”
- Personalized Recommendations: Based on the composite score and individual component scores, our recommendation engine delivers tailored advice. If the data indicates excessive knee valgus or a stiff landing, the system suggests targeted neuromuscular training, plyometric drills, or unilateral strength exercises to correct the deficiencies.
References
- CMU Motion Capture Database
- Human3.6M Fit3D Dataset
- Kaggle Human Motion Dataset for Animation Design
How We Built It
Technical Stack
- Programming Language: Python
- Computer Vision: OpenCV, MediaPipe
- Video Processing: FFmpeg (integrated via subprocess)
- Web Framework: Streamlit
- Data Visualization: Matplotlib (with potential expansion to Plotly/Altair for interactive charts)
- Deployment: Streamlit Community Cloud (with containerization options via Docker for custom OS-level dependencies)
System Architecture & Workflow
- Video Upload & Preprocessing
- Pose Estimation & Metric Extraction
- Risk Analysis & Recommendation Engine
- User Interface & Visualization
Challenges and Solutions
Video Conversion and Compatibility
Problem: HTML5 video players can be picky about codecs. Our initial MP4 files sometimes wouldn’t play. Solution: We integrated FFmpeg to convert videos to H264-encoded MP4 with a forced pixel format (yuv420p). For .mov files, we pre-converted them using OpenCV, and then applied FFmpeg conversion. We also addressed rotation issues by ensuring proper orientation during conversion.
Resource Constraints
Problem: Processing video in real time, especially on cloud deployments, can be resource-intensive. Solution: We optimized our code for efficiency, employed caching where possible, and deployed the app on Streamlit Cloud with Docker (or using Streamlit Cloud’s packages.txt) to install FFmpeg and meet resource requirements.
Accuracy in Biomechanical Analysis
Problem: Accurately extracting and interpreting biomechanical metrics from a single video can be challenging due to variations in camera angle, lighting, and user technique. Solution: We used standardized landmark extraction (via MediaPipe) combined with physics and geometry to compute robust metrics (e.g., knee flexion angles, hip drop). Our composite risk score aggregates multiple dimensions (alignment, flexion, jump performance, etc.) to account for individual variability. One of the biggest challenges was the simplicity of analyzing a single point of view. We had to account for variations in jump style and ensure that our analysis was accurate regardless of the angle or technique. This required using geometry and physics to interpret the movement in 2D space and make sure our results were meaningful. Since not everyone jumps in the same way, we had to ensure our measurements were based on global factors that would apply to most users. Striking a balance between simplicity (having just one video input) and accurate, personalized analysis was tricky, but we made it work by relying on standard metrics that could be generalized.
Accomplishments and Impact
We are incredibly proud of how we managed to overlay the analysis directly onto the video, making the results visually clear for users. This feature allows users to easily interpret the data and see where their movements could be improved. The layout of the app was another area where we focused a lot of effort, and we’re pleased with how intuitive and easy to navigate it is. Most of all, we're proud that we completed the project in just 36 hours, making it not only a functional tool but a polished product that users can immediately benefit from.
What We Learned
This project gave us our first experience using Streamlit, and we’re excited by its potential to quickly create and deploy web apps entirely within Python. We learned how to layer analysis directly on videos, frame by frame, which was an interesting and complex challenge. The ability to use OpenCV for video processing and apply mathematical models to real-world movement data was a huge learning curve, but we were able to make it work. It was a great experience to see how Python could be used in a practical, accessible way to solve a real-world problem, and we’re eager to build on this knowledge in future projects.
What's Next for Vertlytics
Looking ahead, there’s a lot more we want to add to the app. We plan to include more detailed metrics, such as muscle imbalances and detailed joint angles, to further improve our injury risk predictions. We also want to expand the app to assess upper body stability, which plays a crucial role in overall body balance and injury prevention. The potential to create a more comprehensive tool for movement health is exciting, and we’re looking forward to what’s next!
Conclusion
Vertlytics represents a breakthrough in making advanced biomechanical analysis accessible to everyone. By harnessing the power of AI and computer vision, we have developed a tool that not only identifies potential injury risks but also provides tailored, actionable recommendations to improve movement efficiency and prevent injuries. Whether you’re a professional athlete looking to optimize your performance or a fitness enthusiast aiming to safeguard your health, Vertlytics delivers professional-level insights with just one video. We are excited about the potential of Vertlytics and are committed to iterating on our design, integrating more advanced analytics, and expanding its capabilities to create the ultimate tool for movement health and injury prevention.


Log in or sign up for Devpost to join the conversation.