Important
Global API Integration & Licensing: Integrating Geopy, the ElectricityMaps API, and NASA POWER to allow users to simply type in their postal code to fetch live regional irradiance and grid carbon baselines. Because enterprise-grade live climate data requires paid commercial licensing, our next phase involves securing micro-grants or NGO sponsorships to fund this global data pipeline.
Inspiration
Solar adoption is often evaluated purely on standard hardware generation capacity. However, our model proves that geography drastically changes true solar impact. A solar panel installed in a region relying on coal-fired power delivers a radically different environmental return on investment compared to one placed where the grid is already powered by renewables. We built HelioScope to visualize this regional disparity and show where solar installations yield the maximum carbon displacement.
What it does
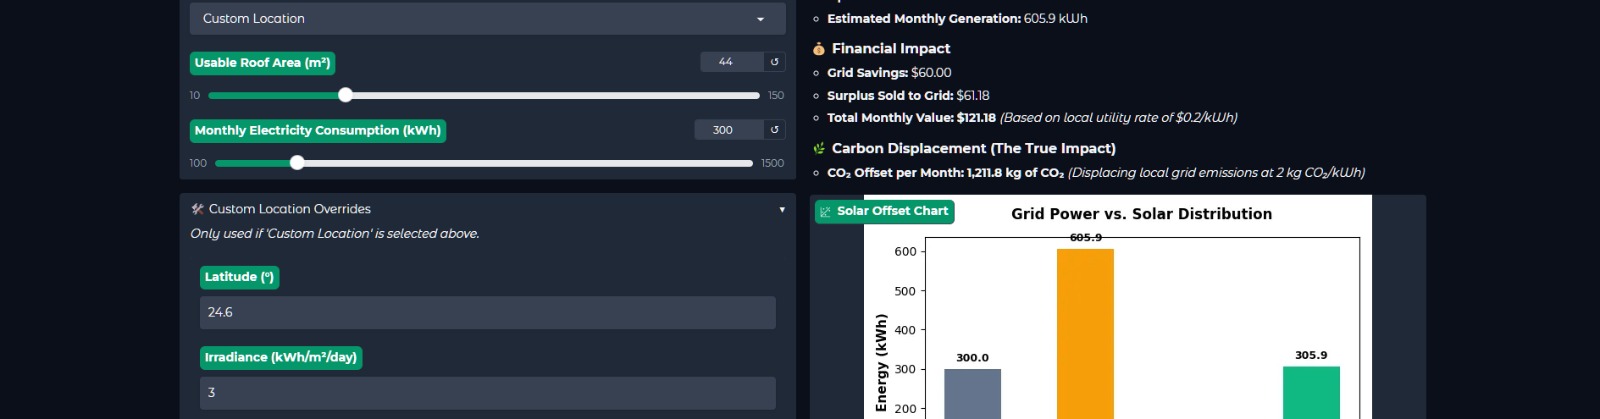
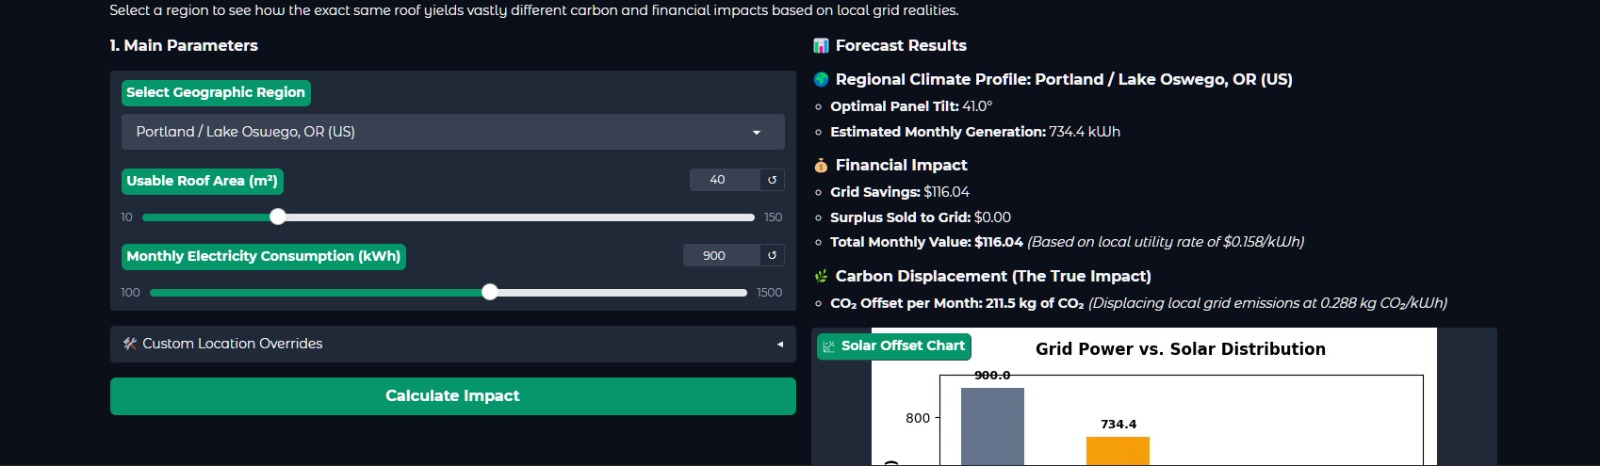
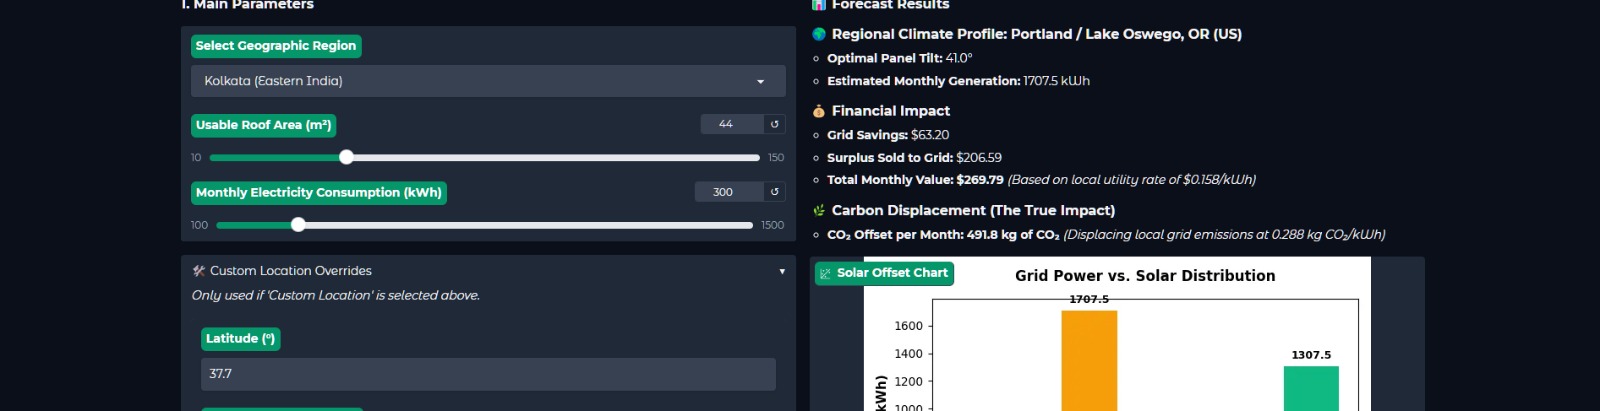
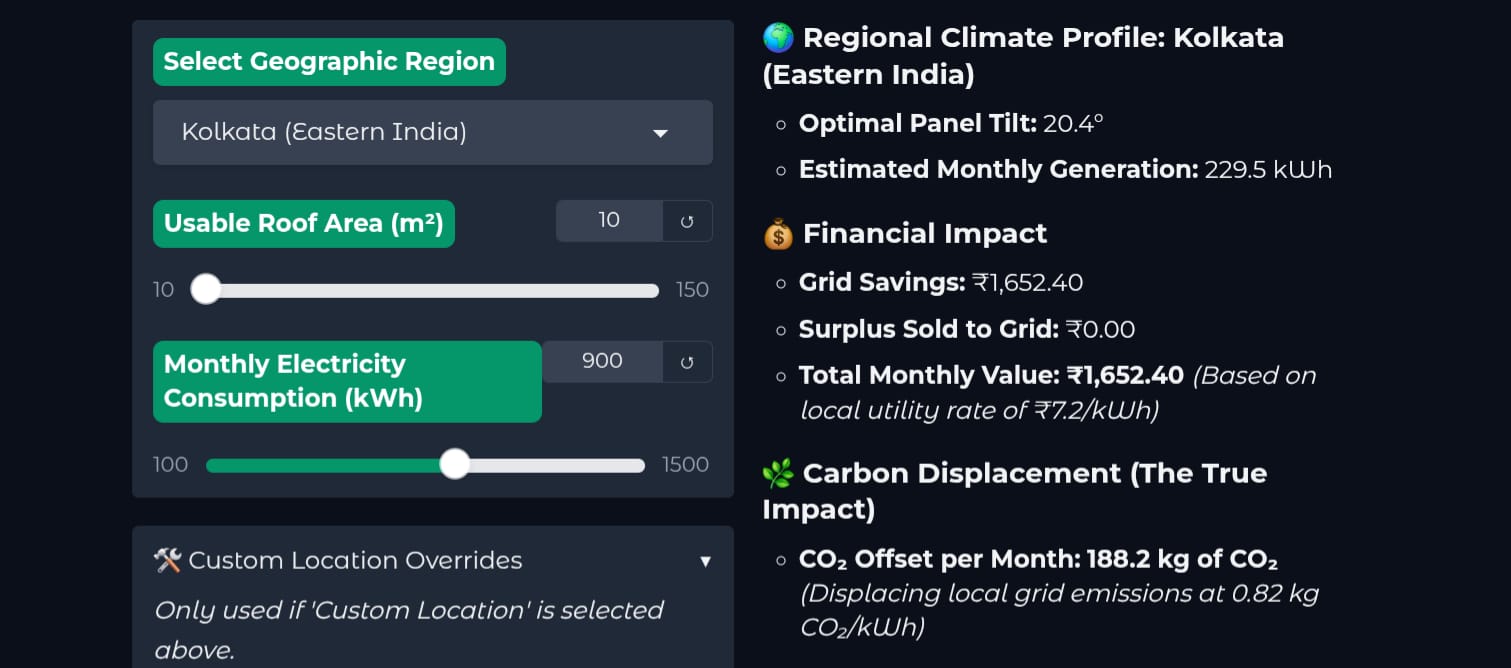
HelioScope models real-world energy generation, cost savings, and net carbon offset based on precise location inputs.
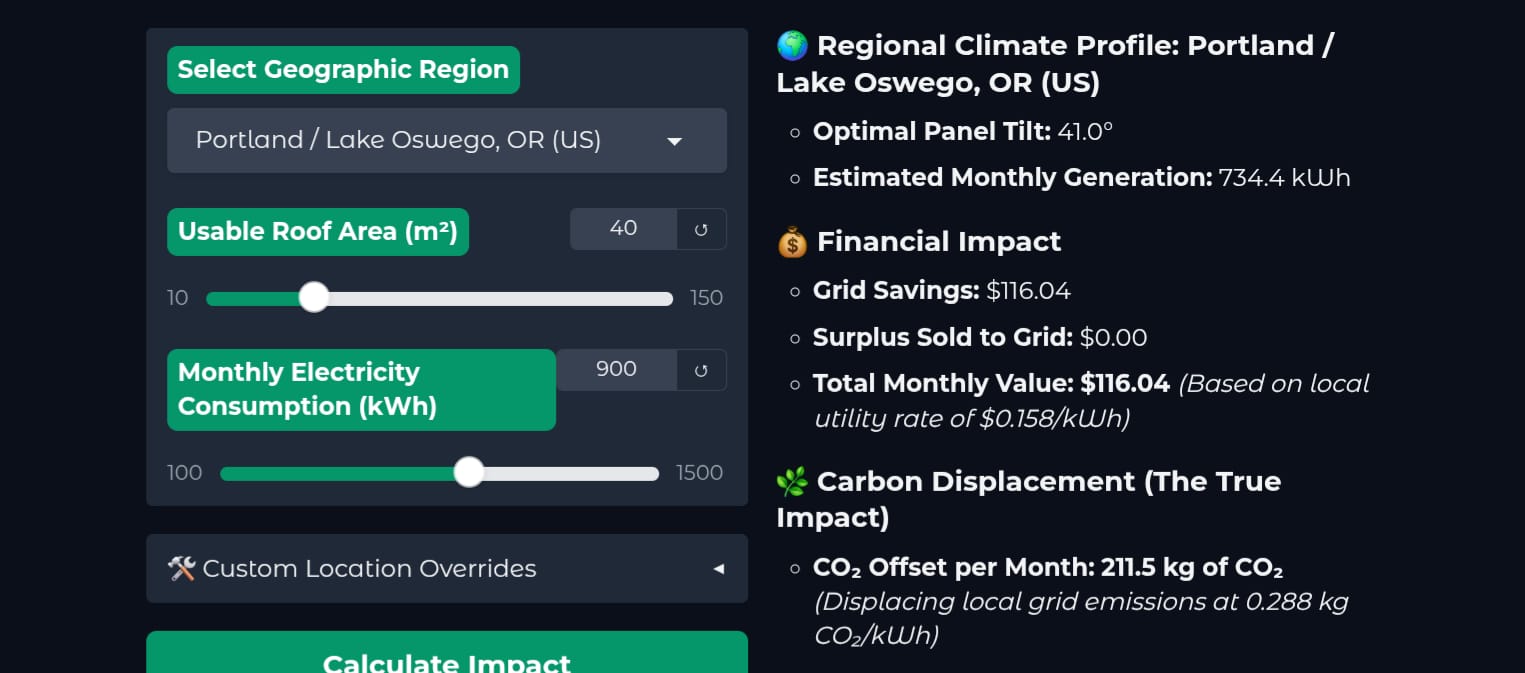
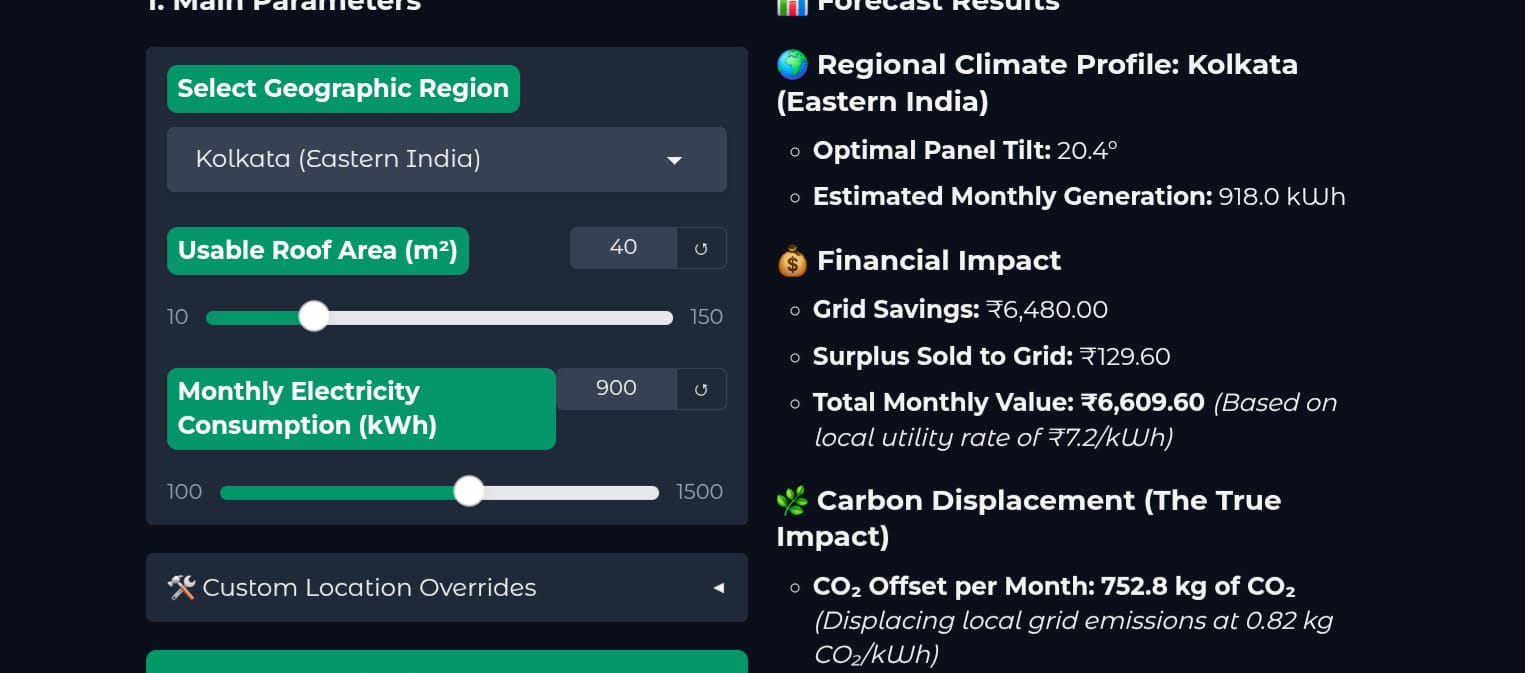
To demonstrate this contrast, consider a standard 40 m² residential rooftop installation:
- The Portland Baseline (US Pacific Northwest): Generates ≈660 kWh/month, saving the homeowner ≈$104 monthly. However, it offsets ≈190 kg of CO₂ because the local grid (NWPP) is already heavily driven by clean hydro power.
- The Kolkata Contrast (Eastern India): The exact same 40 m² roof generates ≈918 kWh/month and saves ≈₹6,600 monthly. Crucially, it offsets a massive ≈753 kg of CO₂ because it directly displaces a coal-heavy grid.
The Key Insight: Installing a solar panel in a developing grid like India's yields nearly 4× the carbon offset impact compared to the US Pacific Northwest.
How we built it
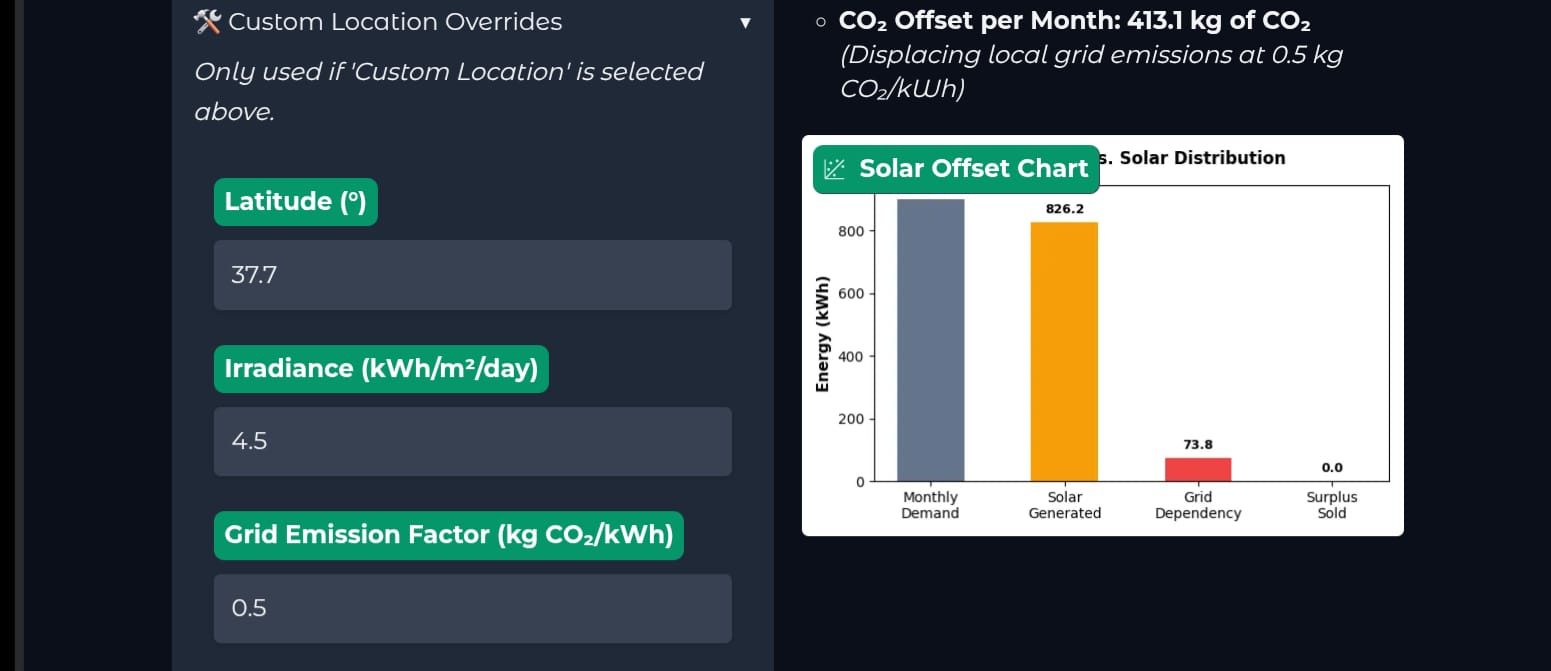
The backend calculation engine was developed in Python using Google Colab for rapid iterative testing. We built custom regional data dictionaries to handle specific local metrics. The frontend interface was wired dynamically using Gradio, allowing users to interact with sliders and instantly visualize the comparative analysis without needing environmental engineering knowledge.
Challenges we ran into
- Accounting for Real-World Losses: Standard solar formulas assume perfect conditions. We calibrated our engine with a realistic 0.85 derating performance factor to account for unavoidable inverter heat, wiring resistance, and panel dust.
- Reconciling Grid Realities: Mapping two completely different energy structures required structuring custom regional preset lookups rather than applying an inaccurate global average.
Accomplishments that we're proud of
Building a fully functional, interactive web interface using Python and Gradio from scratch within the hackathon time limit. We are incredibly proud of successfully translating complex environmental data (regional carbon emission factors and irradiance) into a clean mathematical backend that produces instant, visually accessible comparisons.
What we learned
As high school developers, we learned how to build and deploy rapid web UIs using Gradio and how to generate dynamic data visualizations with Matplotlib. More importantly, we learned the crucial difference between hardware capacity (kWh generation) and actual environmental impact (carbon displacement), realizing that geographic context is everything in climate tech.
What's next for HelioScope
- Global API Integration & Licensing: Integrating Geopy, the ElectricityMaps API, and NASA POWER to allow users to simply type in their postal code to fetch live regional irradiance and grid carbon baselines. Because enterprise-grade live climate data requires paid commercial licensing, our next phase involves securing micro-grants or NGO sponsorships to fund this global data pipeline.
- Computer Vision Roof Detection: Integrating satellite imagery APIs to automatically calculate usable roof area rather than relying on manual user inputs.
Research & References
- US Data: U.S. EPA eGRID NWPP subregion; EIA Form 861.
- India Data: India Central Electricity Authority; WBSEDCL tariff schedule.
- Solar Irradiance: NREL PVWatts & MNRE eastern India data.
Built With
- epa
- google-colab
- gradio
- matplotlib
- nrel-pvwatts
- python


Log in or sign up for Devpost to join the conversation.