Inspiration - Datatable, one of the most popular javascript table plugin, has almost everything for free but the hierarchy display of data is a paid version. Mostly financial companies require, hierarchy grid along with basic features such as search, sort to analyze their account statement. So thought of solving the problem in a day.
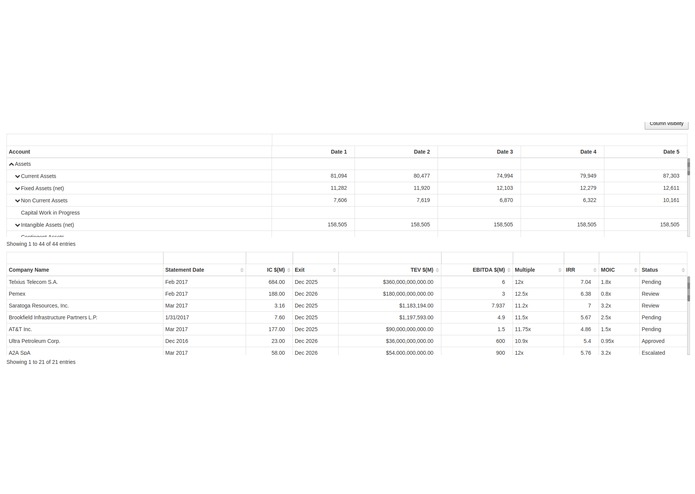
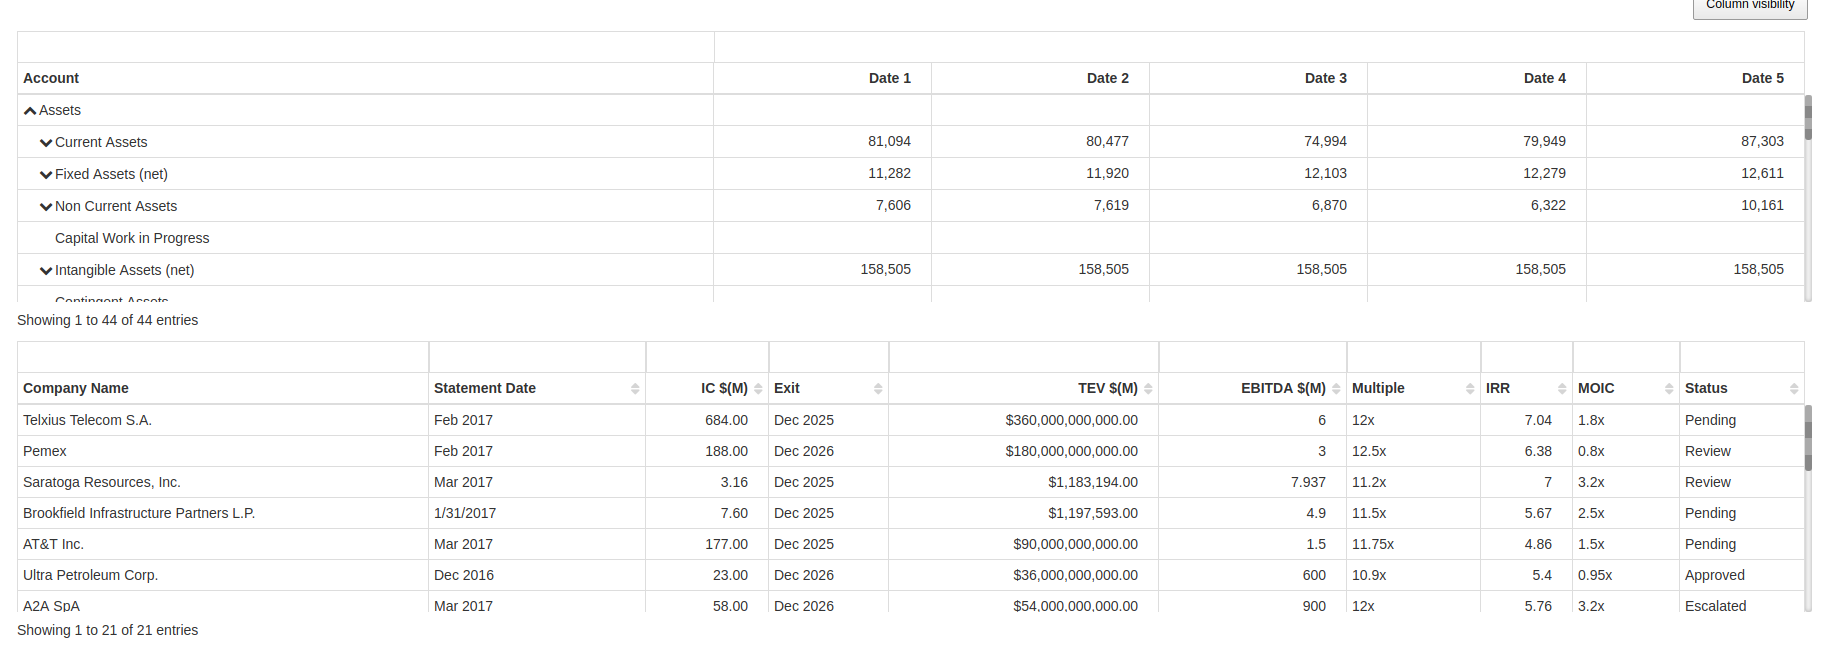
What it does- This plugin takes JSON data in hierarchy format, parent-child relationship, and generates an HTML table with hierarchy. Features such as inline editing, keeping in mind the datatype that is being edited, along with the log of the previous value, column shuffling, column visibility, search on a node and get not only the node but also its parent - this feature helps for better analysis of the data, column level customization.
How I built it - used javascript as it is fast, unlike server-side languages that take time in computation and returning the data.
Challenges I ran into - for every customizable plugin, the main problem is to re-initialize the plugin with the new data that comes in with ajax calls. So had to destroy the instance of the plugin, creating the same instance again. The other one is to give each object that calls the plugin its own plugin object which can be used to get data or destroy manually and other basic tweak functions.
Accomplishments that I'm proud of - Given that I had one day to develop along with testing and implement without any basic errors.
What I learned - Implementing Javascript as object-oriented architecture
What's next for Hierarchy Datagrid - next is to implement tagging of data in the grid. This feature is very useful for a financial firm as they need to search the dataset on particular tags. Rather than searching the entire dataset, tags can help query the large dataset, as observed in financial firms, quickly.

Log in or sign up for Devpost to join the conversation.