-
-
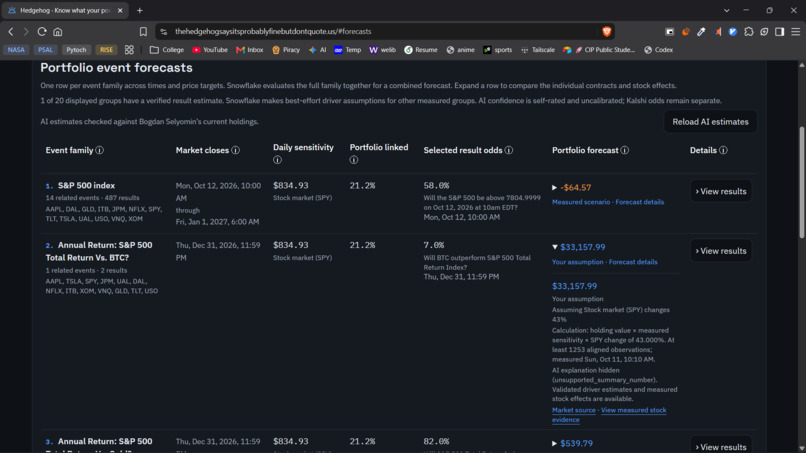
Forecasts
-
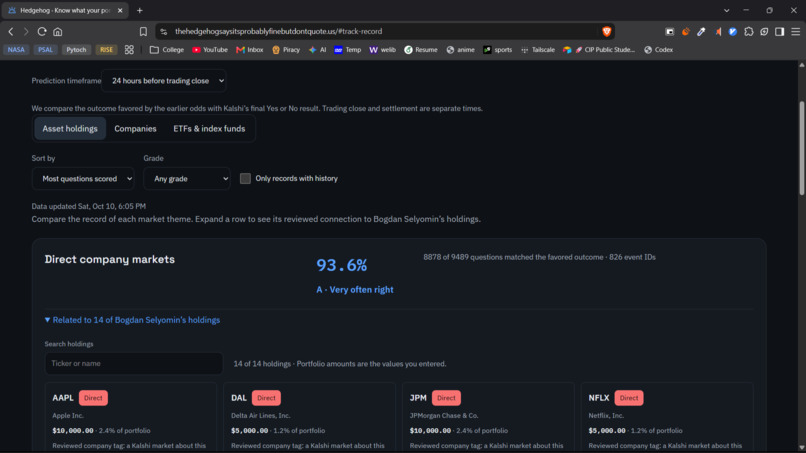
Track Record
-
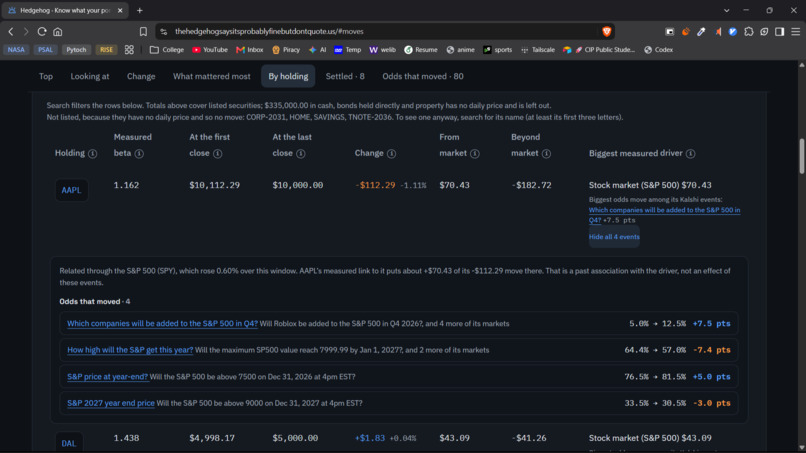
Stock Moves
-
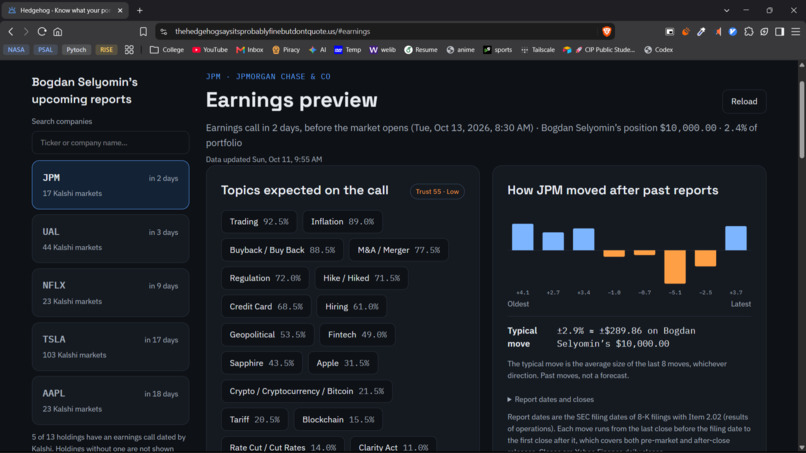
Earnings
-
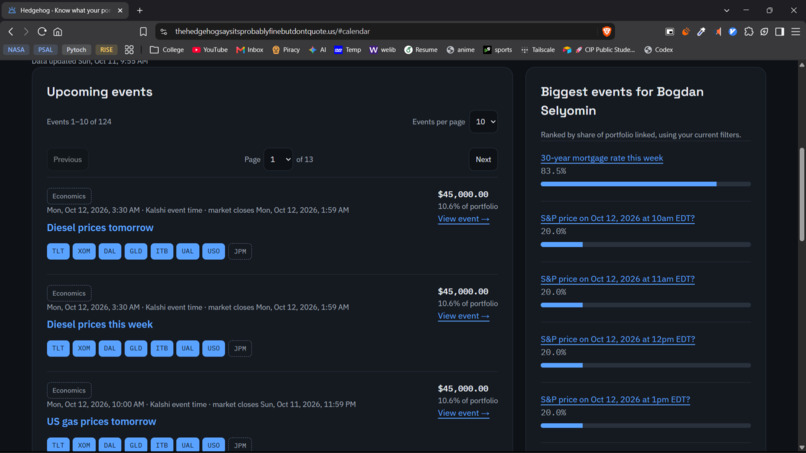
Calendar
-
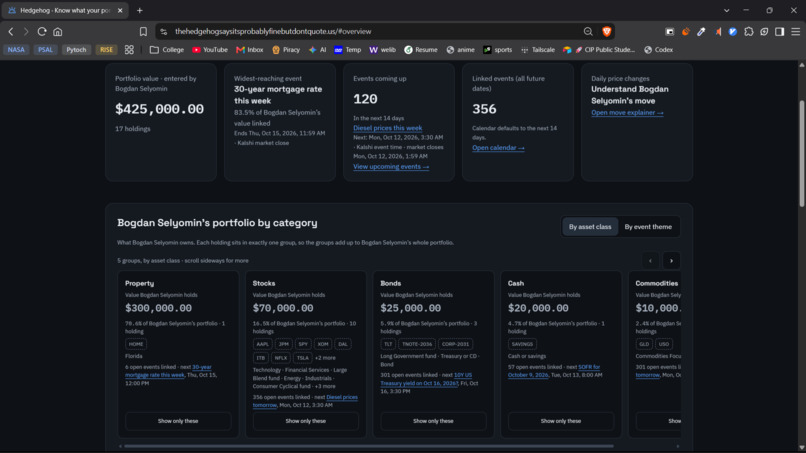
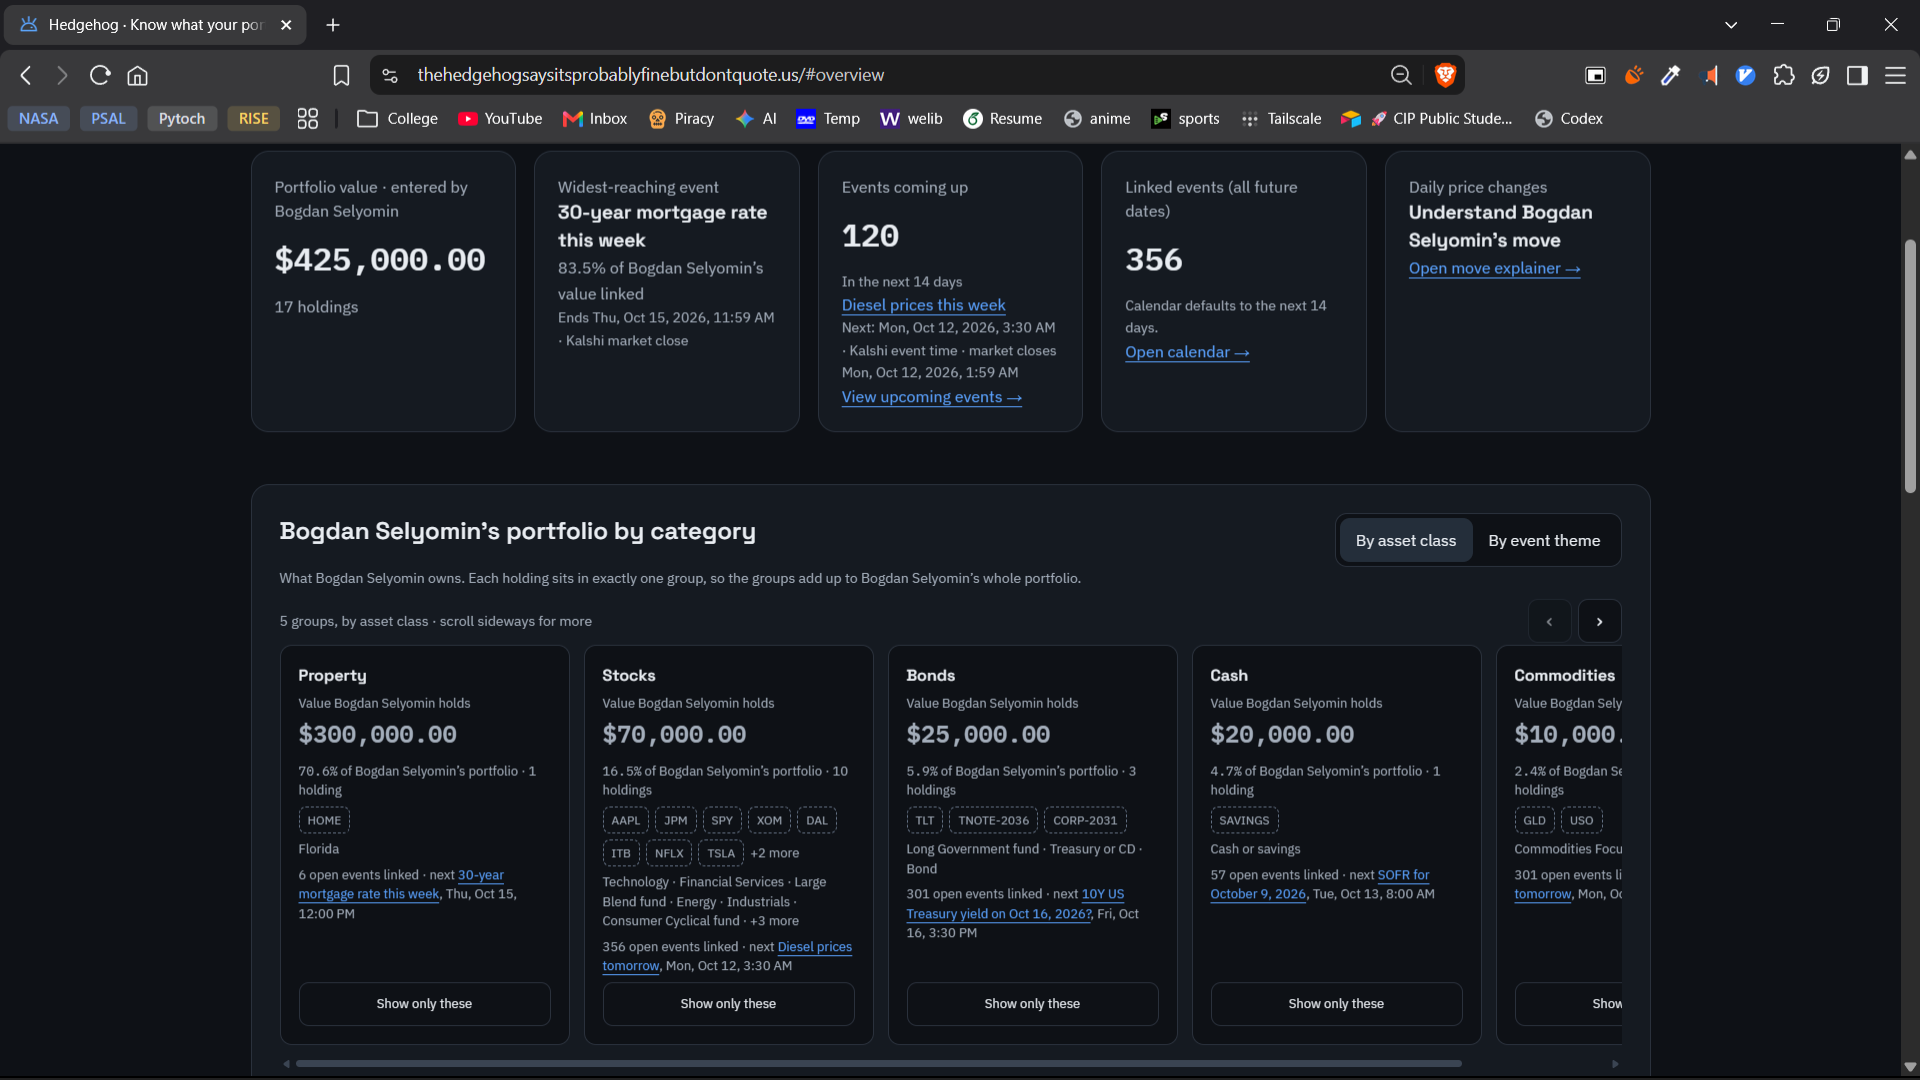
Category Breakdown
-
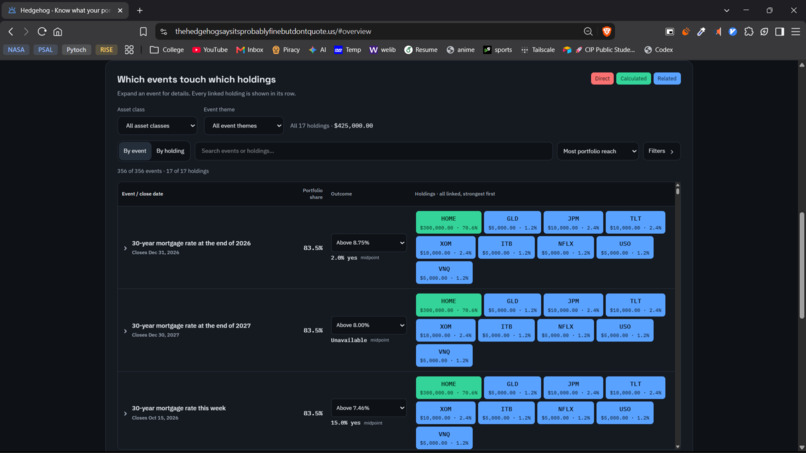
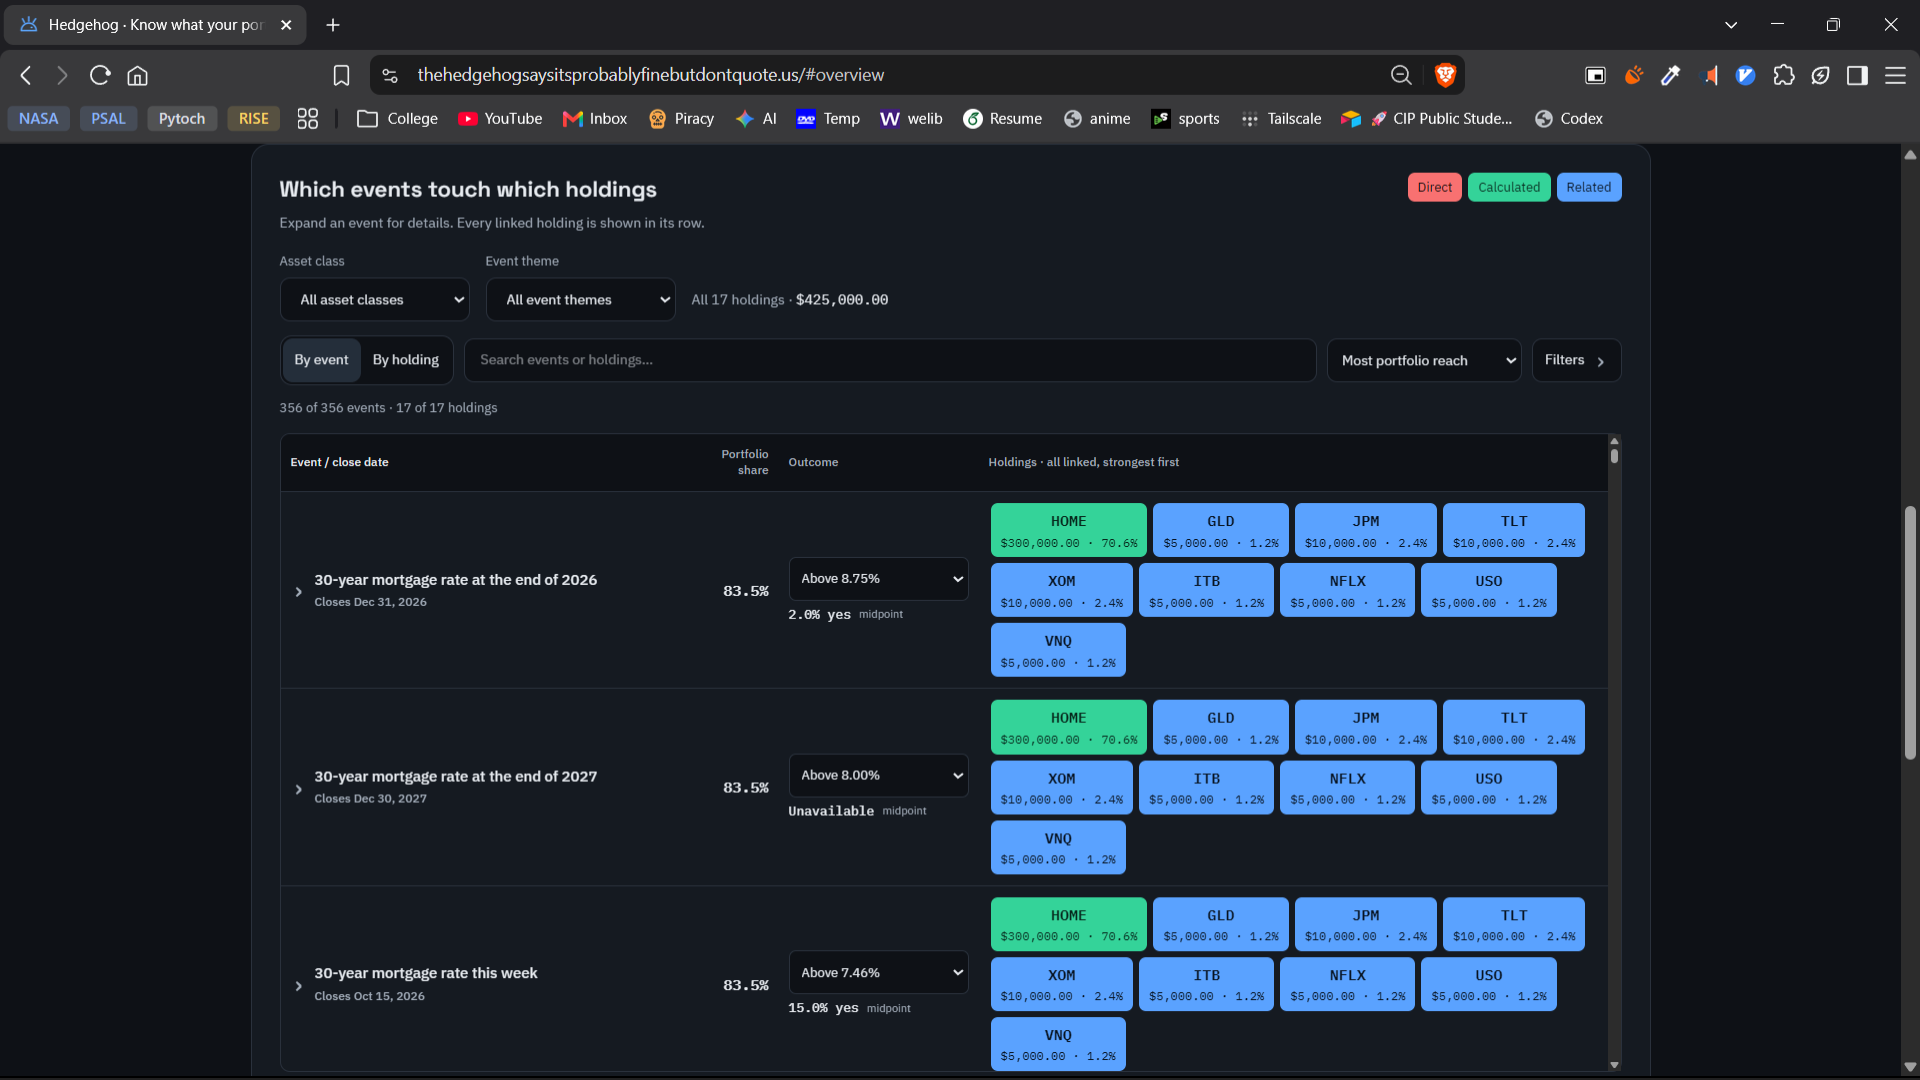
Holdings Breakdown
TL;DR
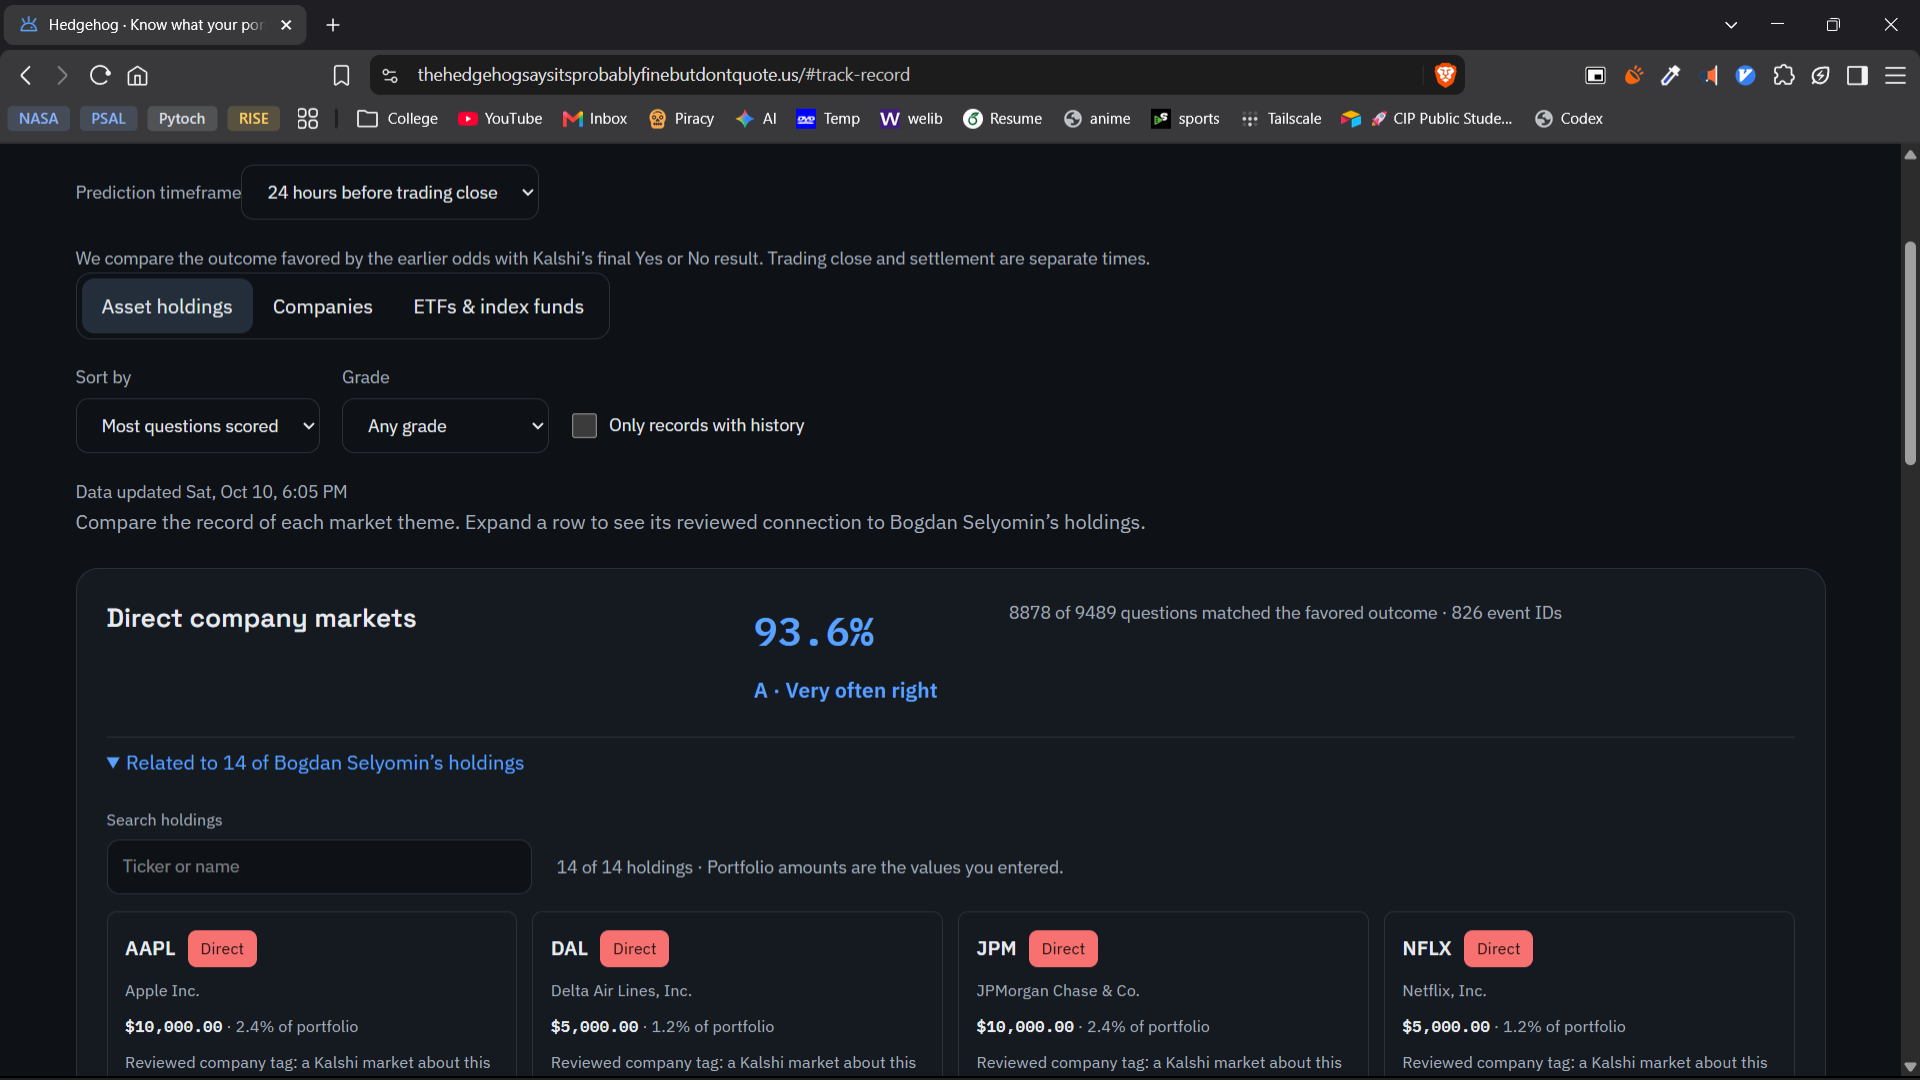
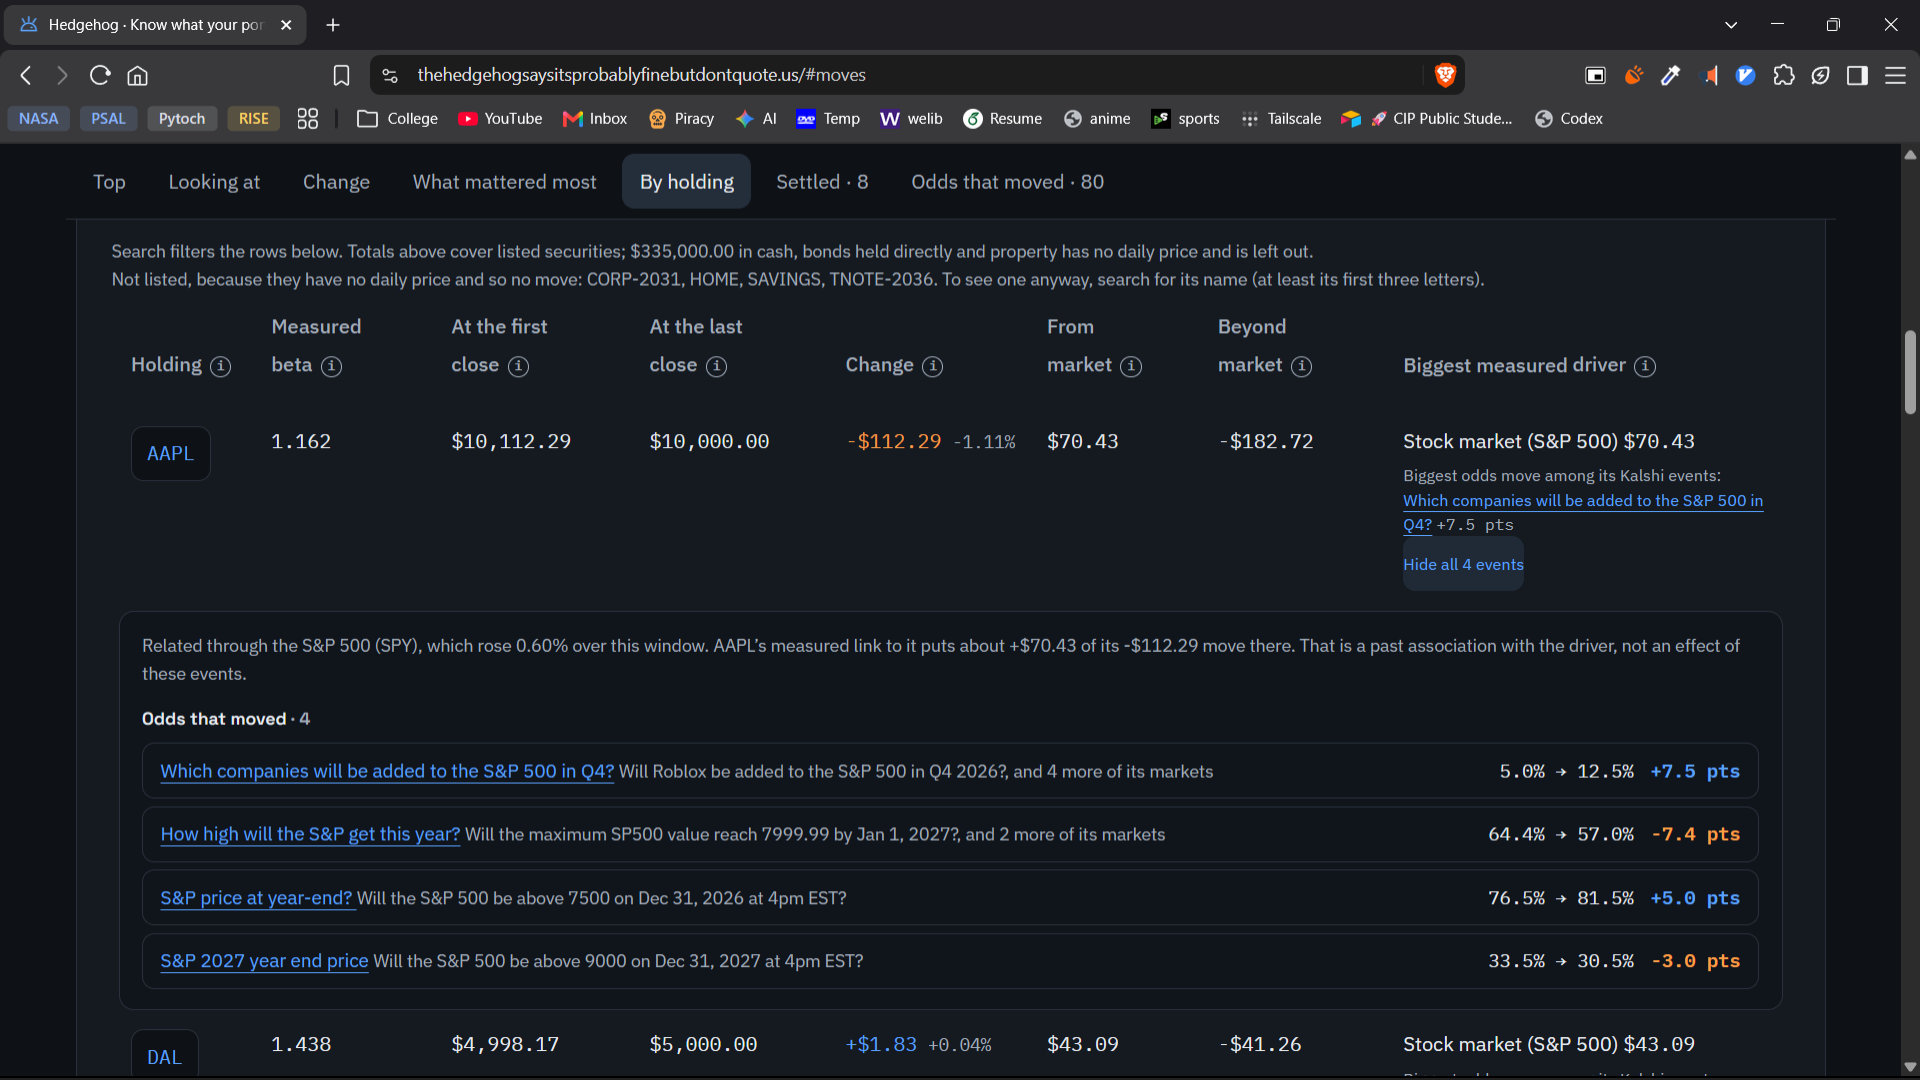
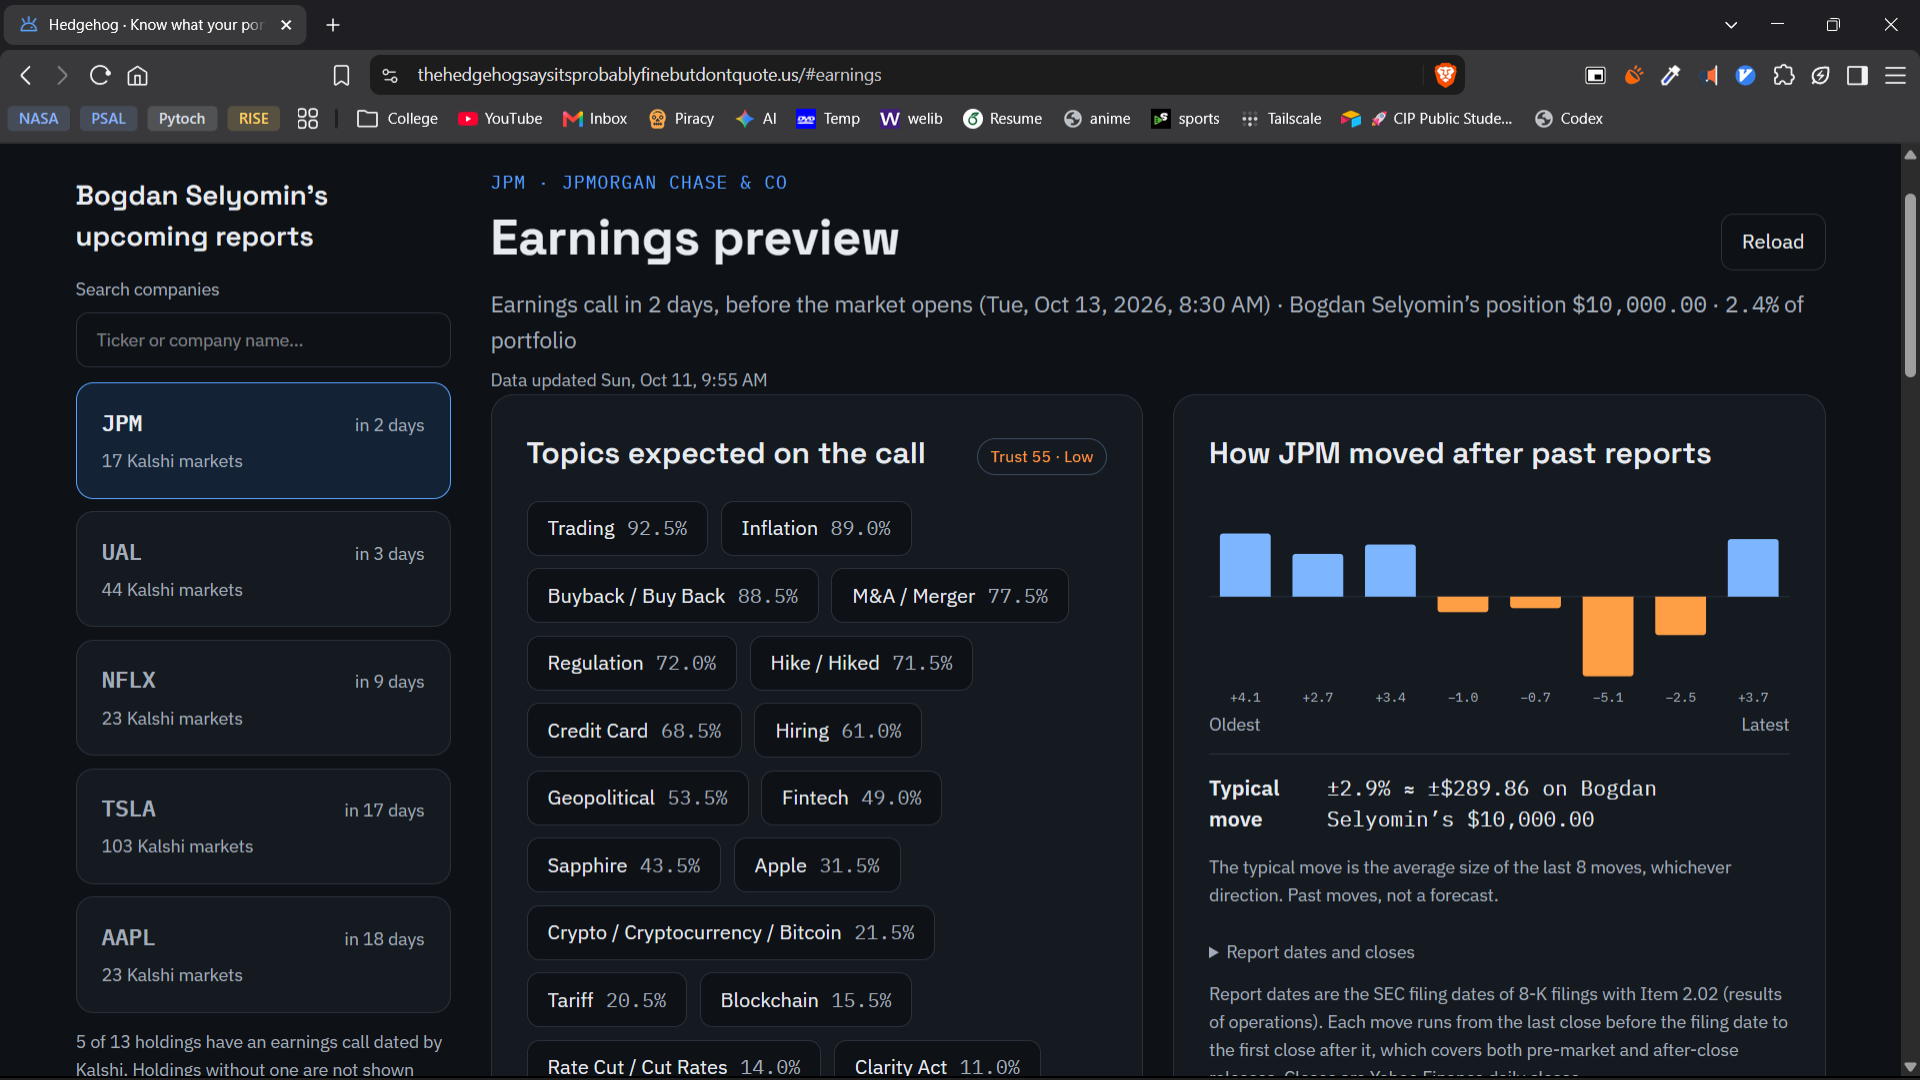
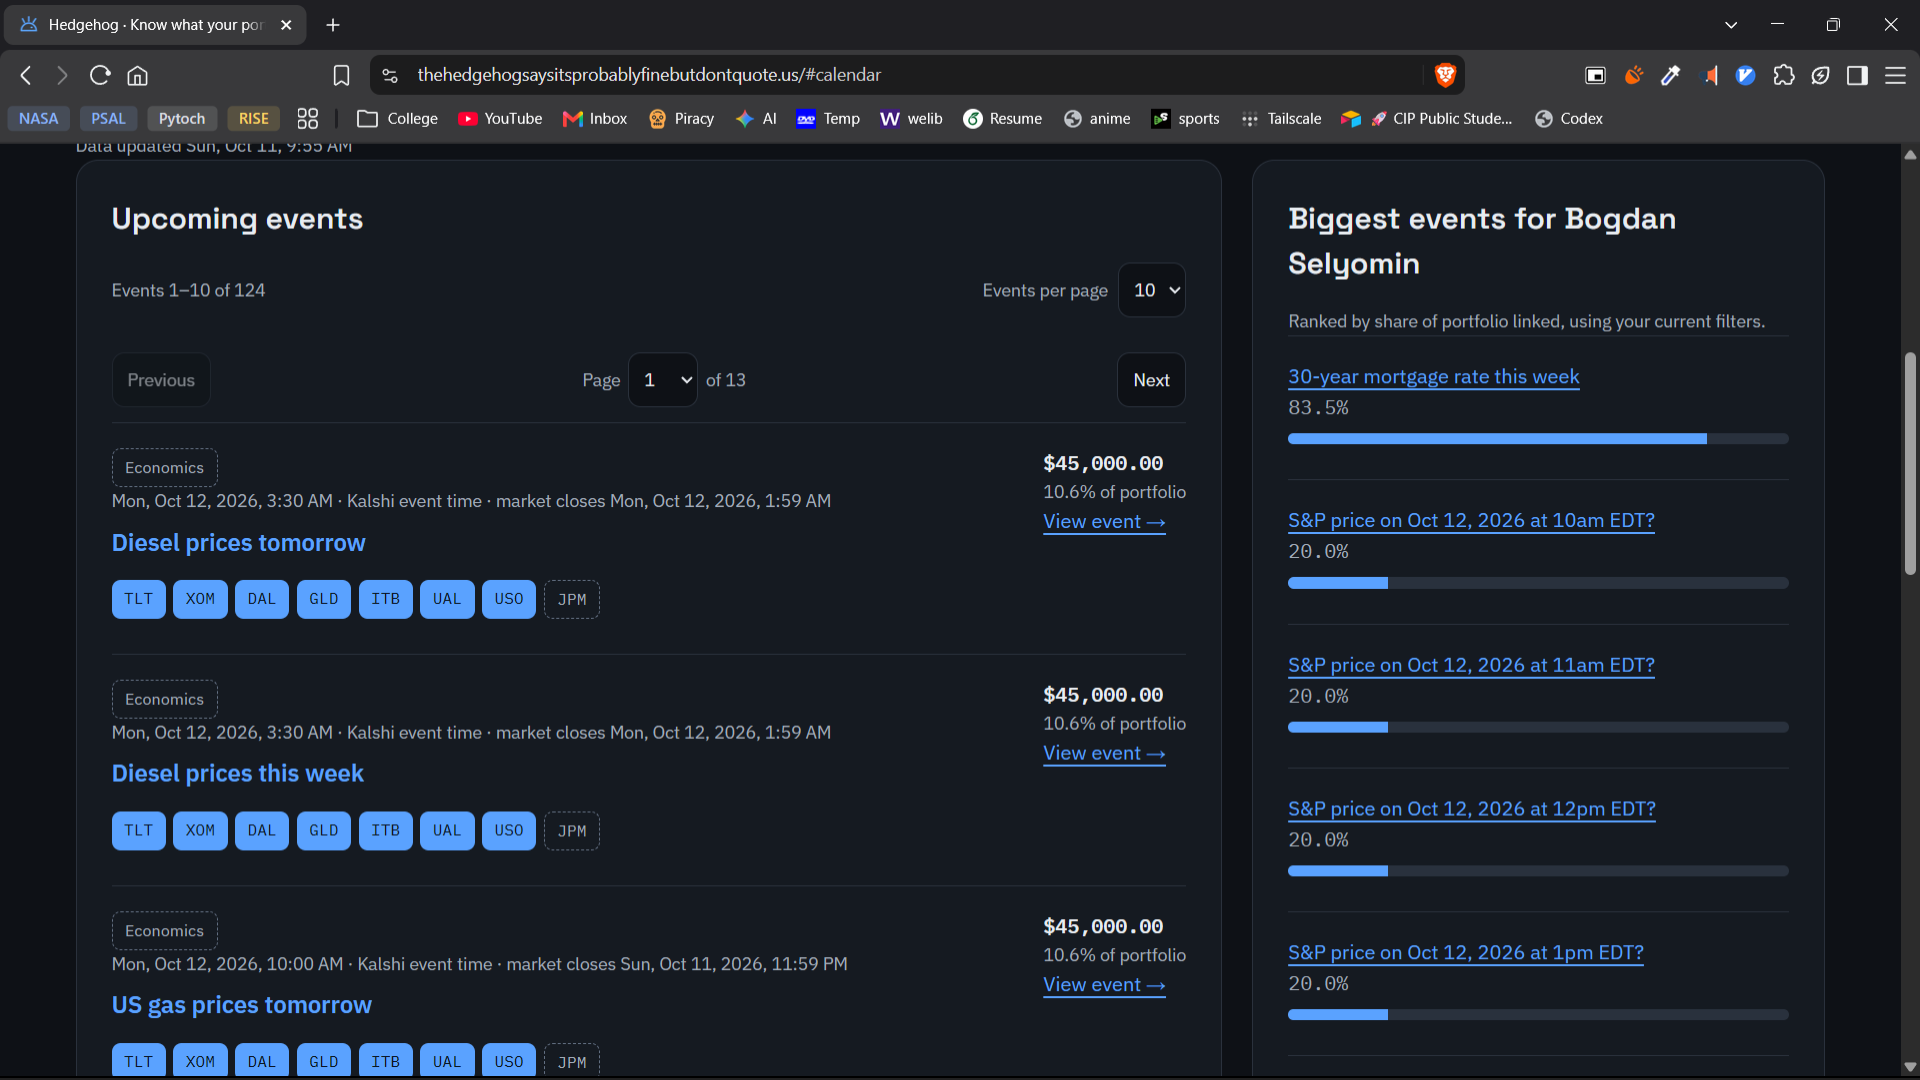
Hedgehog turns a difficult financial research problem into an unusually cohesive experience: it connects a user's investments to real-world events on Kalshi, then traces the evidence, historical relationships, and possible implications for their portfolio. Rather than presenting another dashboard of disconnected prices and headlines, we built a research experience where every interesting market development can lead to a relevant holding, a time-stamped observation, and an explanation the user can inspect.
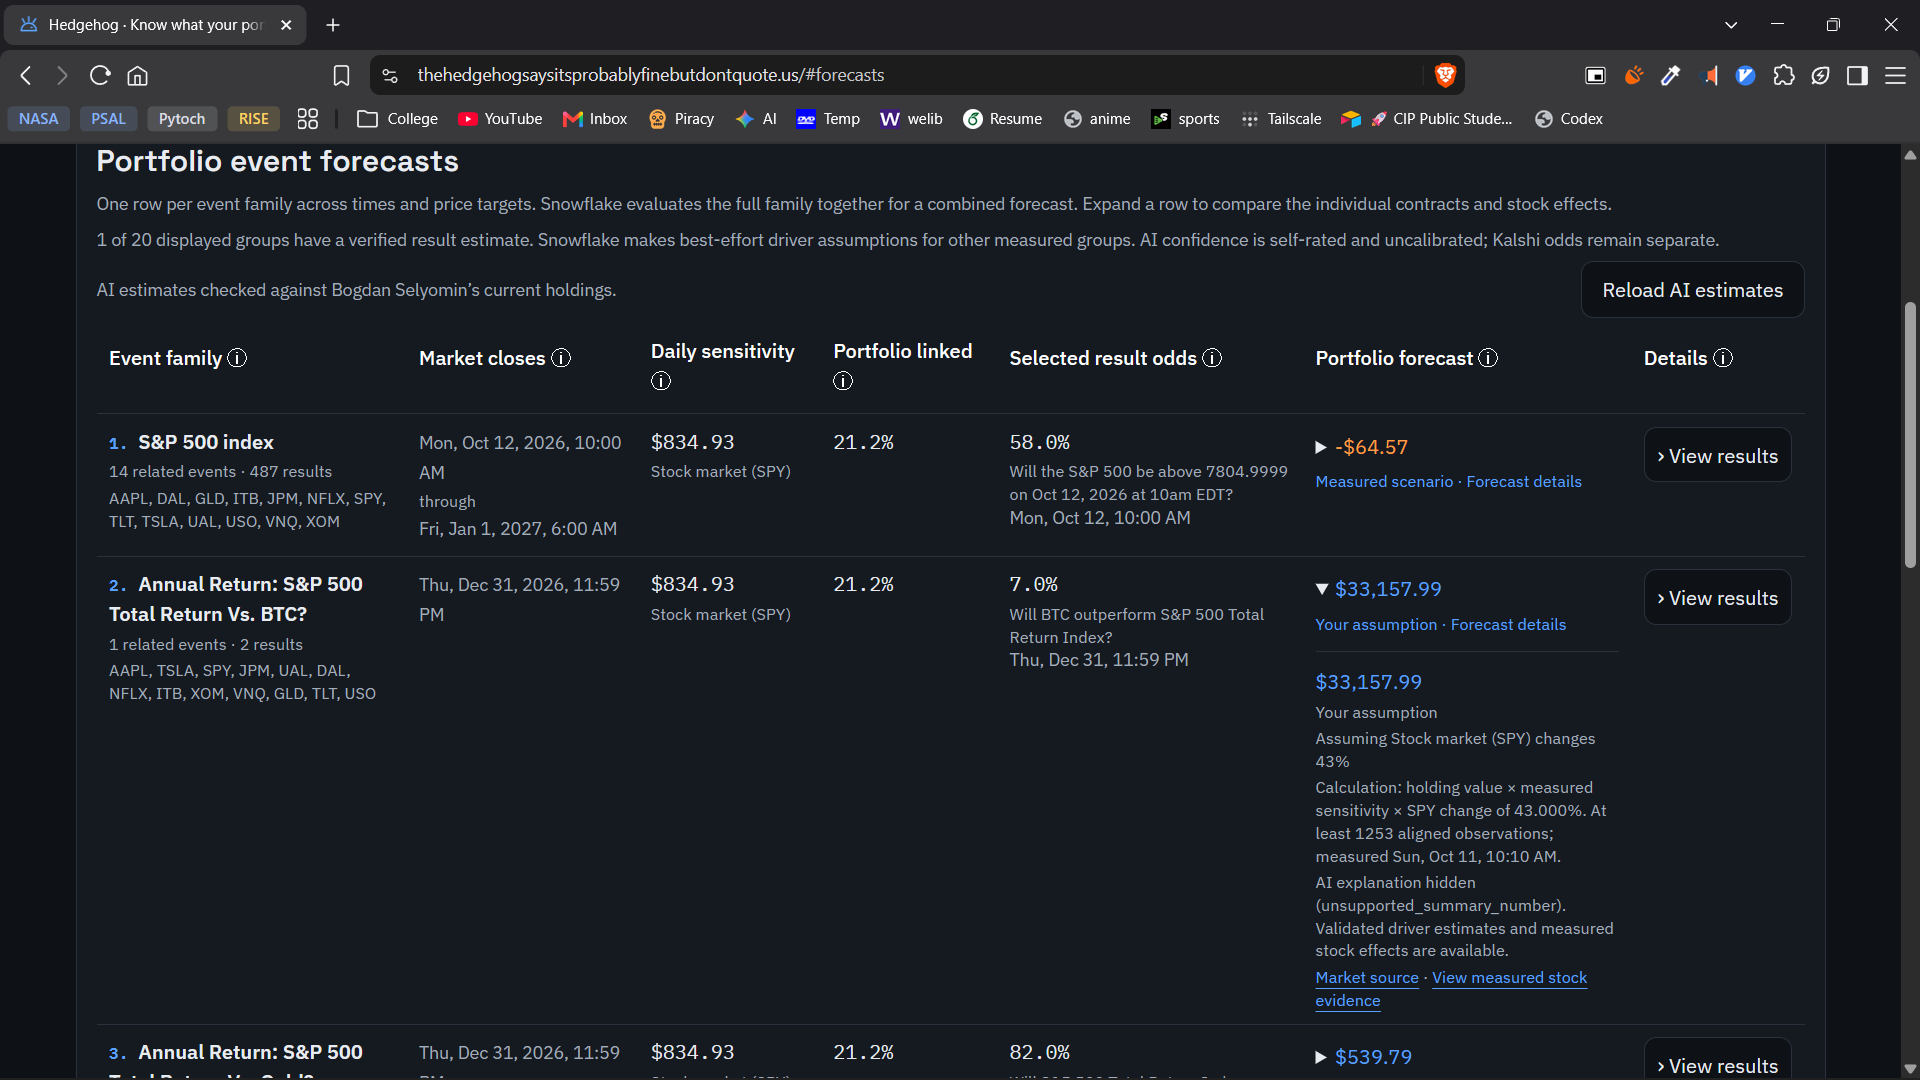
Users can explore event exposure, follow the Event Calendar, prepare with Earnings Previews, investigate changes through Portfolio Move Analysis, review Historical Prediction Track Records, test assumptions using AI Scenario Exploration, and listen to Personalized Audio Briefings.
How we used the services
Tiger Data — The foundation that makes the entire product work: We designed a unified financial evidence layer using PostgreSQL, TimescaleDB, and hypertables to connect holdings, market events, probability histories, security prices, mappings, and measured sensitivities. The result is not simply a place to store data: it is the common infrastructure behind exposure analysis, historical accountability, reusable computations, and the AI experience. When our initial ingestion pattern became unsustainable, we redesigned collection and retention around what users actually needed, cutting snapshot writes by approximately 94% in the next poll. We also use persistent results and database-backed coordination to avoid duplicated generation across Snowflake and ElevenLabs.
Snowflake Cortex — The intelligence and evidence layer: We built a workflow around Cortex Search that brings dated, attributable reporting into portfolio questions instead of asking an AI model to improvise financial facts. Snowflake Cortex also helps organize event markets into structured categories, while our parallel DeepSeek V3 and Claude Sonnet analysis pipeline compares competing scenario interpretations. Crucially, we separate retrieved facts, model assumptions, and application-calculated effects using historical sensitivities. That combination makes AI analysis more useful, inspectable, and disciplined than a generic finance chatbot.
ElevenLabs — Financial research users can listen to: ElevenLabs turns portfolio-specific, database-validated briefings into speech. Its speech-with-timestamps API supports synchronized transcript highlighting and click-to-seek playback, while links lead listeners from narrated figures directly to the supporting screens. Daily caching reduces unnecessary regeneration.
GoDaddy and Vercel — A complete public deployment: GoDaddy provides our distinctive domain, and Vercel hosts the Hedgehog web experience. Together they let people use the application as an actual product, not just view a technical demo.
What powers the application
- Kalshi — Prediction Markets: Supplies real-world events, market-implied probabilities, and settled outcomes, forming the foundation of Hedgehog's event-driven portfolio analysis.
- Yahoo Finance — Financial Market Data: Provides stock prices, historical market data, and security profiles used to evaluate holdings and market movements.
- FRED — Economic Data: Supplies interest rates, Treasury yields, and macroeconomic indicators to contextualize economic events.
- SEC EDGAR — Corporate Filings: Provides earnings-related filing dates and corporate disclosures for earnings preparation and event research.
- Federal Reserve and EIA — Authoritative Reporting: Supply official economic and energy-market information for reliable, source-backed explanations.
Together, these integrations power Hedgehog's core features: Portfolio Exposure Map, Event Calendar, Outcome Charts, Earnings Previews, Portfolio Move Analysis, Historical Prediction Track Records, AI Scenario Exploration, and Personalized Audio Briefings.
Hedgehog connects financial data, prediction markets, and AI-powered analysis into one unified experience, giving investors actionable context, verifiable evidence, transparent assumptions, and a clearer understanding of how real-world events relate to their portfolios.
Inspiration
Financial information is everywhere, but understanding what it means for your own portfolio is much harder. Prediction markets show changing expectations about inflation, interest rates, and company developments. Brokerage accounts show what you own. We wanted to connect those perspectives.
Index funds and ETFs made this problem especially interesting. A single holding can represent exposure to many companies, while seemingly different investments can share the same economic drivers. A list of tickers does not make those overlapping relationships obvious.
We built Hedgehog to help people understand which events touch their holdings, how expectations are changing, and how much evidence supports each connection. We wanted users to move from a headline to a relevant event, then to their portfolio, and finally to the evidence behind the analysis.
What it does
Hedgehog connects a user’s holdings to relevant Kalshi prediction markets and turns those connections into an interactive portfolio research experience.
Users can:
- Explore portfolio exposure: See which events connect to their holdings, how much of their portfolio those connections reach, and what supports each relationship.
- Follow upcoming events: Browse a searchable, filterable calendar and narrow the application by asset class or event theme.
- Inspect market outcomes: Compare probability histories, examine market activity and spreads, and explore the components behind a market’s trust score.
- Prepare for earnings: Explore supported company reporting markets, earnings-call topics, and historical stock movements around earnings-related filings.
- Understand portfolio changes: Compare holding movements with the broader market and measured financial drivers, alongside events from the same period.
- Examine track records: Compare earlier probabilities with settled outcomes across different timeframes.
- Ask questions and explore scenarios: Retrieve source-backed context and examine potential portfolio changes under explicitly labeled assumptions.
- Listen to a morning briefing: Hear relevant developments through ElevenLabs, follow a synchronized transcript, and open the screens supporting its figures.
Hedgehog distinguishes the share of a portfolio connected to an event from the amount that might be gained or lost. It also separates historical relationships from evidence of causation. The application supports research and understanding; it never places trades.
How we built it
We built Hedgehog with a Next.js frontend, a Node.js and Express backend, and TypeScript throughout, including shared API types. Background jobs collect observations, update market information, and calculate historical relationships. Docker gave us a reproducible local development environment.
Our sponsor integrations serve connected purposes: Tiger Data organizes the financial evidence, Snowflake supports contextual analysis, ElevenLabs delivers personalized audio, and GoDaddy gives the project its public address.
Bringing the financial data together
Understanding portfolio exposure requires several kinds of information, so we combined multiple sources.
| Source | How Hedgehog uses it |
|---|---|
| Kalshi public REST API | Events, outcome markets, bid–ask quotes, historical candlesticks, and settlement results. |
| Yahoo Finance API | Historical stock, ETF, and commodity prices, plus security profiles for classifying holdings. This is an unofficial library. |
| FRED API | Two-year and ten-year Treasury yields and mortgage rates used as financial drivers. |
| SEC EDGAR APIs | Company identifiers and earnings-related 8-K filing dates for historical comparisons. |
| Federal Reserve and EIA feeds | Dated primary-source excerpts for our reporting index. Our collector also supports BLS releases when available. |
| Optional SnapTrade integration | Read-only brokerage imports for bringing holdings into the application. |
Our backend aligns historical observations and estimates sensitivities using regression. We distinguish direct company connections, statistically supported and materially significant relationships, shared topics, and calculations based on a holding’s own terms.
Those distinctions remain visible in the interface so users can understand the evidence behind each connection.
Tiger Data: the financial evidence engine behind Hedgehog
A prediction-market application has an unusually demanding data problem: every portfolio contains holdings, every holding may relate to multiple events, every event can have multiple outcomes, and the probability and price history of those outcomes evolves over time. We needed a system that could handle those relationships without sacrificing the time dimension that makes financial analysis meaningful. Tiger Data offered an especially compelling fit because it combines the expressive relational model of PostgreSQL with the purpose-built time-series capabilities of TimescaleDB. Instead of stitching together separate stores for portfolios, relationships, and observations, we could build one coherent data foundation. Hypertables organize time-stamped data into time-based chunks while preserving familiar relational querying. Tiger Data hypertables documentation
That architectural choice shaped Hedgehog. We connect holdings, event metadata, quote observations, security prices, reviewed mappings, measured sensitivities, and settlement outcomes through shared records. A user can move from a portfolio holding to a relevant market, examine its probability history, and understand which observed data support a connection. The system also avoids copying the same public market history separately for each user: when portfolios overlap, they can reuse the same security and event evidence. This gives a hackathon prototype the foundation of a much more thoughtful data architecture.
The most valuable part is that Tiger Data lets us preserve provenance. A measured sensitivity can be traced back to the corresponding historical observations; a prediction track record can be evaluated using odds observed before the result was known. That is a substantial distinction in an application about probabilities. Historical data are not useful merely because they are available; they become useful when their timestamps, relationships, and eligibility rules are preserved.
Building quickly with Tiger CLI
Tiger CLI made the database a productive part of our development workflow rather than a separate operational obstacle. We could manage our cloud database connection and inspect service details from the terminal, while versioned SQL migrations kept rapid schema changes reproducible. As our product evolved from basic holdings to event mappings, time-series measurements, traceable historical comparisons, and reusable AI outputs, this workflow helped us iterate without losing the structure of the system.
A coordination layer for AI and audio
One of the more interesting architectural decisions was to use Tiger Data for more than financial storage. Our Snowflake analysis and ElevenLabs audio generation can involve costly external calls. We persist completed results and use database locks to coordinate generation across backend instances, so simultaneous requests can reuse work instead of needlessly making the same paid requests. A separate database connection pool isolates longer-running generation tasks from ordinary portfolio reads. This gives our AI features a deliberate lifecycle: compute when necessary, store the result, and serve it efficiently when it is still valid.
Turning a serious ingestion bottleneck into a measurable improvement
Our initial collector revealed just how quickly prediction-market data can grow. We were recording roughly 141,000 snapshots every five minutes. In approximately 17 hours, that produced around 9.9 million rows, and the database reached approximately 2,965 MB before entering read-only mode. It was an important engineering lesson: collecting everything at maximum resolution is not the same as building a useful historical dataset.
We responded by redesigning ingestion around analytical value. We still retain broad event metadata for discovery, but collect high-frequency observations selectively for series with approved portfolio mappings. We keep five-minute snapshots for eight days, configure compression after one day, use hourly candles for recent history and daily candles for longer periods, and preserve compact readings for track-record evaluation without repeatedly storing full histories.
After cleanup, the database measured approximately 282 MB, and the next polling cycle inserted 7,906 snapshots instead of roughly 141,000—approximately 94% fewer snapshot writes. That is a reduction in write volume through selective collection and cleanup, not a claim about a compression ratio. It is one of our clearest examples of improving the system through better engineering instead of asking for more infrastructure.
At five-minute granularity, one continuously monitored market generates 288 observations per day. As coverage expands, selecting the right resolution and retention window becomes a product-design decision. Tiger Data gave us the tools and database model to make those decisions explicitly while keeping the information that matters for users.
Why this foundation matters beyond the hackathon
The same architecture gives us a credible direction for more ambitious features. TimescaleDB continuous aggregates could speed up frequently requested historical summaries, while compressed or tiered storage could support longer horizons at appropriate resolution. Continuous aggregates, data lifecycle management
We also plan live portfolio updates and event notifications triggered by changes in incoming data. Shared computation, quote-quality checks, and notification cooldowns would help ensure these updates remain useful rather than noisy. In other words, Tiger Data is not just the backend of our current demo: it is the natural foundation for the increasingly event-driven product we want Hedgehog to become.
Snowflake Cortex: bringing evidence and intelligence into portfolio research
Most AI finance demos begin with a question and return a confident paragraph. We wanted a substantially more rigorous experience: one where a user could ask about an event, see where the answer came from, understand which parts were observed facts, and explore assumptions without mistaking a scenario for a forecast. Snowflake Cortex made that ambition practical within a hackathon. It provides the retrieval and AI capabilities we use to bridge the messy language of real-world events with structured portfolio analysis.
Our application supplies event descriptions, outcome probabilities, holdings, and historically measured sensitivities as context. Rather than leaving portfolio mathematics entirely to language models, application code computes conditional effects from measured sensitivities. This division of responsibilities is central to our design: models help reason about what a scenario means, while the application performs the corresponding calculations and labels the assumptions on which they depend.
Parallel model analysis with DeepSeek V3 and Claude Sonnet
We built an experimental analysis pipeline pairing a fine-tuned DeepSeek V3 model with a context-augmented Claude Sonnet model. The two models examine potential future portfolio changes in parallel, allowing us to compare their assumptions and flag potentially inconsistent interpretations before an assessment reaches the user.
We fine-tuned DeepSeek V3 on a limited hackathon-scale dataset and augmented Claude Sonnet with relevant financial context. This was an ambitious way to explore whether a specialized model and a context-rich model could complement one another. The result is not a proven prediction advantage—formal evaluation remains future work—but it adds an explicit cross-check rather than treating one model's response as unquestionable authority. AI Scenario Exploration uses these interpretations while keeping them separate from observed market facts and computed numerical effects.
Cortex Search makes the evidence inspectable
One of the strongest pieces of this integration is Cortex Search. Its managed hybrid keyword and vector retrieval enabled us to build a source-backed reporting workflow without first engineering our own retrieval infrastructure. Cortex Search documentation
Our initial working index contained 21 dated excerpts from the Federal Reserve and EIA. Each retains a title, URL, publication date, and text. When a question calls for outside reporting, Hedgehog retrieves relevant excerpts and supplies them as context. Our answer checks require citations to point to retrieved material, and numerical factual claims must be supported by the provided data or actually cited passages. When evidence is insufficient, the application withholds an unsupported answer.
That may sound like a small constraint, but it is a major product decision. In financial research, a convincing unsupported answer can be worse than a transparent limitation. By using Cortex Search to connect questions with attributable sources, we designed the assistant around evidence rather than fluency alone.
From unstructured events to useful portfolio categories
Snowflake Cortex also helps classify market descriptions into a fixed set of event tags. Financial events rarely arrive in perfectly organized schemas, but useful portfolio navigation depends on consistent categories. We batch classification requests and apply structured validation and review before using suggested mappings. This helps turn an unruly collection of markets into a more coherent Event Calendar and Portfolio Exposure Map, while leaving room to inspect how each relationship was established.
For simpler queries—such as a market's quoted odds or a holding's linked events—we can answer directly from Tiger Data through database-backed templates. More complex contextual questions use retrieved evidence and model assistance. We believe choosing the appropriate path for each question is a stronger engineering pattern than passing every request through an expensive model.
Treating cost management as part of AI engineering
We paid close attention to operating costs rather than treating model calls as free. We batch classification requests, limit concurrency and response lengths, cache completed analysis in Tiger Data, and use timeouts and limits to avoid endless retries. We configured an X-Small Snowflake warehouse with 60-second idle suspension and manage Cortex Search serving suspension separately, because search infrastructure has indexing, storage, embedding, and serving costs that are distinct from ordinary warehouse activity. Cortex Search cost documentation
This creates an appealing division of labor: Snowflake Cortex retrieves and structures the context for useful financial reasoning, while Tiger Data preserves the time-series evidence and cached outputs that make the system economical to operate. These integrations are not isolated sponsor demonstrations; they actively reinforce one another inside the user experience.
Where we would take it next
With additional time and capacity, we would expand and document our training data, keep evaluation periods strictly separate, and compare DeepSeek V3, Claude Sonnet, and their combined pipeline on held-out outcomes. We would also grow the reporting corpus, automate incremental ingestion, evaluate retrieval and citation quality, and test how reliably the system declines unsupported questions. Shared work queues and per-account budgets would help keep a larger deployment sustainable.
For us, the exciting part of Snowflake Cortex is not simply that it lets us integrate AI. It lets us build an AI experience with structure: evidence can be retrieved, assumptions can be challenged, calculations can be inspected, and uncertainty can stay visible to the investor.
ElevenLabs: making portfolio analysis accessible through voice
ElevenLabs powers Hedgehog’s personalized morning briefing. A dashboard can contain many events, figures, and charts; the briefing gives users a concise way to hear relevant developments before deciding where to explore further.
We use the official JavaScript SDK and the eleven_multilingual_v2 model. Our backend builds a script from database-backed templates describing the completed-session portfolio move, its estimated broad-market component, an important upcoming event, and a significant change in event odds.
The script passes numerical checks before synthesis. Only the briefing text is sent to ElevenLabs, and the user’s name is excluded.
Connecting spoken information to evidence
ElevenLabs’ speech-with-timestamps API returns character-level timing information alongside the recording. We convert those timings into sentence boundaries so the transcript can highlight the sentence being spoken and let users click a sentence to jump to that point. Speech-with-timestamps documentation
Sentences containing figures also link to the relevant event or Moves screen. A listener can hear a development, open its supporting view, and inspect the underlying information.
We validate that the timings match the script. If they do not, the transcript remains available without synchronized highlighting.
This made ElevenLabs useful beyond narration: the timing output helped us build an accessible interface that connects audio back to the application’s evidence.
Working within generation limits
Speech generation consumes credits, with usage depending on the model and plan. Regenerating the same recording whenever someone opens the dashboard would waste that allowance. ElevenLabs credit documentation
We cache a daily recording for an unchanged portfolio and voice configuration, using the New York day as its date boundary. Repeated playback reuses that recording. Signed-in portfolios can receive morning generation, while guest portfolios generate a briefing on request.
Tiger Data persists the recording and its metadata and coordinates concurrent requests, helping prevent duplicate generation.
What we would build with more capacity
We would add multilingual briefings, validated pronunciation handling, and spoken follow-up questions that use the same financial facts and checked reporting as the application.
We also want voice-driven navigation, such as “Show my energy holdings” or “Open that event.” ElevenLabs client tools can connect an agent to application navigation and interface actions. ElevenLabs client tools
Optional spoken updates could accompany meaningful portfolio developments, with user-selected thresholds and cooldowns to limit noise and generation costs.
GoDaddy: giving Hedgehog a recognizable address
We used GoDaddy to register thehedgehogsaysitsprobablyfinebutdontquote.us and connected it to our Vercel-hosted web deployment.
The domain gives Hedgehog a memorable identity while playfully reflecting a central idea behind the project: financial predictions come with uncertainty.
Challenges we ran into
Connecting events to holdings without overstating their importance.
A shared topic does not establish a measurable financial effect. Broad funds and overlapping drivers made this particularly challenging: counting every connection equally could make an event appear much more consequential than the evidence supported.
Keeping historical data sustainable.
Our initial collection strategy exceeded our database storage allowance. Solving this required changes to ingestion, retention, historical resolution, and database enforcement—not simply increasing capacity.
Reconciling financial timestamps.
An event’s administrative market close can differ from the date of the underlying event. Earnings filing dates do not always establish whether a report occurred before or after trading hours. Sparse historical quotes introduced further complexity. We had to preserve these distinctions instead of filling gaps with assumptions.
Evaluating predictions fairly.
Track records need observations from before the outcome became known. We implemented consistent observation windows and rules for excluding empty books, unusable readings, and post-release observations.
Developing AI features under limited time and credits.
We balanced model experimentation with source retrieval, validation, caching, and account configuration. The limited training dataset also made it important to distinguish experimental scenario estimates from established predictive performance.
Presenting dense information clearly.
Exposure maps, historical charts, trust components, and portfolio categories can overwhelm a screen. We iterated on compact rows, expandable details, search, filters, pagination, and shared category selections so users could explore progressively.
Accomplishments that we're proud of
We are proud of building a connected experience that carries users from a portfolio-level question down to the observations and sources behind an answer.
Our strongest measurable engineering accomplishment was recovering from a near-immediate time-series storage bottleneck and turning it into a better system design. By rethinking observation eligibility and historical granularity on Tiger Data, we reduced snapshot writes by approximately 94% in the next poll while retaining broad market discovery. We are proud that this was an architectural improvement rather than a bigger-resource workaround.
We are particularly proud that the sponsor technologies form one connected system rather than four disconnected demos. Tiger Data provides the shared, time-stamped evidence foundation and controls the economics of repeated computation. Snowflake Cortex brings retrieved reporting, event classification, and structured AI reasoning into that foundation. ElevenLabs then presents a verified subset of those insights as interactive, navigable audio. A user can move from a market event to a portfolio connection, into a cited explanation, and finally into an audio briefing that links back to its evidence. That end-to-end coherence is the technical achievement we wanted judges to see.
Finally, we are proud of the decisions that make the application more honest: leaving unsupported measurements unavailable, distinguishing topic links from stronger relationships, exposing trust-score components, and labeling scenario assumptions. Those decisions are central to the product’s usefulness.
What we learned
We learned that financial data engineering is largely about preserving meaning. A probability needs a timestamp and a usable quote. A measured relationship needs aligned observations and uncertainty checks. An exposure percentage needs a clear definition of what contributes to it.
We also learned that statistical significance alone does not establish practical importance. Comparing a driver’s typical effect with a holding’s strongest driver helped us distinguish meaningful connections from faint associations.
Storage constraints taught us to design around the questions users actually ask. Recent charts benefit from detailed observations, longer views can use coarser history, and track records need carefully selected readings and outcomes.
Working with AI taught us to separate observed facts, retrieved evidence, model assumptions, and calculated results. Multiple models can offer useful cross-checks, but their agreement does not replace evaluation.
Building the voice experience also showed us that accessibility can improve transparency. A synchronized transcript with links to supporting figures makes a briefing easier to navigate and verify.
What's next for hedgehog
- Live notifications and portfolio updates: Refresh affected views when data changes and let users choose alerts for meaningful developments.
- Deeper fund analysis: Expand fund classification and explore transparent look-through analysis of underlying constituents, with careful handling of overlapping exposures.
- Broader reporting coverage: Add more company filings, earnings materials, and appropriately licensed reporting through scheduled incremental ingestion.
- Stronger model evaluation: Expand the fine-tuning dataset and compare individual models with the combined pipeline using held-out periods and outcomes.
- Longer history at sustainable cost: Introduce continuous aggregates, expand retention selectively, and apply storage lifecycle policies.
- Conversational and multilingual briefings: Support spoken follow-up questions, voice navigation, and validated briefings in additional languages.
- Production-scale controls: Add per-account generation budgets, shared job queues, and monitoring for storage growth, data freshness, and provider usage.
Built With
- docker
- docker-compose
- elevenlabs
- express.js
- fred-api
- kalshi-api
- ml-matrix
- next.js
- node.js
- postgresql
- react
- sec-edgar
- snowflake-cortex-ai
- snowflake-cortex-search
- tailwind-css
- tiger-data
- timescaledb
- typescript
- vitest
- yahoo-finance

Log in or sign up for Devpost to join the conversation.