-
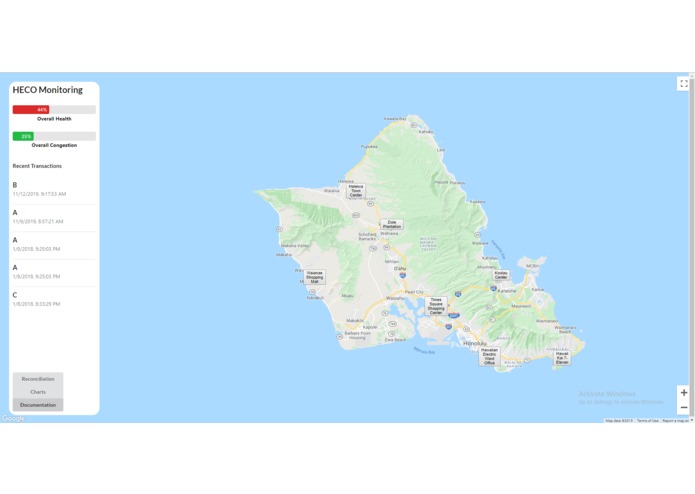
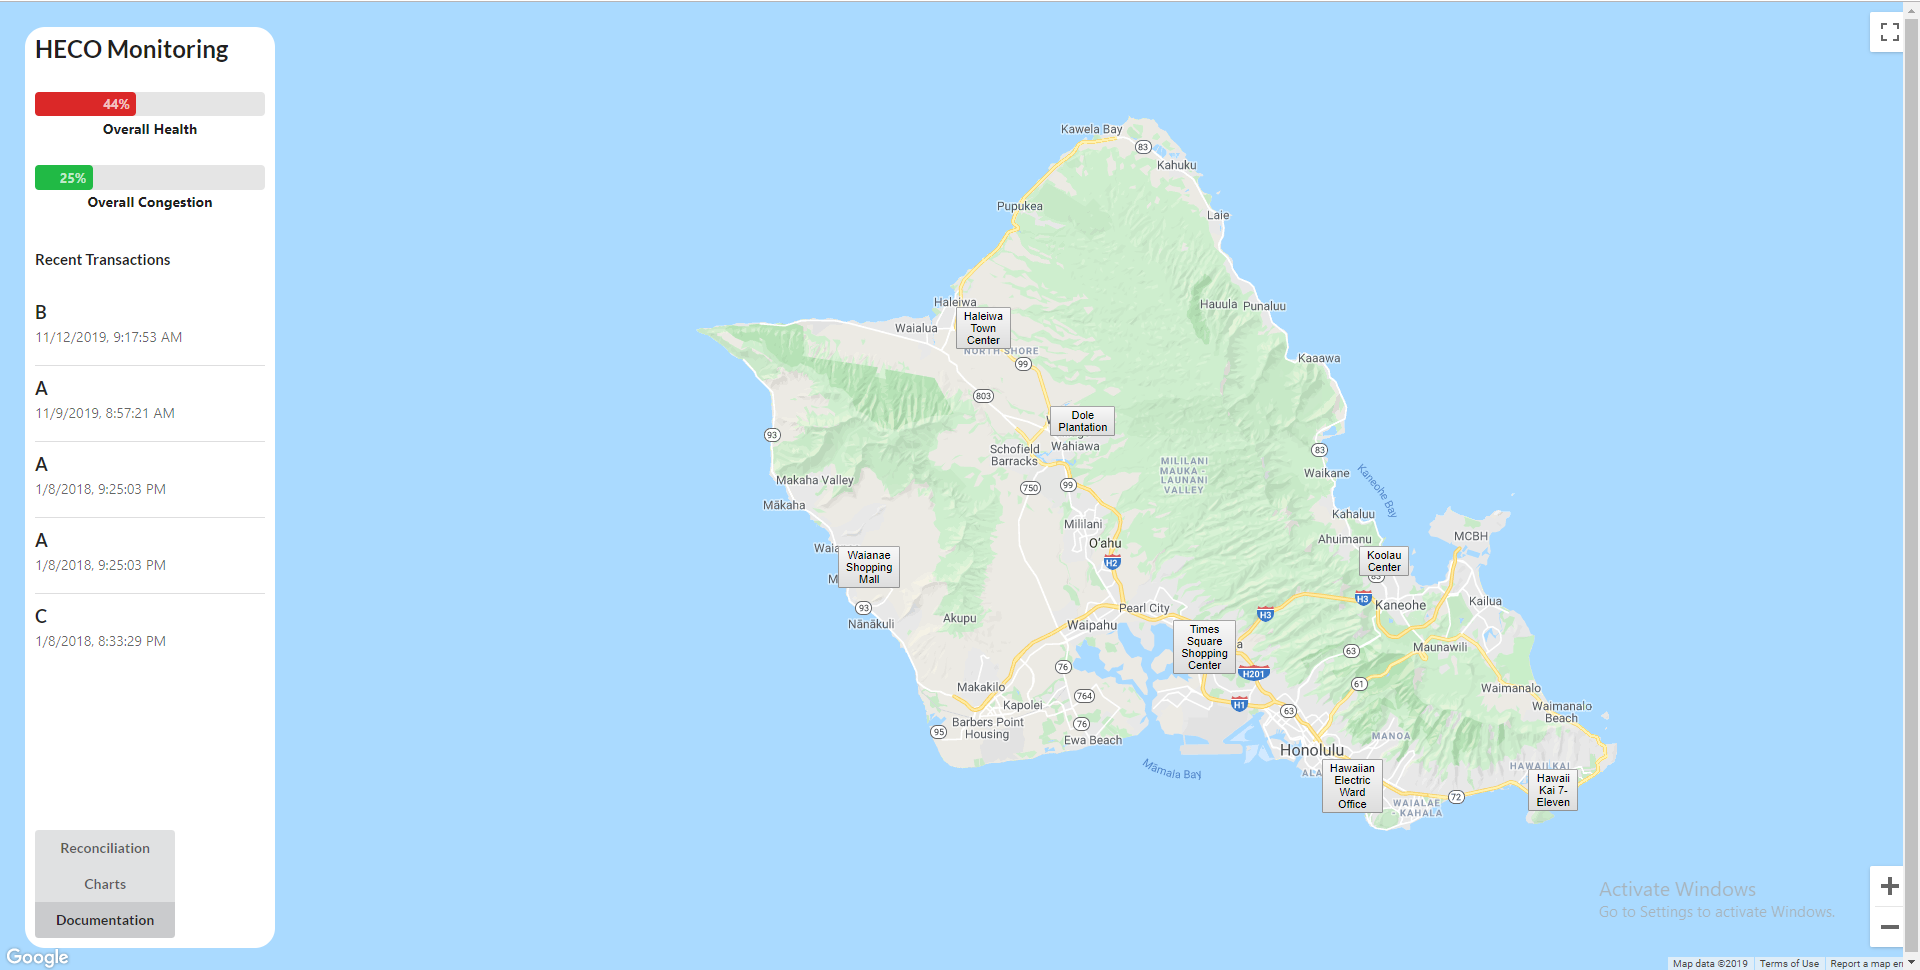
Example of the dashboard
-
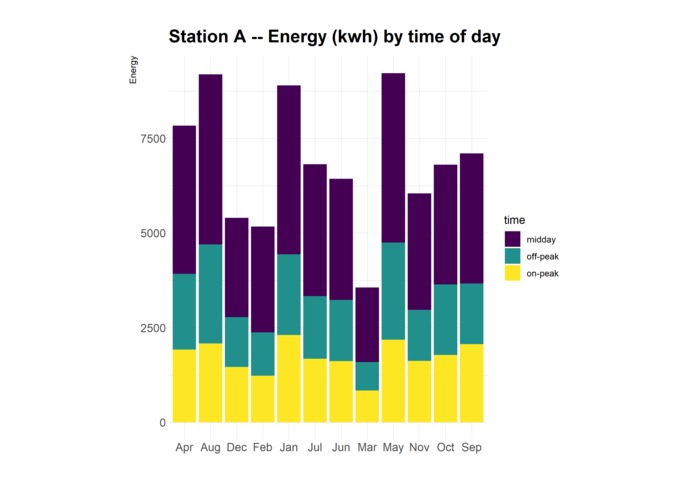
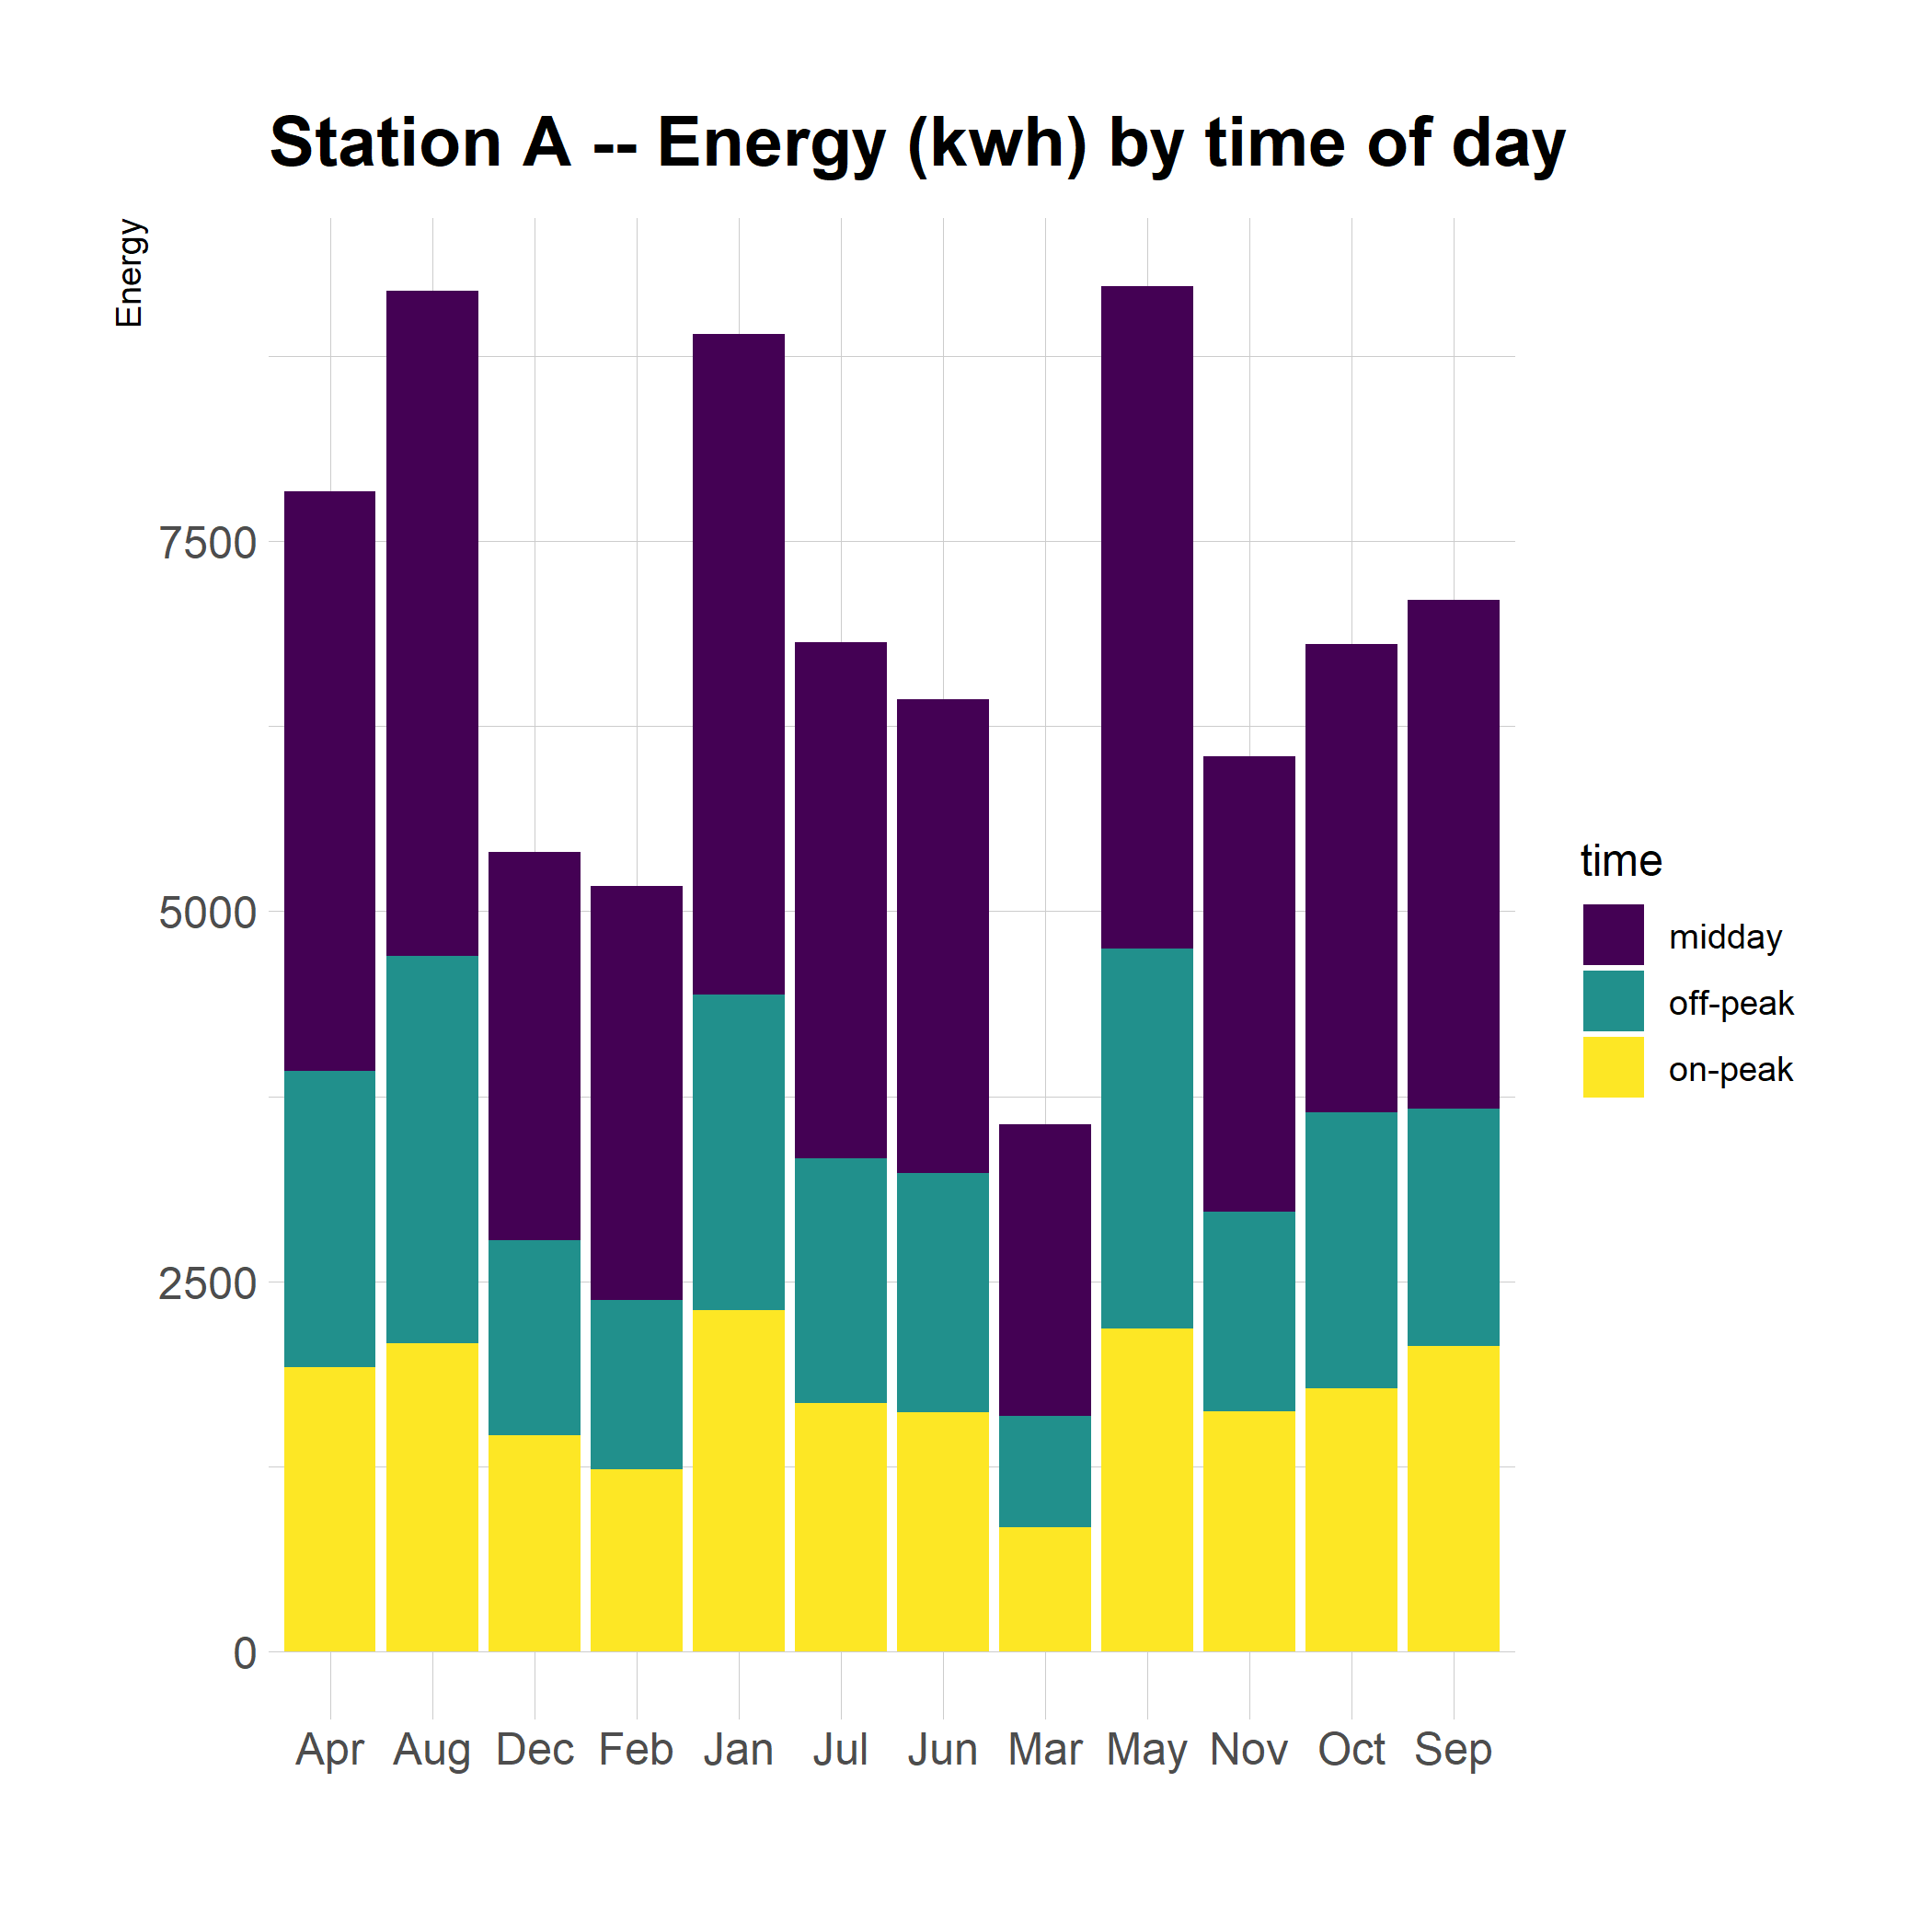
Example of our generated graphs using R
View Active Website at: http://www2.hawaii.edu/~naga/
Inspiration
The opportunity to grow and learn as developers
What it does
Our application is an interactive map with easy to use forms and interfaces to view, update, and create data for charge stations. The data is sent to an AWS lambda function which parses the data and inputs it into a postgresql database, using graphql queries, depending if the data is valid or not. In this context valid data is data we deemed to indicate a failing charge station such as empty price or charge lengths. Using these tables organized into the validity of the data we use a react frontend to display and easily update any invalid data using graphql queries. R's data processing power allowed us to parse through given data to output various statistics and plots. Algorithms in R allowed the scripts to be able to determine congestion in a station and check on the health of a station to assure that it is transferring energy at a good rate. An R script was also used to plot charging transactions such as: # of sessions, energy, gross revenue, and # of minutes, based on a user input of which station and the start/end time of what they would like to see. There were also other algorithms to find the trend in the plots and how electric vehicles affected greenhouse gas emissions and fossil fuel.
Challenges we ran into
Main issues when constructing this application that we are still sorting through is connecting the various components of our workflow from the frontend, the database, our serverless functions, and the R graph building code.
Accomplishments that we're proud of
Creating an application from the ground up, frontend to back, and integrating all those parts to create an application is something we are all very proud of accomplishing.
What we learned
We learned a lot about how servers, the amazon web services, and databases work and especially how all those tie together to create websites in the real world. We all got more familiar with languages such as R javascript and postgreSQL as we combined and interfaced these components.
What's next for HECO Charge
Up next we hope to increase security of the workflow, integrate the graph building code into our workflow more fluidly, and implement more data validation for our frontend.

Log in or sign up for Devpost to join the conversation.