The Gates Foundation surveyed 3100 teachers and asked for clusters of classrooms as well as what tools those clusters need. Our solution provides a technique that gives recommendations for educational tools for both teachers and students, and also gives insight on how to present/deliver those recommendations according to segments. The people who can benefit from this solution are the teachers and students themselves through the products we recommend, but also coordinators from the Gates Foundation who need to understand the actions and philosophies of the teachers they help; through this understanding the coordinators can know how to communicate with the teachers in order to convince them of new teaching strategies.
The survey results are stored in a 400 column spreadsheet; many variables are highly correlated with others, so it's hard to keep track of whether a variable is redundant or contributing new information. First we needed to use a dimensionality reduction algorithm, PCA in this case. We can't explode the dataset through one hot encoding, so we needed to select relevant columns by hand. Applying Principal Components reveals a scatterplot that can be thought of as a communication/targetting strategy (see images in pdf). It created two indices that describe a teacher's teaching actions and philosophies, which are more targeted attributes than the demographics of the teacher's school. Knowing what quadrant a teacher is in helps to guide the communication strategy: if the teacher indexes in the upper right no targeting is necessary. When indexing in the upper left the teacher believes digital tools are helpful but does not use any yet; the teacher has potential. If indexing in the lower left the teacher is not a believer and needs convincing first that digital tools are useful, through training or live demonstration for example. Finally indexing in the lower right the teacher needs immediate assistance, as he/she is wasting time using tools that have no value.
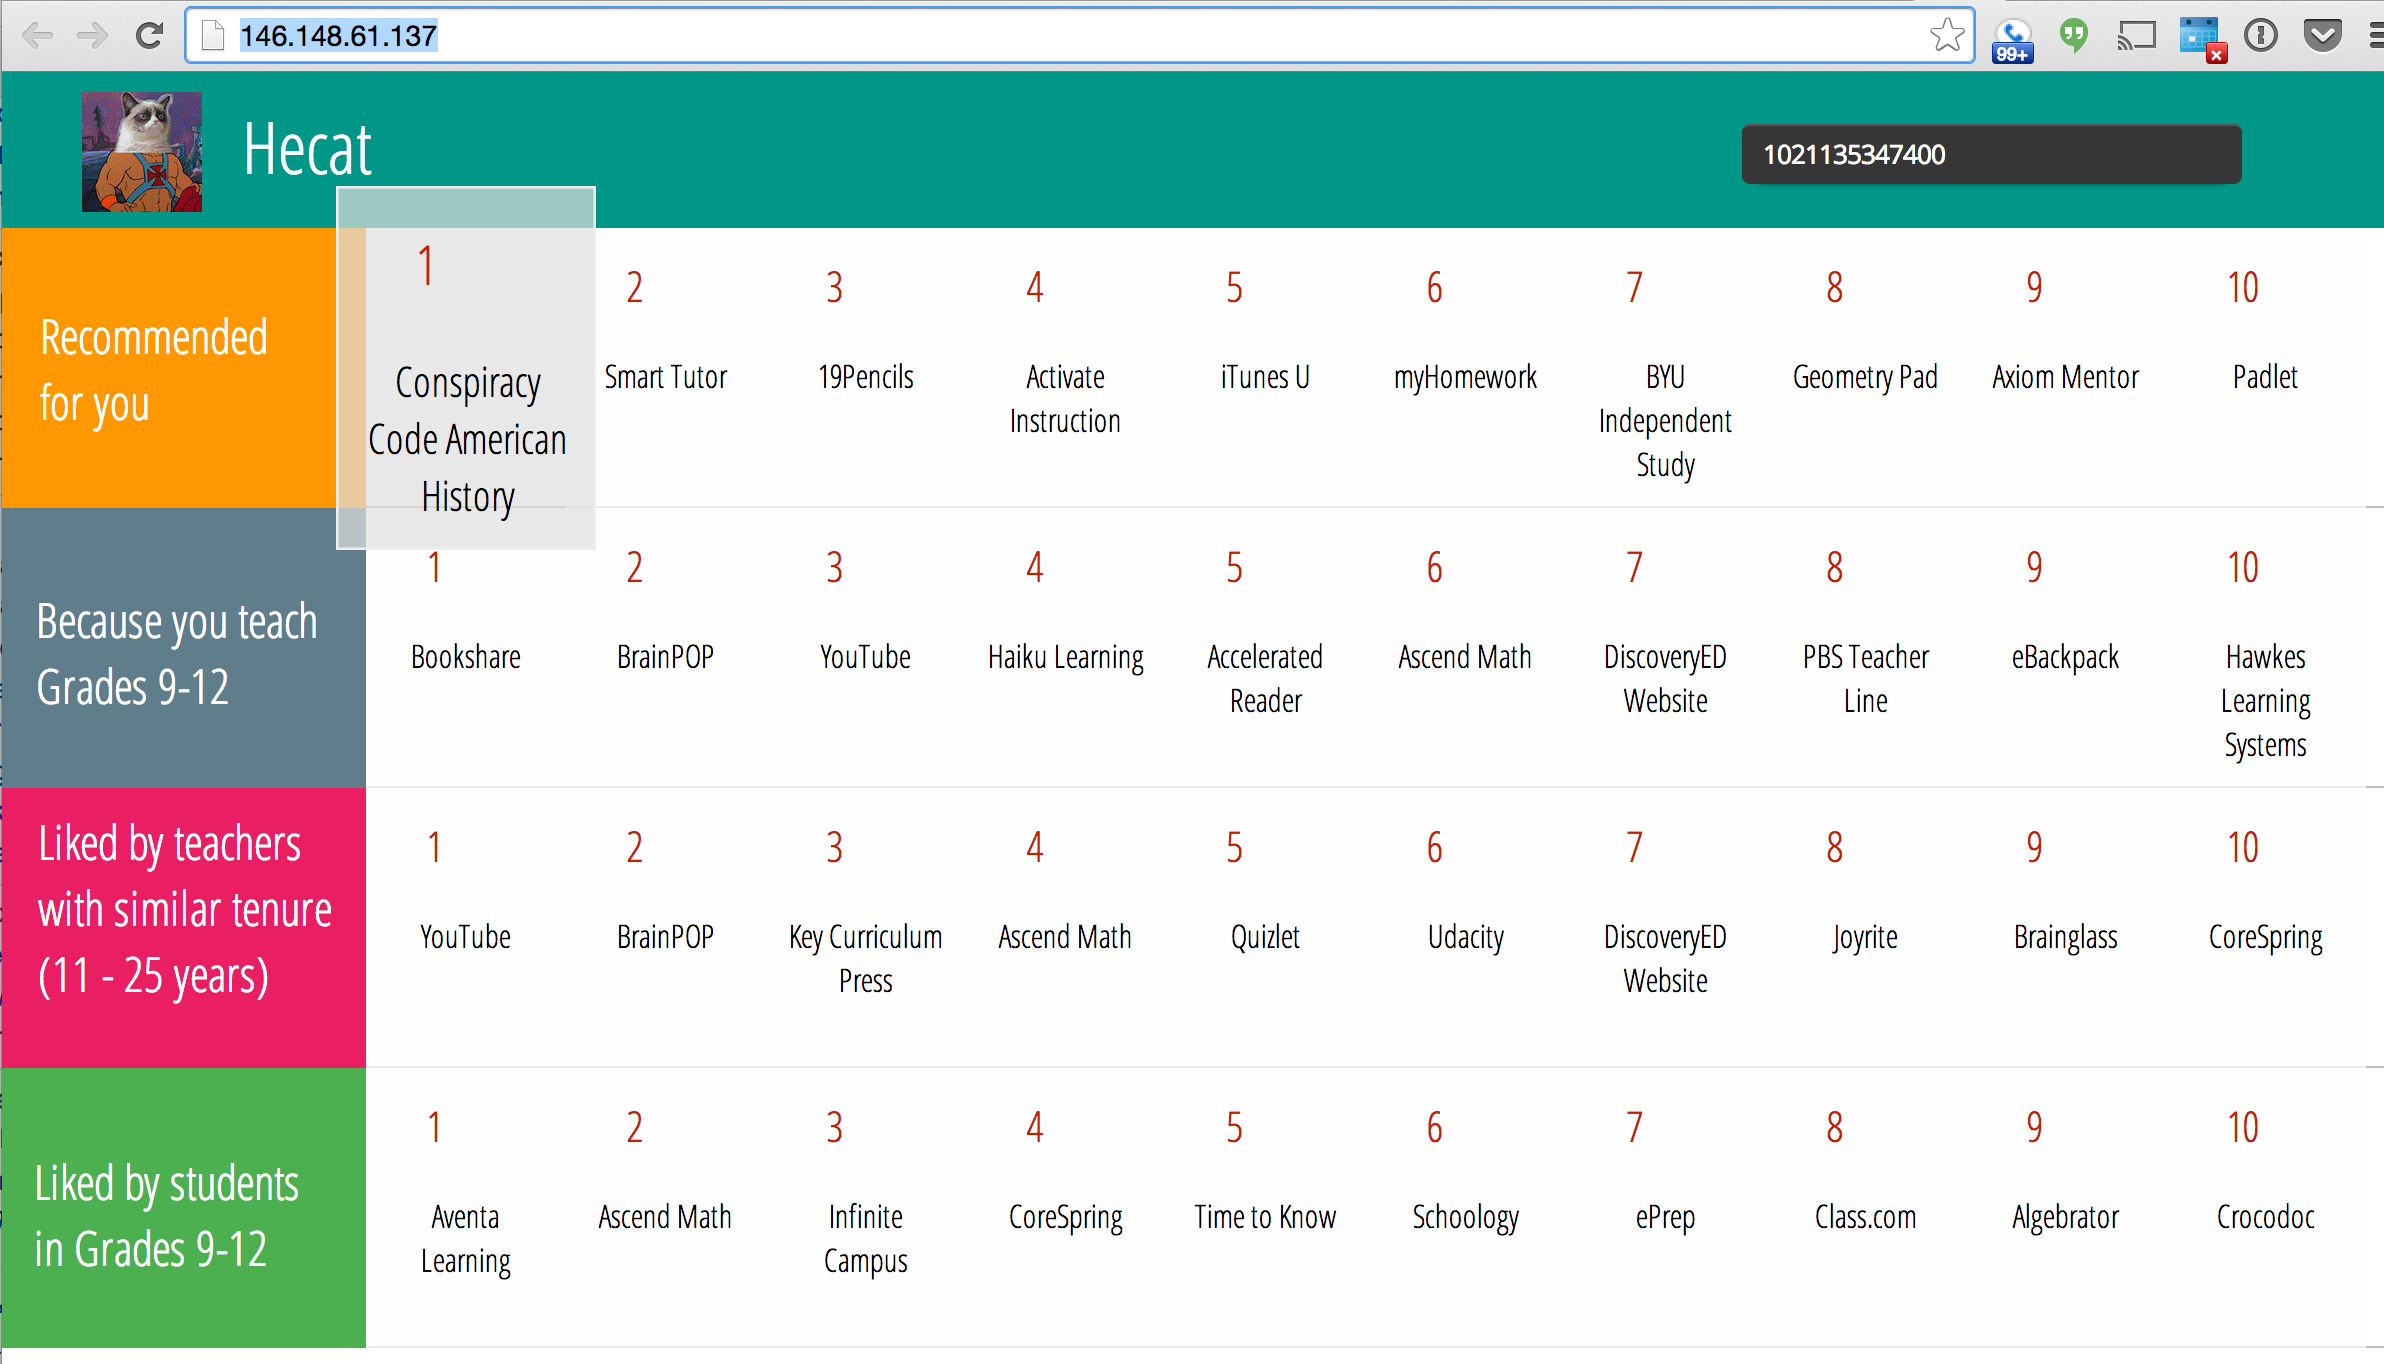
Having a system to understand the strategy is important for the executers; they still need to know how to help the classrooms. Instead of identifying needs for each cluster level, we went directly to providing individual recommendations for the teachers and students. Combining all the datasets available from the Gates Foundation, there was a hidden gem that revealed teacher preferences for characteristics of digital tools. Likewise there was a dataset showing different products and their characteristics. The characteristics are determined by voting from other people in how effective the product is for a given characteristic, so this matrix needs to be normalized for voting differences. In the end the recommendation is a cross product of the normalized teacher-preference vector and the product-characteristic vector.
If there is a way to link which students belong to which teachers, then we can take recommendations for teacher A and recommendations for students B,C,D,... and find the overlap in order to make everyone in the classroom happy.


Log in or sign up for Devpost to join the conversation.