
CHAPTER 1 : INTRODUCTION Introduction to Project and Problem Statement Groundwater quality is under increasing threat due to contamination by heavy metals such as lead (Pb), cadmium (Cd), arsenic (As), and mercury (Hg). These toxic elements bio ccumulate in living organisms and are linked to severe health issues including neurological disorders, organ damage, and cancer. Existing methods for assessing heavy-metal contamination rely on indices such as the Heavy Metal Pollution Index (HPI), Heavy Metal Evaluation Index (HEI), Contamination Degree (Cd), and Metal Index (MI). However, computing these indices manually is complex, time-consuming, and prone to errors. Each index requires multiple steps—assigning weights, calculating sub-indices, and aggregating results—while also referencing different standards (WHO, BIS, EPA). Manual workflows not only introduce inconsistencies but also fail to capture spatial variations in groundwater quality. As a result, large datasets are difficult to process efficiently, and policymakers face delays in receiving reliable reports. The Problem Statement Highlights the Urgent Need for an HMPI Application that Ensures:
- Accurate and Standardized Calculations – Automated computation of multiple indices using consistent formulas and recognized standards.
- Error-Free and Time-Efficient Analysis – Eliminating manual calculation errors and accelerating assessment.
- Integration with Spatial Mapping (GIS) – Enabling visualization of contamination hotspots and geographic trends.
- User-Friendly Access – A web-based platform for scientists, researchers, and policymakers to upload data and receive instant results.
- Timely Decision-Making Support – Providing quick, reliable insights to support public health interventions.
- Scalability and Flexibility – Handling large datasets, updating results dynamically, and switching between global standards with ease. 8 Necessity of the Platform The necessity of this platform arises due to the following reasons: The increasing presence of toxic heavy metals such as lead (Pb), cadmium (Cd), and arsenic (As) in groundwater poses a serious threat to public health. While indices like HPI, HEI, Cd, and MI exist to evaluate contamination their manual computation is tedious, time-consuming, and error-prone. Analysts often struggle with applying different formulas, standards, and weights across multiple samples, which can lead to inconsistencies and delays in reporting. An automated Heavy Metal Pollution Index (HMPI) Application is therefore necessary to:
- Ensure Accuracy and Standardization Apply consistent formulas and global standards (WHO, BIS, EPA) without human error.
- Save Time and Effort Automate index calculations, enabling instant updates when new data are added.
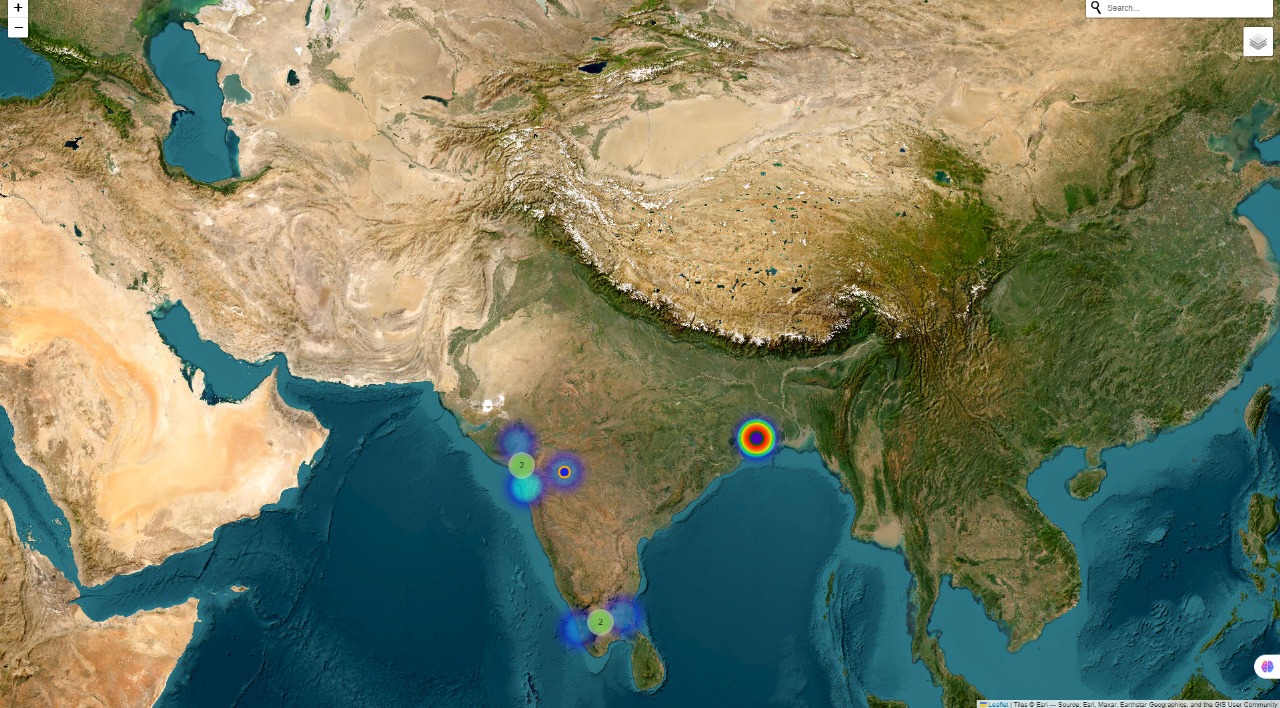
- Enable Spatial Insights Integrate Geographic Information Systems (GIS) to visualize contamination hotspots and spatial variation in water quality.
- Improve Accessibility Provide a user-friendly, web-based platform where scientists, policymakers, and local authorities can upload data and immediately receive results.
- Support Timely Decision-Making Deliver rapid, reliable outputs to guide interventions in affected areas.
- Handle Large Datasets Efficiently
Process data from dozens or hundreds of sampling wells without
performance issues.
Currently, no comprehensive public software exists that combines automated
HMPI computation with visualization. This platform fills a critical gap by
standardizing groundwater assessments, reducing human error, and accelerating
public health responses.
9
Problem Statement
Importance of the Problem
Groundwater contamination by heavy metals like lead, mercury, cadmium,
and arsenic poses serious health and environmental risks, as these toxins
can accumulate in the body even at low levels.
Accurate monitoring is essential to ensure safe drinking water, protect
ecosystems, and guide policy decisions.
Lack of Effective Solutions
Current methods for assessing heavy metal pollution are mostly manual or
semi-automated, making them slow, error-prone, and inconsistent.
The lack of integrated systems for data collection, computation, and visualization limits reliable monitoring at larger scales. Challenges for Stakeholders Researchers face delays due to manual computations, while policymakers and communities lack timely, accurate data, affecting decisions and safety measures. Financial and Trust Gap Manual assessments increase costs and require more human resources.
Errors and inconsistencies reduce trust in data, limiting timely corrective actions. Need for an Automated Solution A user-friendly, automated application is needed to compute heavy metal pollution indices accurately and map contamination using spatial data.
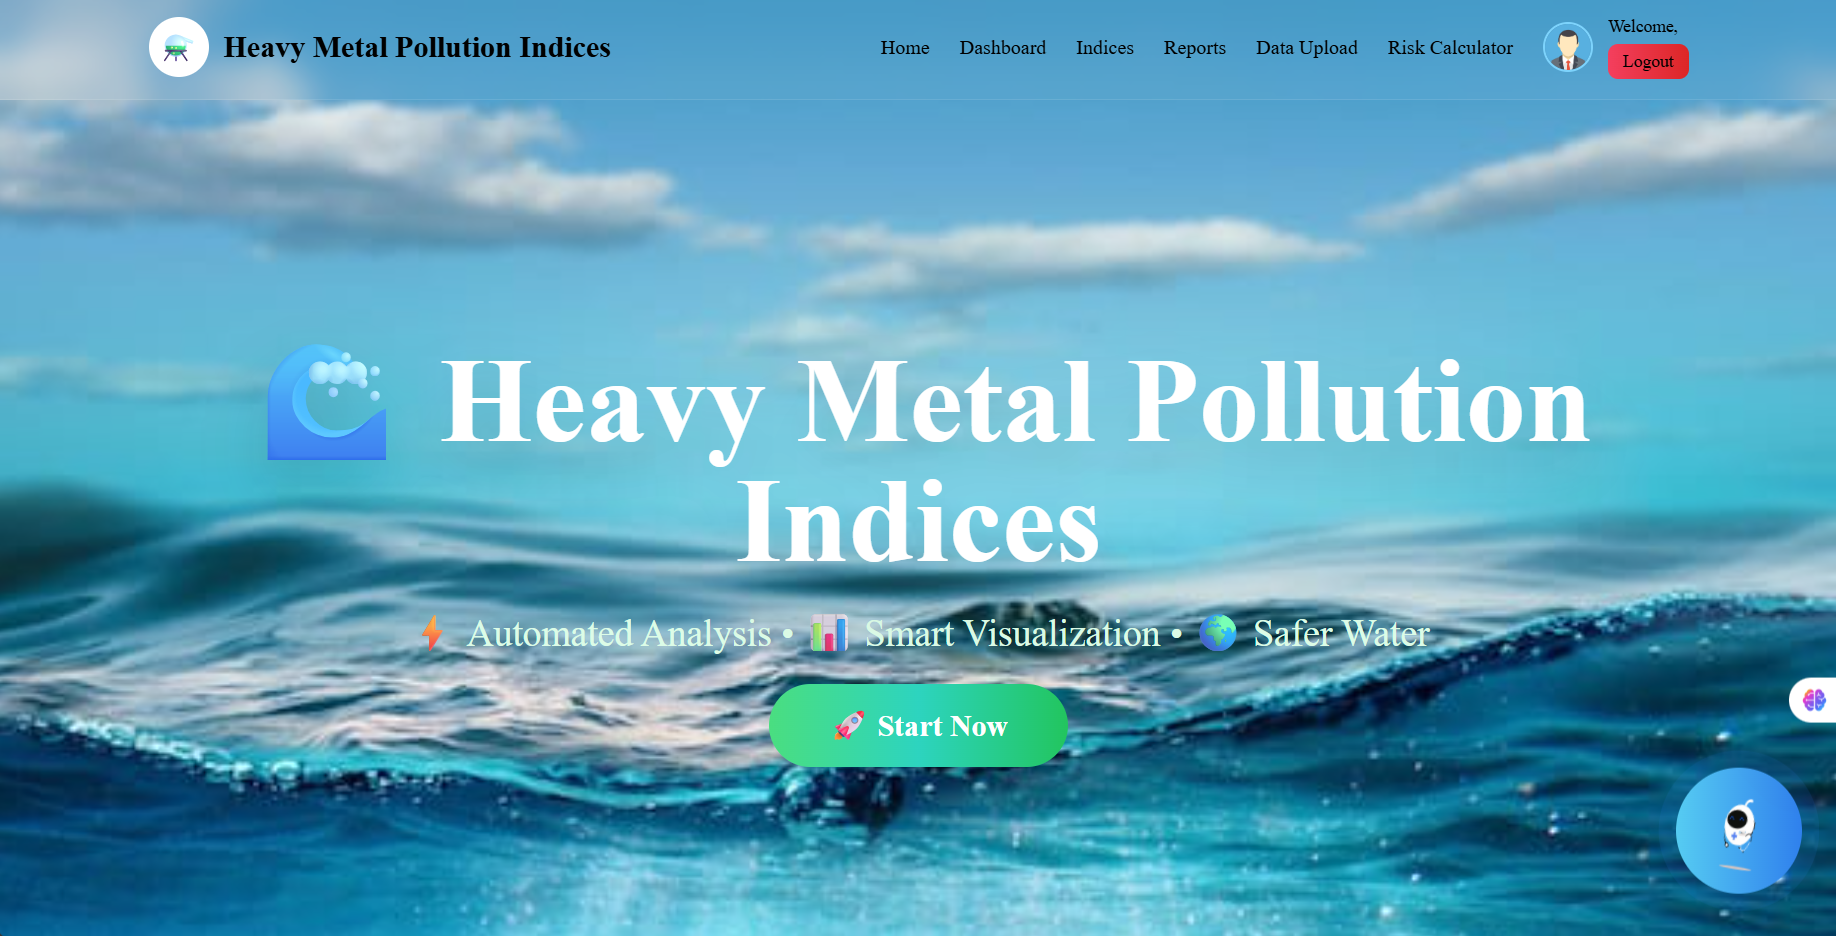
This will provide reliable insights for stakeholders and bridge the gap between scientific analysis and policy for better environmental and public health management. 10 Scope and Limitations Scope Integrated Monitoring Platform: Mobile and web app to collect, analyze, and visualize heavy metal pollution in water and soil using a composite pollution index. IoT & Sensor Integration: Use field-deployable sensors and drones for real-time data collection from remote locations. Geospatial Mapping: GIS-based maps to identify contamination hotspots, trends, and pollutant sources. User Data Submission: Interface for communities, industries, and researchers to contribute measurements, enhancing monitoring coverage. Regulatory Dashboard: Tools for environmental agencies to track compliance, validate data, and flag safety threshold exceedances. Data Analytics & Prediction: Statistical analysis and ML-based prediction of contamination trends and sources. Scalability: Easily add new pollutants, sensors, or environmental contexts (soil, sediment, air). Limitations Technical Challenges: Sensor calibration and accuracy are critical and difficult to maintain. Initial Costs: Hardware, software, and training require significant investment. Data Gaps: Limited real-time measurements and reliance on manual sampling may affect updates. User Training: Digital literacy and trust issues may hinder adoption. Regulatory Issues: Compliance with varied safety standards can be complex. Connectivity Constraints: Remote areas may lack reliable internet or power. Environmental Variability: Pollution levels fluctuate seasonally, requiring frequent measurements. 11 CHAPTER 2: LITERATURE SURVEY Review of Heavy Metal Pollution in Groundwater Common toxic metals: lead (Pb), cadmium (Cd), arsenic (As), chromium (Cr), mercury (Hg), nickel (Ni), and zinc (Zn). Reports by WHO, BIS (Bureau of Indian Standards), EPA, and CPCB highlight the health risks of heavy metal contamination in drinking water. Studies indicate widespread groundwater contamination near industrial zones, mining areas, and agricultural runoff regions. Existing Indices for Heavy Metal Pollution Heavy Metal Pollution Index (HPI), Heavy Metal Evaluation Index (HEI), Contamination Index (Cd), and Metal Index (MI) are commonly used. Problems: manual calculations are tedious, error-prone, inconsistent, and lack automation for large datasets. Applications of Digital Tools in Water Quality Monitoring GIS-based studies used to map contamination hotspots. Case studies of mobile apps for water testing, but none specifically designed for automated HMPI calculation. Benefits of digital platforms: speed, accuracy, accessibility, and visualization. Need for Automated HMPI Application Weakness of manual/centralized computation: delays, inconsistencies, dependency on expertise. Integration of databases, GIS, and automated formulas is needed to improve reliability. Automated tools can empower researchers, policymakers, and local authorities for timely decisions. 12 Technological Components of HMPI Application Backend calculation engine (for HPI, HEI, Cd, MI). Data integration layer (groundwater datasets, lab results, geo coordinates). Visualization tools (GIS maps, dashboards). User interface (web/mobile platform for data input and instant results). Challenges in Implementation Data availability and accuracy (depends on reliable lab testing and sampling). Technical complexity in integrating multiple indices and GIS visualization. Adoption barriers among local authorities and field workers. Infrastructure limitations in rural/remote areas (internet, devices). Regulatory challenges in standardizing pollution index reporting across India. 13 CHAPTER 3: SYSTEM DEVELOPMENT Proposed System The proposed system is an automated HMPI application that calculates indices like HPI, HEI, Cd, and MI using standard formulas from WHO, BIS, and EPA. It integrates heavy metal concentration data with geo-coordinates, ensuring accurate, consistent, and real-time results. A user-friendly interface and GIS based visualization help map contamination hotspots, enabling quick decision making and reducing errors from manual computation. The System provides: - Automated Calculations: Computes Heavy Metal Pollution Indices (HPI, HEI, Cd, MI) automatically from groundwater sample data using standard WHO, BIS, and EPA formulas.
- Geo-Referenced Analysis: Maps heavy metal concentration with geo coordinates for precise spatial visualization of contamination hotspots.
- Groundwater Quality Categorization: Classifies water quality based on index values, enabling quick identification of safe and polluted zones.
- User-Friendly Interface: Simplified dashboards and input forms for scientists, researchers, and policymakers without requiring technical expertise.
- Error Reduction: Minimizes manual computation errors, ensuring consistent and reliable results.
- Real-Time Reporting: Generates instant reports and visualizations for informed decision-making and policy formulation.
- Data Integration: Supports importing datasets from labs, field studies, or monitoring agencies for centralized analysis. This automated HMPI application not only simplifies the complex process of heavy metal pollution assessment but also empowers stakeholders with actionable insights. By providing accurate, real-time, and geo-referenced data, it facilitates proactive monitoring and management of groundwater quality, ultimately contributing to better environmental stewardship and public health protection. 14 System Architecture The application is built on a multi-layered architecture, which includes the following key components:
- User Interface Layer: Web Portal & Mobile App: Provides user access for data upload, analysis, and visualization. Dashboard: A centralized interface that displays key metrics and analysis results.
- Data Collection Layer: File Uploads: Accepts data in formats like PDF, Excel, and CSV. IoT Integration: Connects with sensors for real-time data collection. Mobile-based Reporting: Enables field personnel to manually input data.
- Application Layer: Data Processing Engine: Uses Python, pandas, and openpyxl to clean and process data. Calculation Engine: Automatically computes indices such as HPI, HEI, Cd, and HI using standard formulas. API Gateway: Manages communication between the user interface and the backend services.
- Database Layer: Secure Storage: database like MongoDB for flexible and secure data storage.
- Analytics & Visualization Layer: Statistical Analysis: Performs advanced analysis like Principal Component Analysis and Cluster Analysis. GIS Visualization: Employs Folium to create interactive maps that visualize contamination hotspots. Report Generation: Uses ReportLab to create professional reports for easy sharing and documentation. This architecture ensures the system is not only a powerful calculation tool but also a comprehensive platform for data management, analysis, and visualization, facilitating informed decision-making. 15 Algorithms and Workflow Workflow
- Start & Data Upload o The process begins when a user uploads a data file in PDF, Excel, or CSV format. o The system supports multiple data sources, including manual uploads and future IoT sensor integration.
- Analysis & Checking Upon receiving the data, the system performs an initial integrity and consistency check, which includes: o Parsing the data file using libraries like openpyxl and pandas. o Validating data formats and ensuring all necessary fields (e.g., heavy metal concentrations, geo-coordinates) are present.
- Heavy Metal Content Assessment The core of the system is the analysis of heavy metal content, divided into two main branches: o Health Risk Assessment: Calculates indices that assess potential health risks posed by the heavy metals. o Multivariate Statistical Analysis: Uses statistical methods to identify patterns and relationships within the data. Algorithms & Computations Health Risk Assessment The system calculates several standard indices based on formulas from WHO, BIS, and EPA.
- Heavy Metal Pollution Index (HPI) o wi: unit weightage for the i-th heavy metal o Hi: sub-index of the i-th heavy metal o Interpretation: Safe: HPI < 100 Critical: HPI > 100 16
- Heavy Metal Evaluation Index (HEI) o Hc: measured concentration o Hmac: maximum allowable concentration o Interpretation: Low: HEI < 400 Medium: 400–800 High: HEI > 800
- Contamination Degree (Cd) o Cf,i: contamination factor of the i-th heavy metal o Interpretation: Low: Cd < 40 Medium: 40–80 High: Cd > 80
- Health Risk Indices (HI)
HI=∑HQ
o Calculates health risk for Infants, Children, and Adults. o Computes both Carcinogenic and Non-Carcinogenic risks for granular assessment. Multivariate Statistical Analysis Correlation Analysis: Identifies relationships between heavy metals to see which metals occur together. Principal Component Analysis (PCA): Reduces dataset dimensionality, identifying the most significant factors contributing to pollution. Cluster Analysis: Groups locations with similar heavy metal profiles to identify regions with common contamination sources. Visualization & Output Graph Generation: Plots indices (HPI, HEI, Cd) to show trends and distributions. Map Visualization: Uses Folium to display contamination data on a geographical map, highlighting hotspots. 17 The entire process is designed to be automated and seamless, from initial data upload to final visualization, ensuring accurate, consistent, and real-time results. This makes environmental monitoring more efficient and effective. Fig :3.1 Flowchart Fig:3.2 Workflow Diagram 18 Module Description User Module o This module provides a user friendly interface for researchers, scientists, NGOs, and policymakers. o It allows users to upload groundwater data in multiple formats such as PDF, Excel, or CSV for further analysis. Verification Module o This module ensures data integrity, consistency, and quality. o It performs validation checks for missing values, incorrect formats, and outliers, and cross verifies inputs with standard ranges defined by WHO, BIS, and EPA guidelines. Marketplace Module o This module provides a platform for trading verified water quality credits or sustainability tokens. o It encourages industries and organizations to offset their environmental impact and promotes sustainable practices by linking verified data with green initiatives. Data Analysis and Visualization Module o This module performs automated calculations of indices such as HPI, HEI, Cd, and HI. It also conducts multivariate statistical analysis including correlation, PCA, and clustering.
o The results are presented through graphs, dashboards, and contamination hotspot maps using visualization tools such as Matplotlib and Folium. Alert and Recommendation Module o This module triggers real time alerts whenever heavy metal concentration exceeds safe limits.
o It sends notifications or reports to users via the dashboard, email, or SMS.
Predictive Analytics and Forecasting Module o This module uses machine learning algorithms to estimate future contamination trends.
o It also integrates environmental and industrial activity data such as rainfall patterns, mining, and agricultural runoff to improve forecasting accuracy. 19 Tools and Technologies Used - Programming Languages Python: Core language for index computation and statistical analysis. HTML/CSS/JavaScript: For web interface development.
- Data Handling & Processing
Pandas: Data manipulation and cleaning. NumPy: Numerical computations. Openpyxl: Parsing Excel files. - Data Analysis & Algorithms Scikit-learn: Multivariate statistical analysis (PCA, clustering, correlation). SciPy/Statsmodels: Statistical tests and validation.
- Visualization & Mapping Matplotlib & Seaborn: Graph generation and trend visualization. Folium: Interactive geographical maps for contamination hotspots.
- Backend & Database MySQL: For secure storage of metadata, user profiles, and results.
- Deployment & Hosting Flask/Django: Backend framework for web application. GitHub/Git: Version control and collaboration.
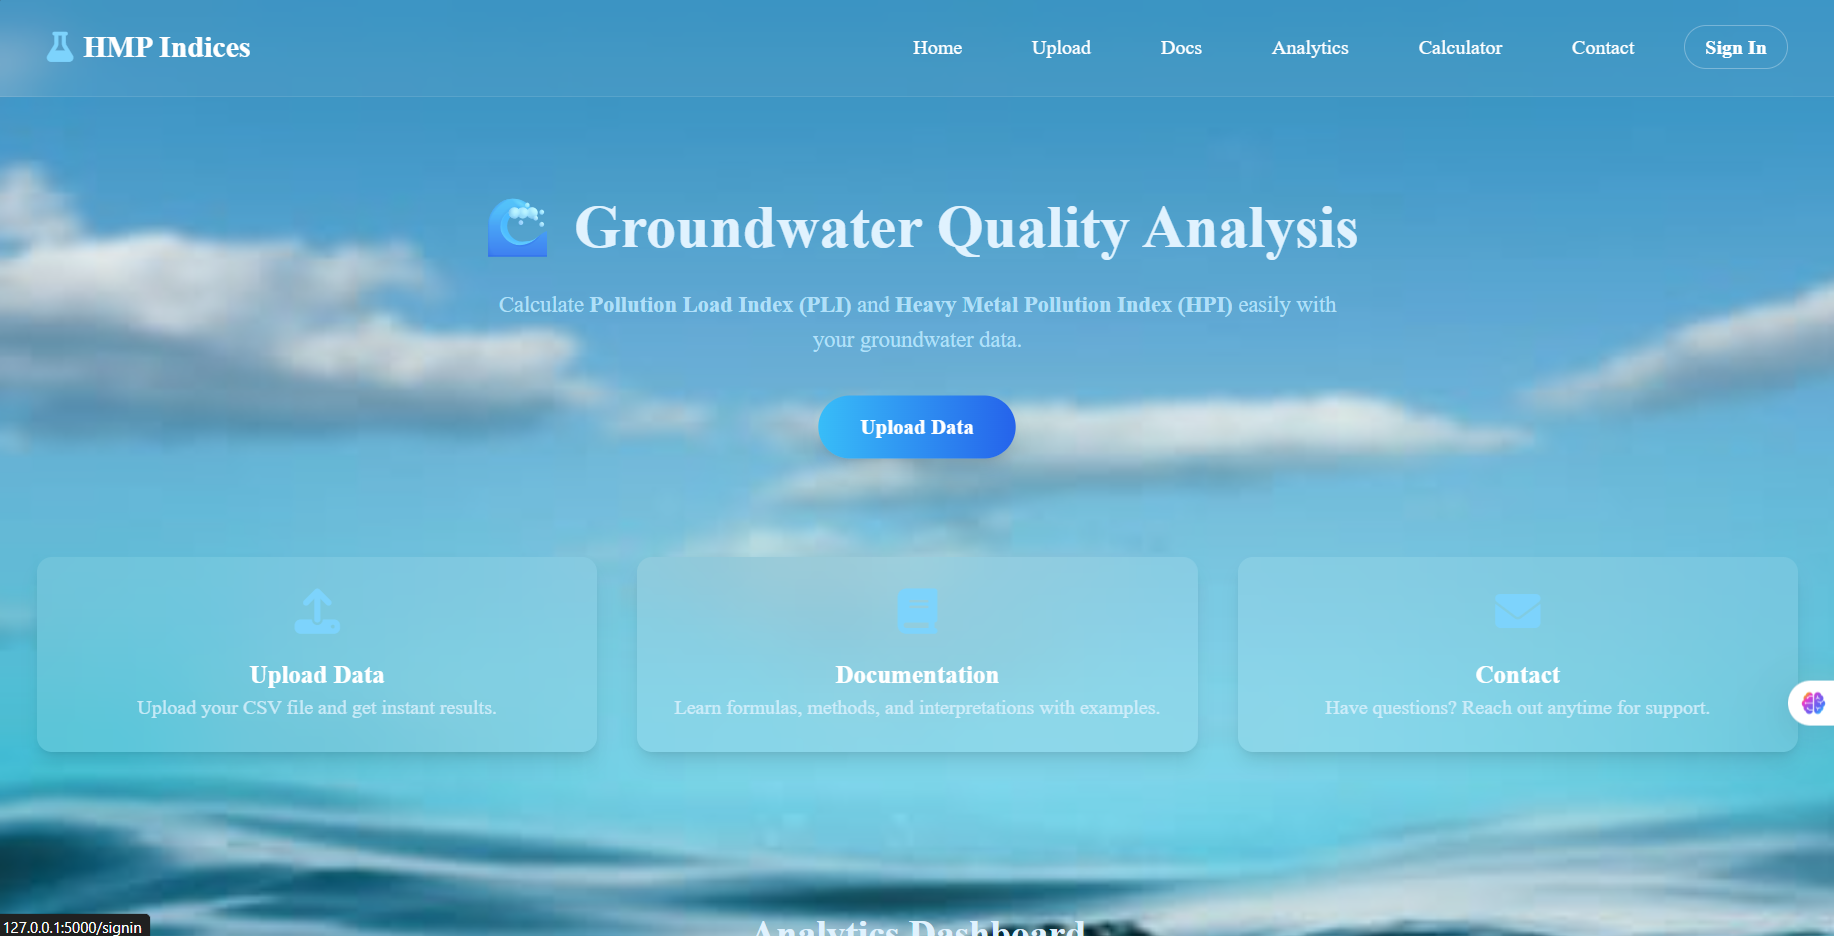
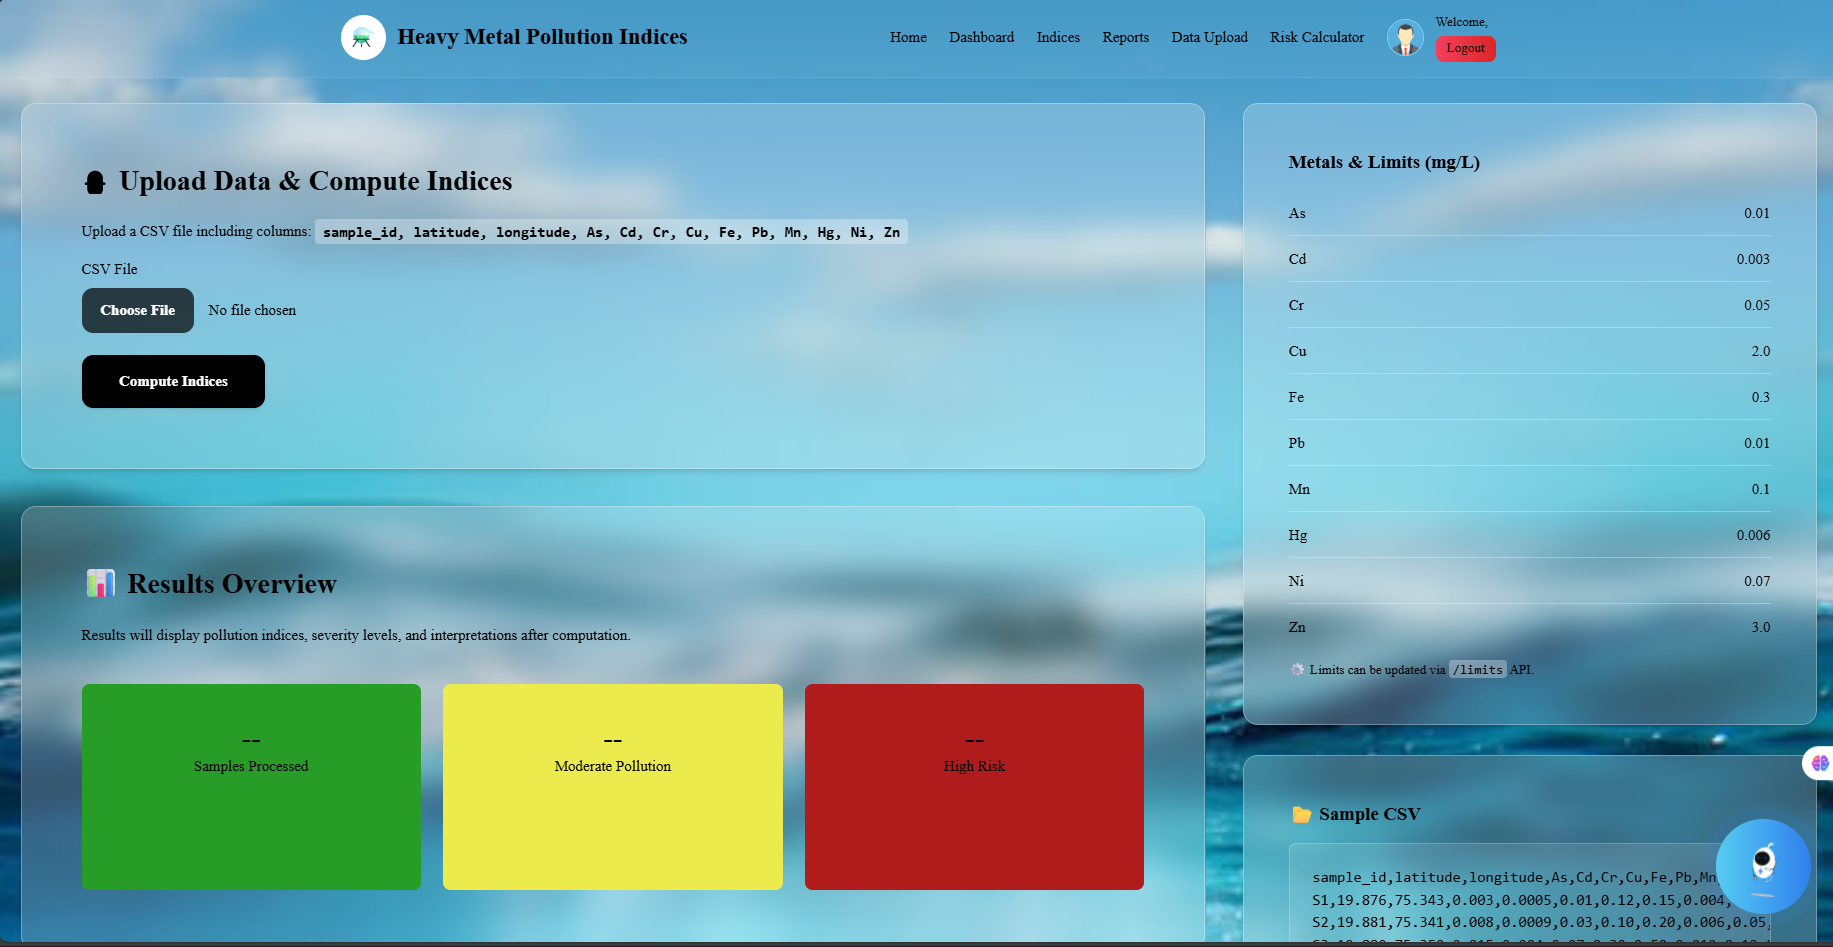
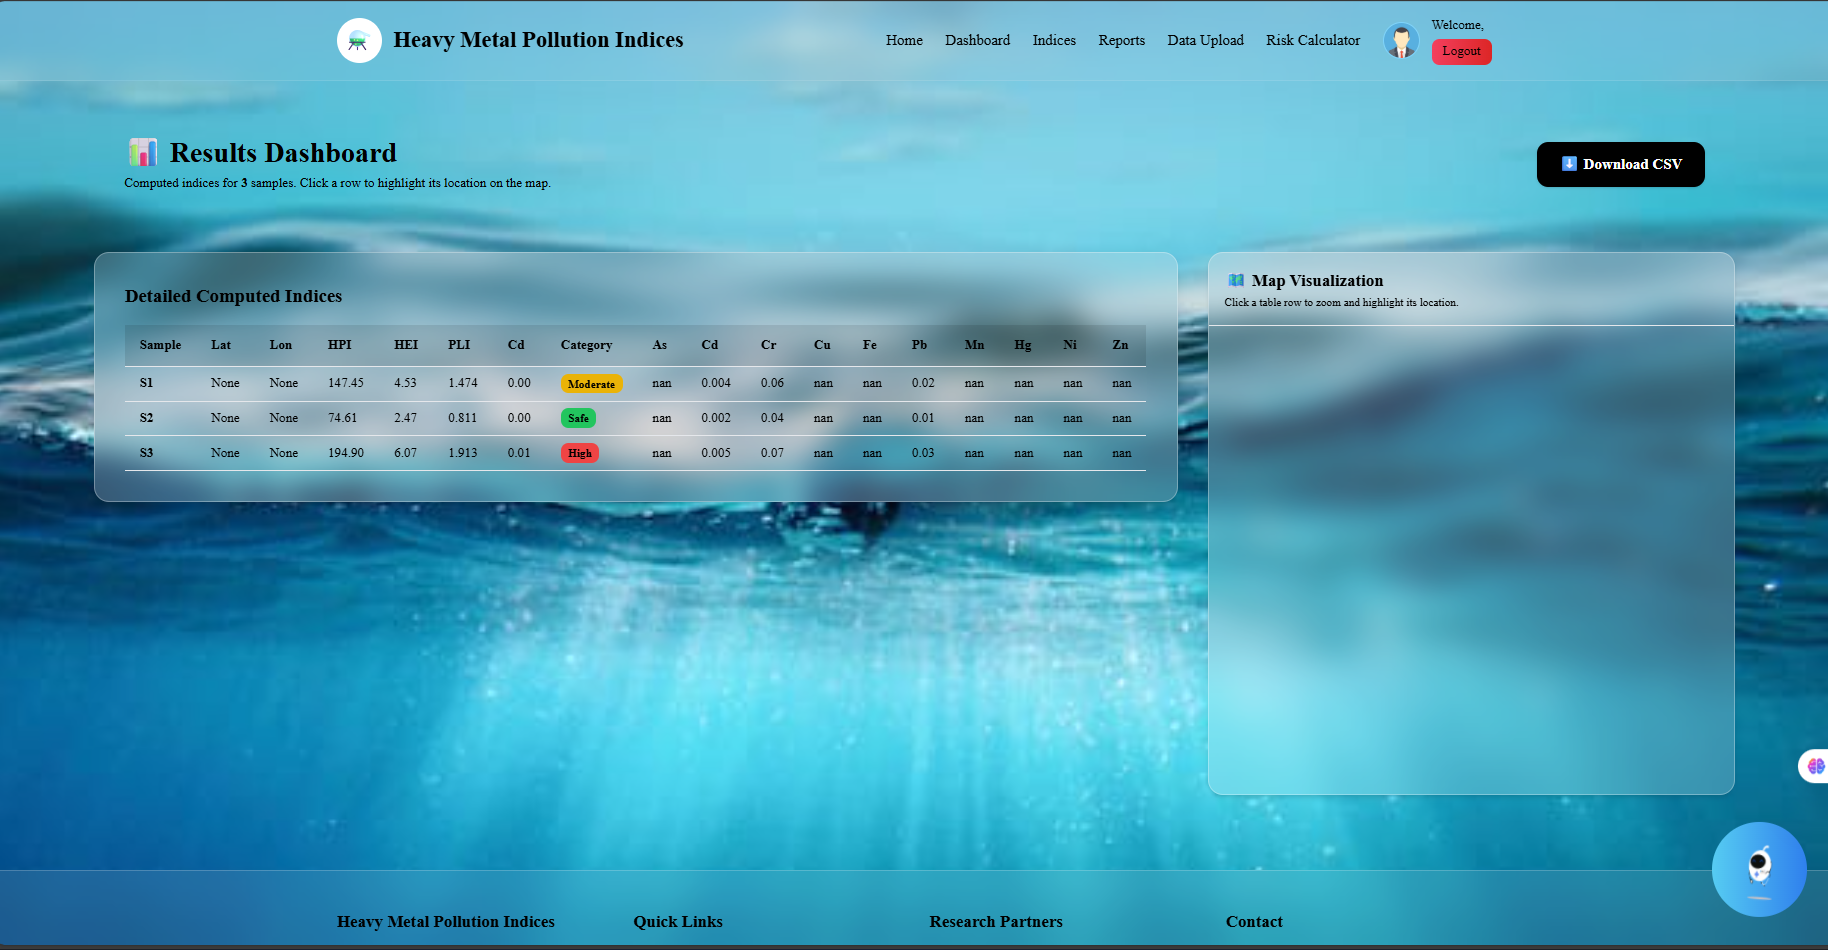
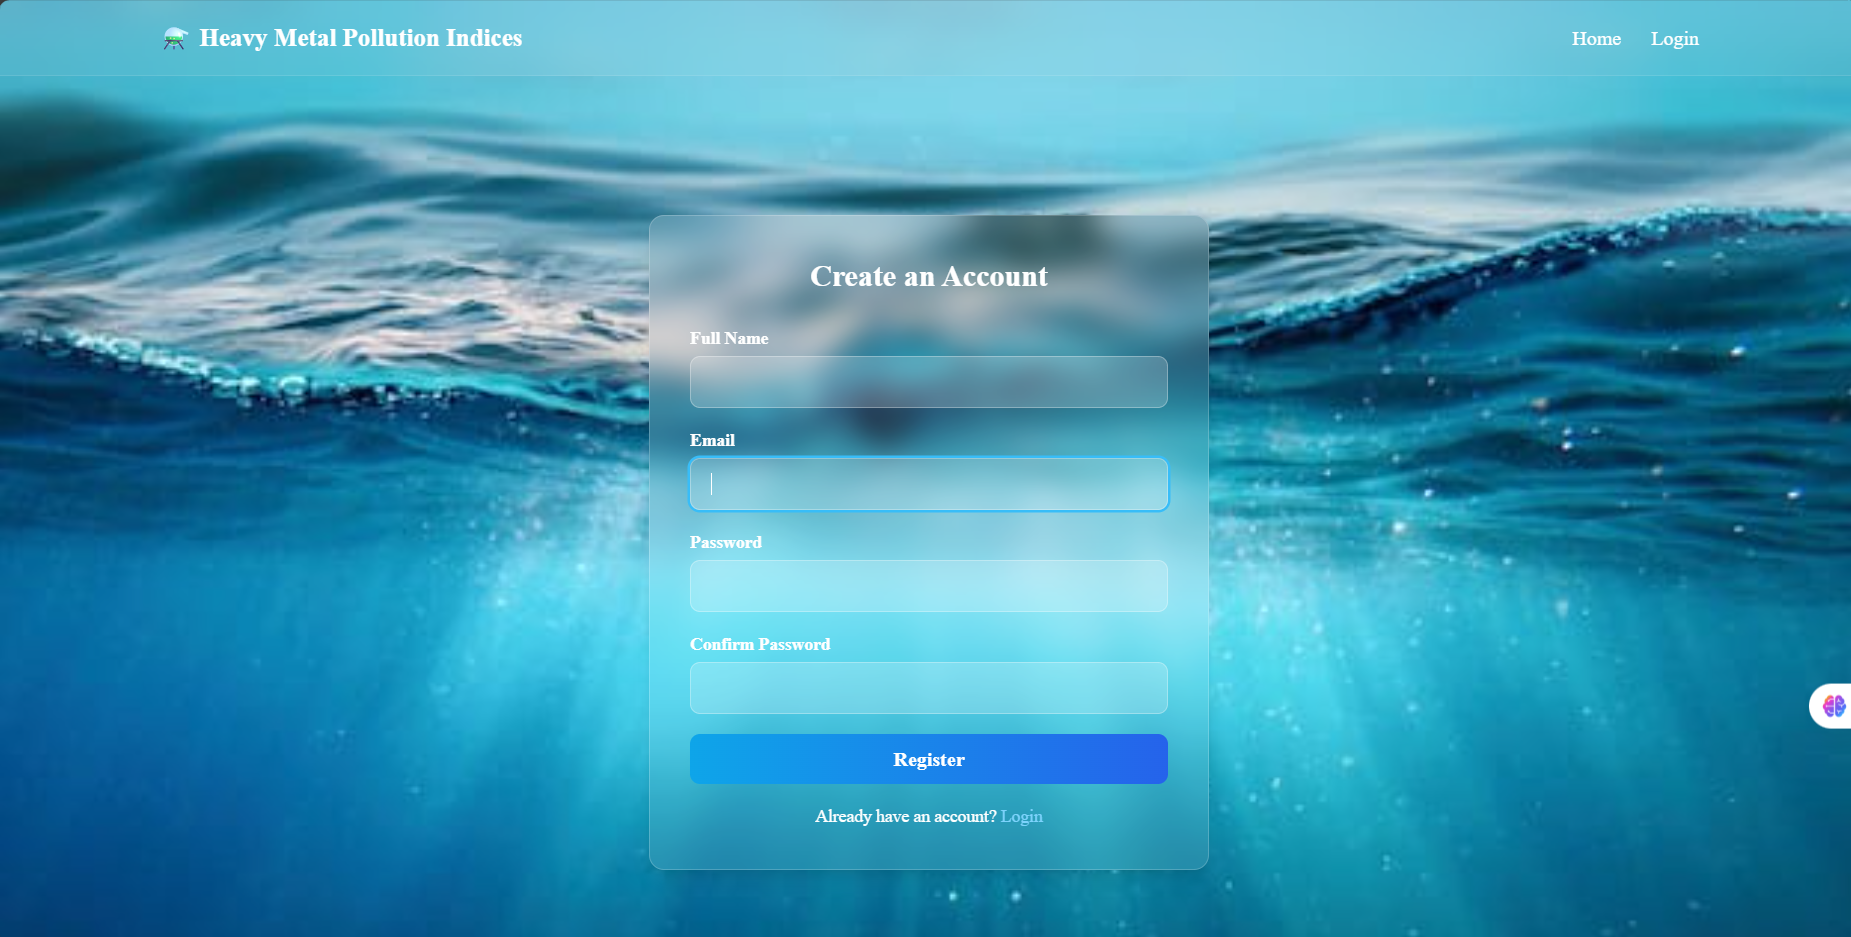
- Development Tools Jupyter Notebook: For testing algorithms and computations. VS Code / PyCharm: Integrated Development Environment (IDE). Anaconda: Package and environment management. 20 CHAPTER 4: IMPLEMENTATION Login / Registration Page Secure login and role-based access with password and OTP protection Fig:4.1 Login/ Registration Page Dashboard/Home Page Visualization of heavy metal trends and regional comparisons through dashboard analytics 21 Fig:4.2 Dashboard / Home Page Data Submission Page Form for uploading Ground Water Data (CSV) Fig:4.3 Data Submission Page Verification & Approval Module Automated computation of heavy metal pollution indices using standard methodologies. Integration of groundwater heavy metal concentration datasets with geo-coordinates Fig:4.4 Verification & Approval Module 22 Documentation Page Automated calculation of Pollution Indices (PLI, HPI) using standard formulas In-app documentation and transparent calculation methodology Fig:4.5 Documentation Page Contact/ Support Page For farmers / NGOs to get technical support FAQs or Chat support 23 CHAPTER 5: PERFORMANCE ANALYSIS
- Data Processing Efficiency The system supports CSV, Excel, and PDF input formats. Automated data cleaning reduces manual effort and ensures consistency.
- Accuracy of Computation Indices such as HPI, HEI, Cd, and HI were calculated using standard formulas from WHO, BIS, and EPA guidelines. Results matched expected values, ensuring reliable analysis.
- Visualization Graphs and interactive maps are generated for easy interpretation. Contamination hotspots can be quickly identified, supporting decision making.
- Usability & Automation
The workflow (Upload → Analysis → Visualization) is fully automated.
The interface is user-friendly, making it accessible to students, NGOs,
and administrators.
24
CHAPTER 6: CONCLUSION
Conclusion
The proposed Heavy Metal Pollution Index (HMPI) Application provides an
efficient,
automated, and reliable solution for assessing groundwater
contamination caused by toxic heavy metals. By integrating data ingestion,
automated analysis, and visualization, the system minimizes human error and
ensures consistent, real-time monitoring. Standardized indices such as HPI,
HEI, Cd, and HI ensure compliance with guidelines from WHO, BIS, and EPA,
offering a comprehensive view of contamination severity and associated health
risks.
The integration of statistical methods (PCA, cluster analysis, correlation analysis) further enhances the understanding of contamination patterns, while visual maps and dashboards provide clear insights for stakeholders, researchers, and policymakers. Thus, the system contributes towards environmental safety, public health protection, and sustainable water resource management. Future Scope IoT Sensor Integration: Real-time water quality monitoring through low-cost IoT-based sensors connected directly to the platform. AI & Machine Learning Models: Implementation of predictive models for contamination forecasting and source identification. Scalability to Other Contaminants: Extension of the platform to monitor other pollutants such as fluoride, nitrates, pesticides, and microbial contaminants. Mobile Application for Community Engagement: Development of a user-friendly mobile app to enable farmers, communities, and NGOs to upload and access groundwater quality reports. Government and Industry Collaboration: Integration with national water quality programs and CSR initiatives to promote large-scale adoption. Decision Support System (DSS): Providing policy recommendations and early warning systems for contaminated regions to aid government decision-making 25

Log in or sign up for Devpost to join the conversation.