-
-
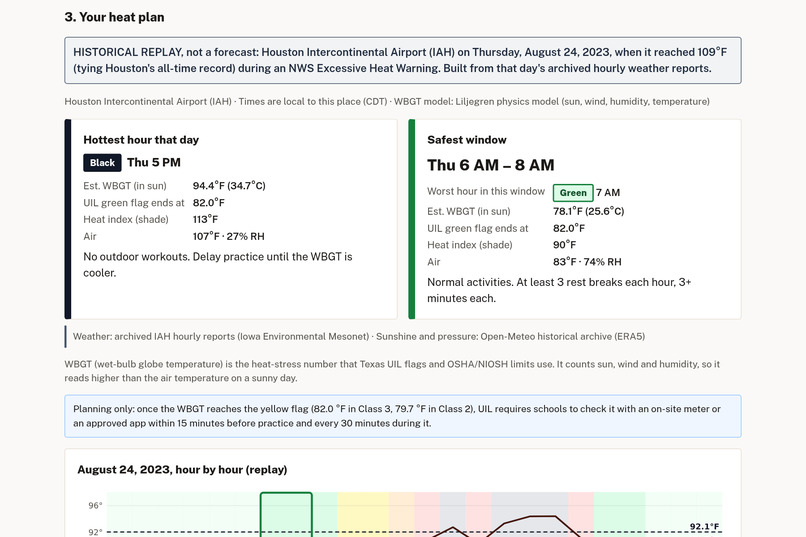
Replay of Houston's record day (Aug 24, 2023)
-
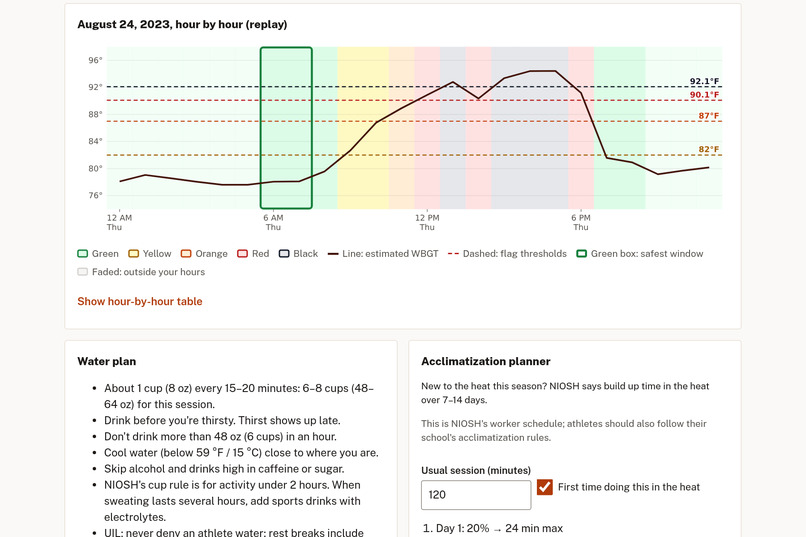
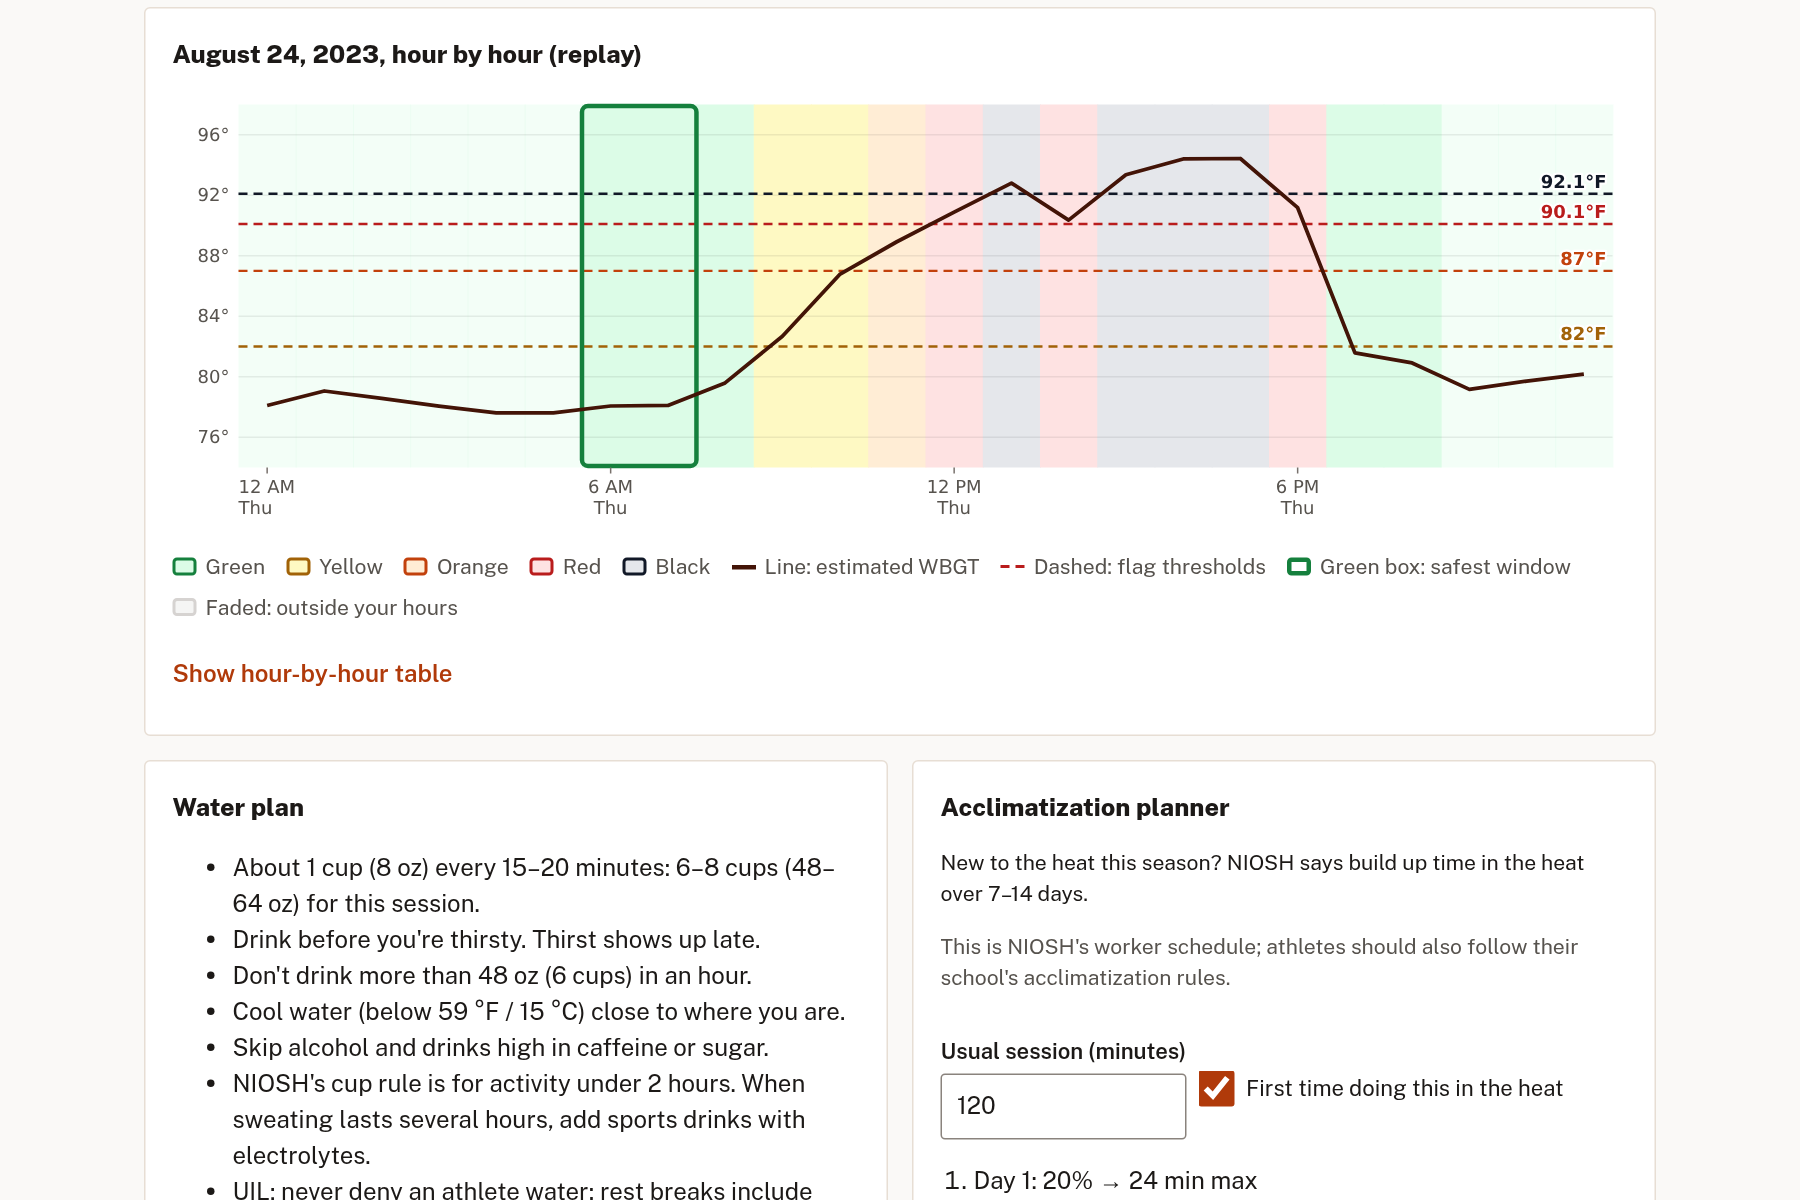
Hour-by-hour WBGT vs. UIL flag lines
-
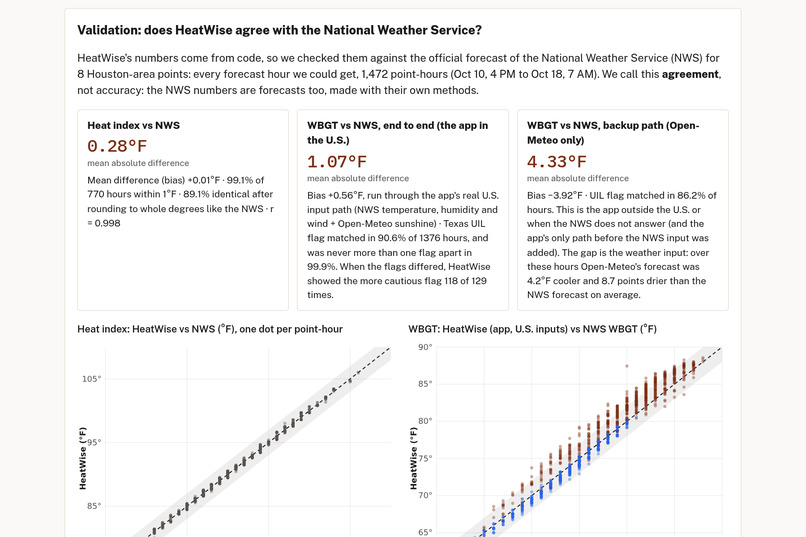
Validation against the National Weather Service
-
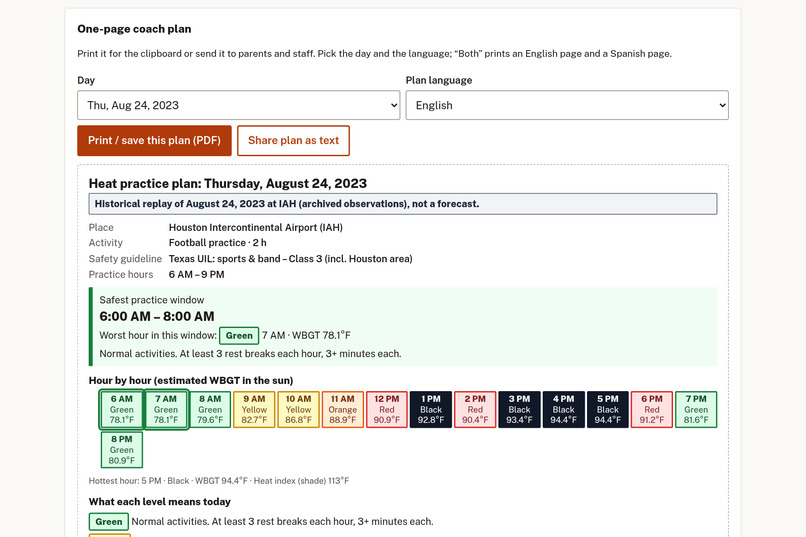
One-page coach plan (English)
-
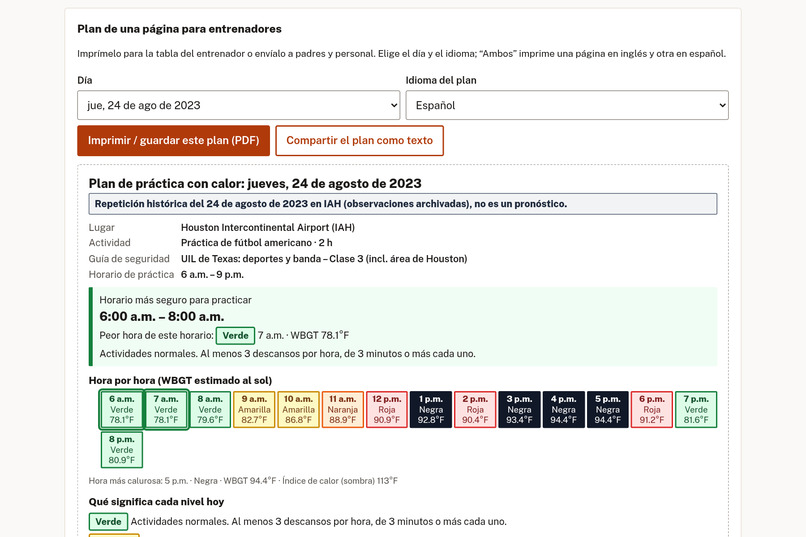
One-page coach plan (Spanish)
-
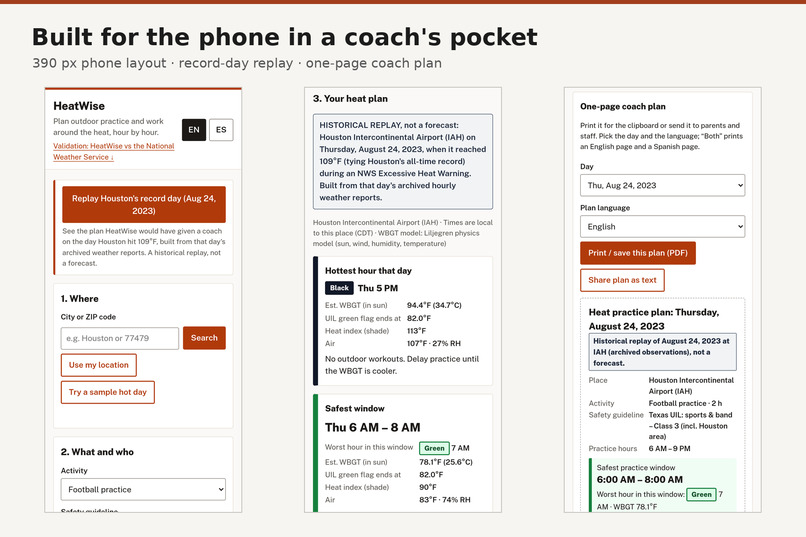
Phone layout (390 px)
Inspiration
I live in the Houston area, where late-summer football practice, marching band, and outdoor jobs happen in some of the most humid heat in the country. Heat-related deaths in the U.S. rose from 1,069 in 1999 to 2,325 in 2023 (JAMA, 2024: https://jamanetwork.com/journals/jama/fullarticle/2822854). Texas recorded 334 heat deaths in 2023 (preliminary state data, Jan 1–Nov 30), a state record, and Harris County had the most of any county (Texas Tribune: https://www.texastribune.org/2024/01/12/texas-heat-deaths-2023-record-climate-change). Weather apps tell you "it feels like 104°F," but they don't tell a coach whether their practice is safe. OSHA says the heat index ignores workload, sun and wind, and that outdoor workers have died of heat stroke on days when the heat index peaked at only 86°F (https://www.osha.gov/heat-exposure/hazards). I wanted a tool that answers the real question: "Is it safe for us to do this, and if not, when is?"
What it does
You pick a place (search, or use your location), an activity (football practice, band rehearsal, mowing, a mail route, or a custom OSHA workload), and how long you'll be out. Athletics and band use Texas UIL's required WBGT flags (Class 2 or 3); work uses the OSHA/NIOSH limit for your workload, acclimatization and clothing. HeatWise then shows:
- This hour: the UIL flag (green to black) with UIL's rest-break and practice-length rules, or your risk level against the OSHA/NIOSH limit
- Safest window: the best start time in the next 48 hours, inside the hours you allow
- A 48-hour chart and table of estimated WBGT in the sun vs. the flag lines or your limit, plus the NWS heat index
- A water plan (about 1 cup every 15-20 minutes, no more than 48 oz an hour, electrolytes past 2 hours, all from NIOSH)
- An acclimatization planner (the NIOSH day-by-day build-up)
- Warning signs and first aid from OSHA and the NWS
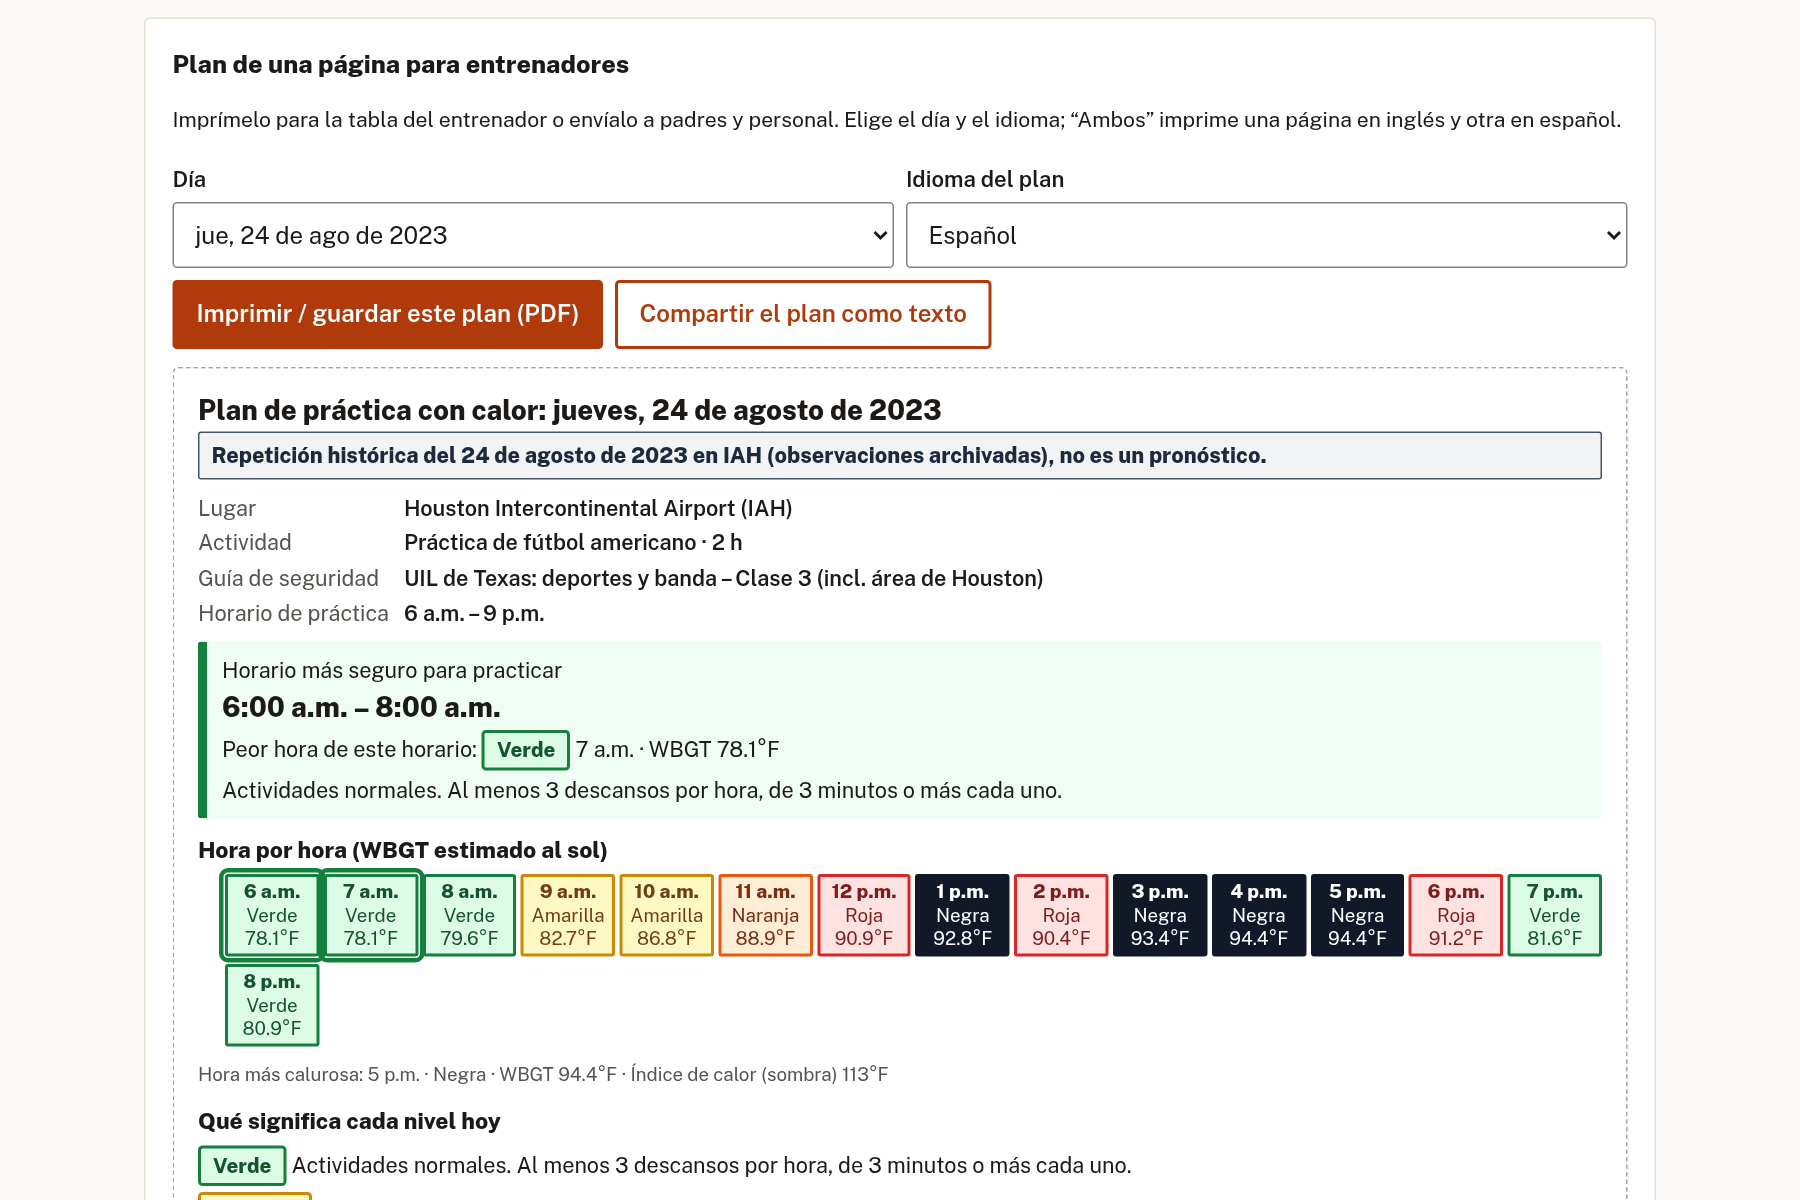
- English and Spanish in one click, plus a shareable link and a printable plan
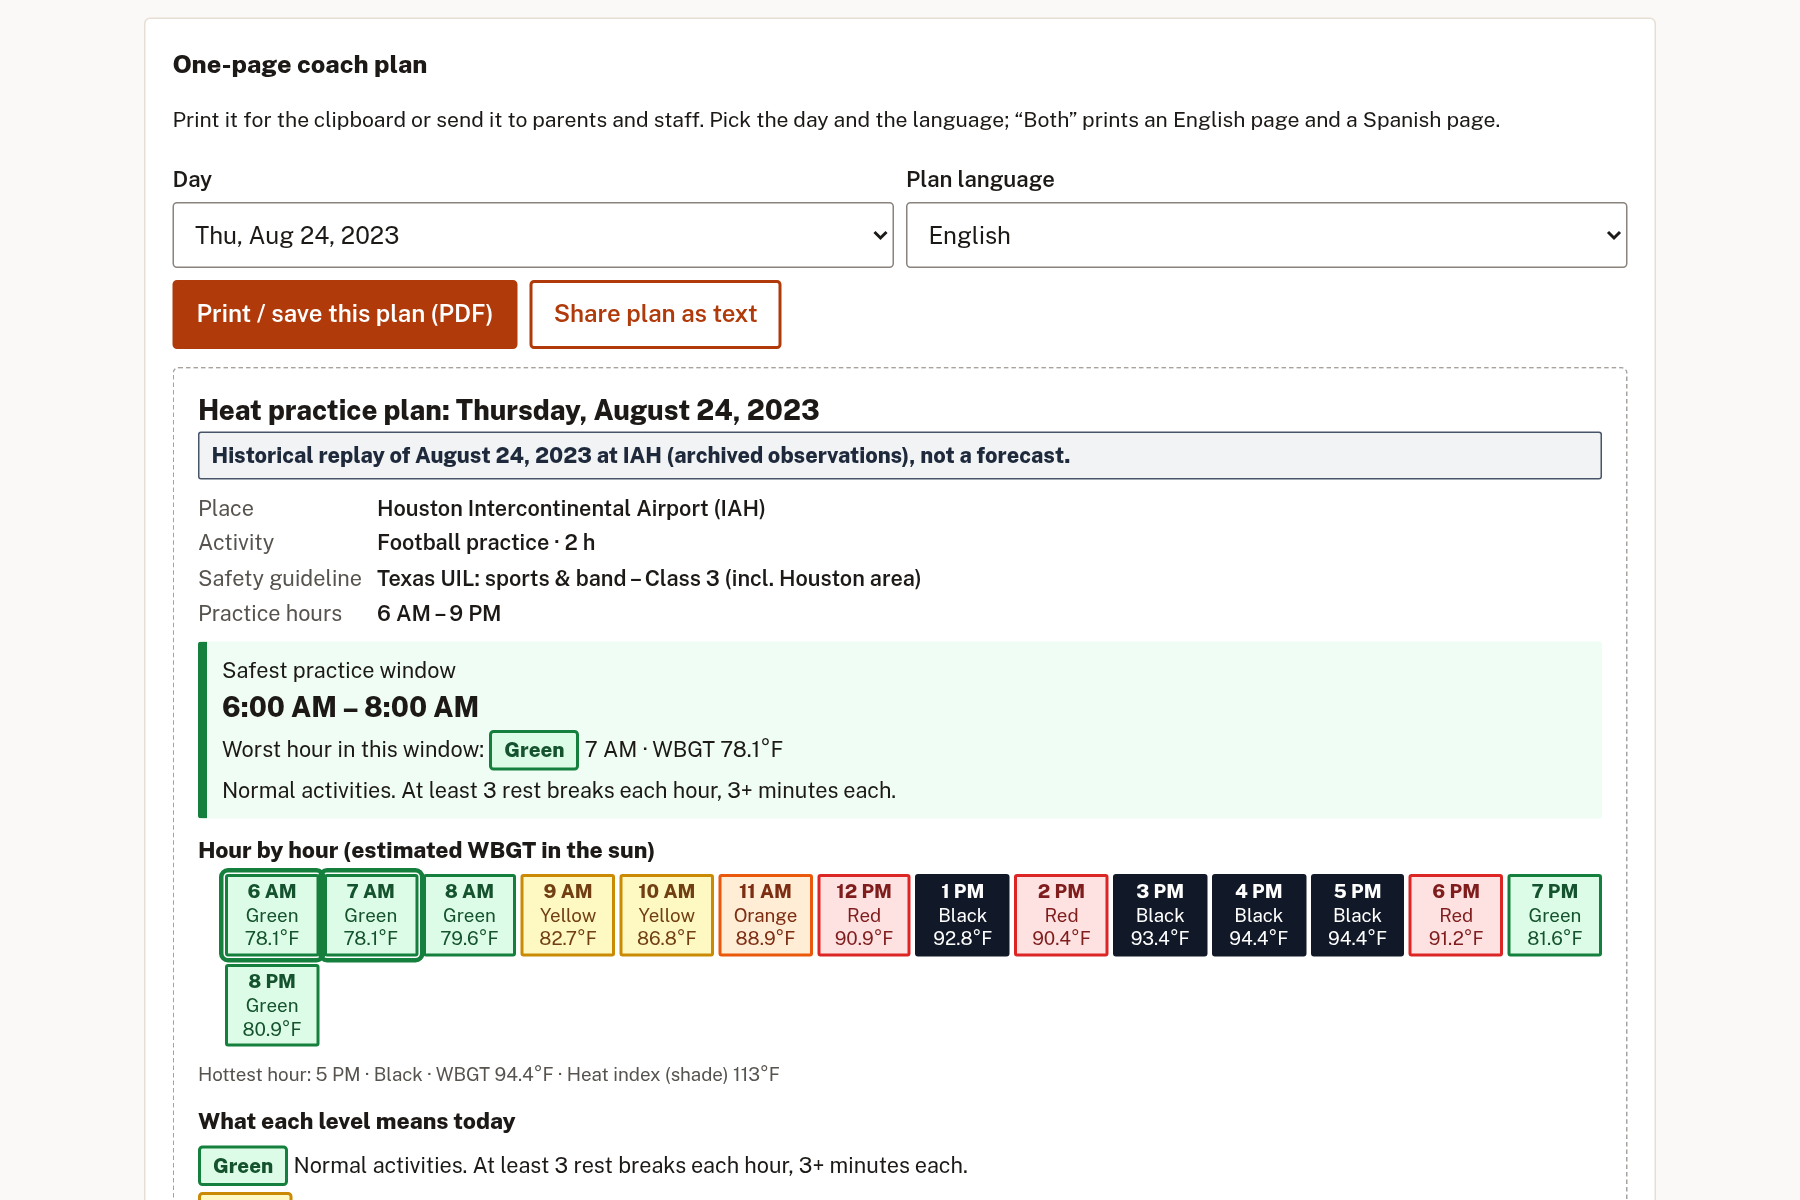
- A one-page coach plan for any day: safest practice window, hour-by-hour flag strip, rules for each flag, water, before-practice checklist and first aid, printable in English, Spanish, or both
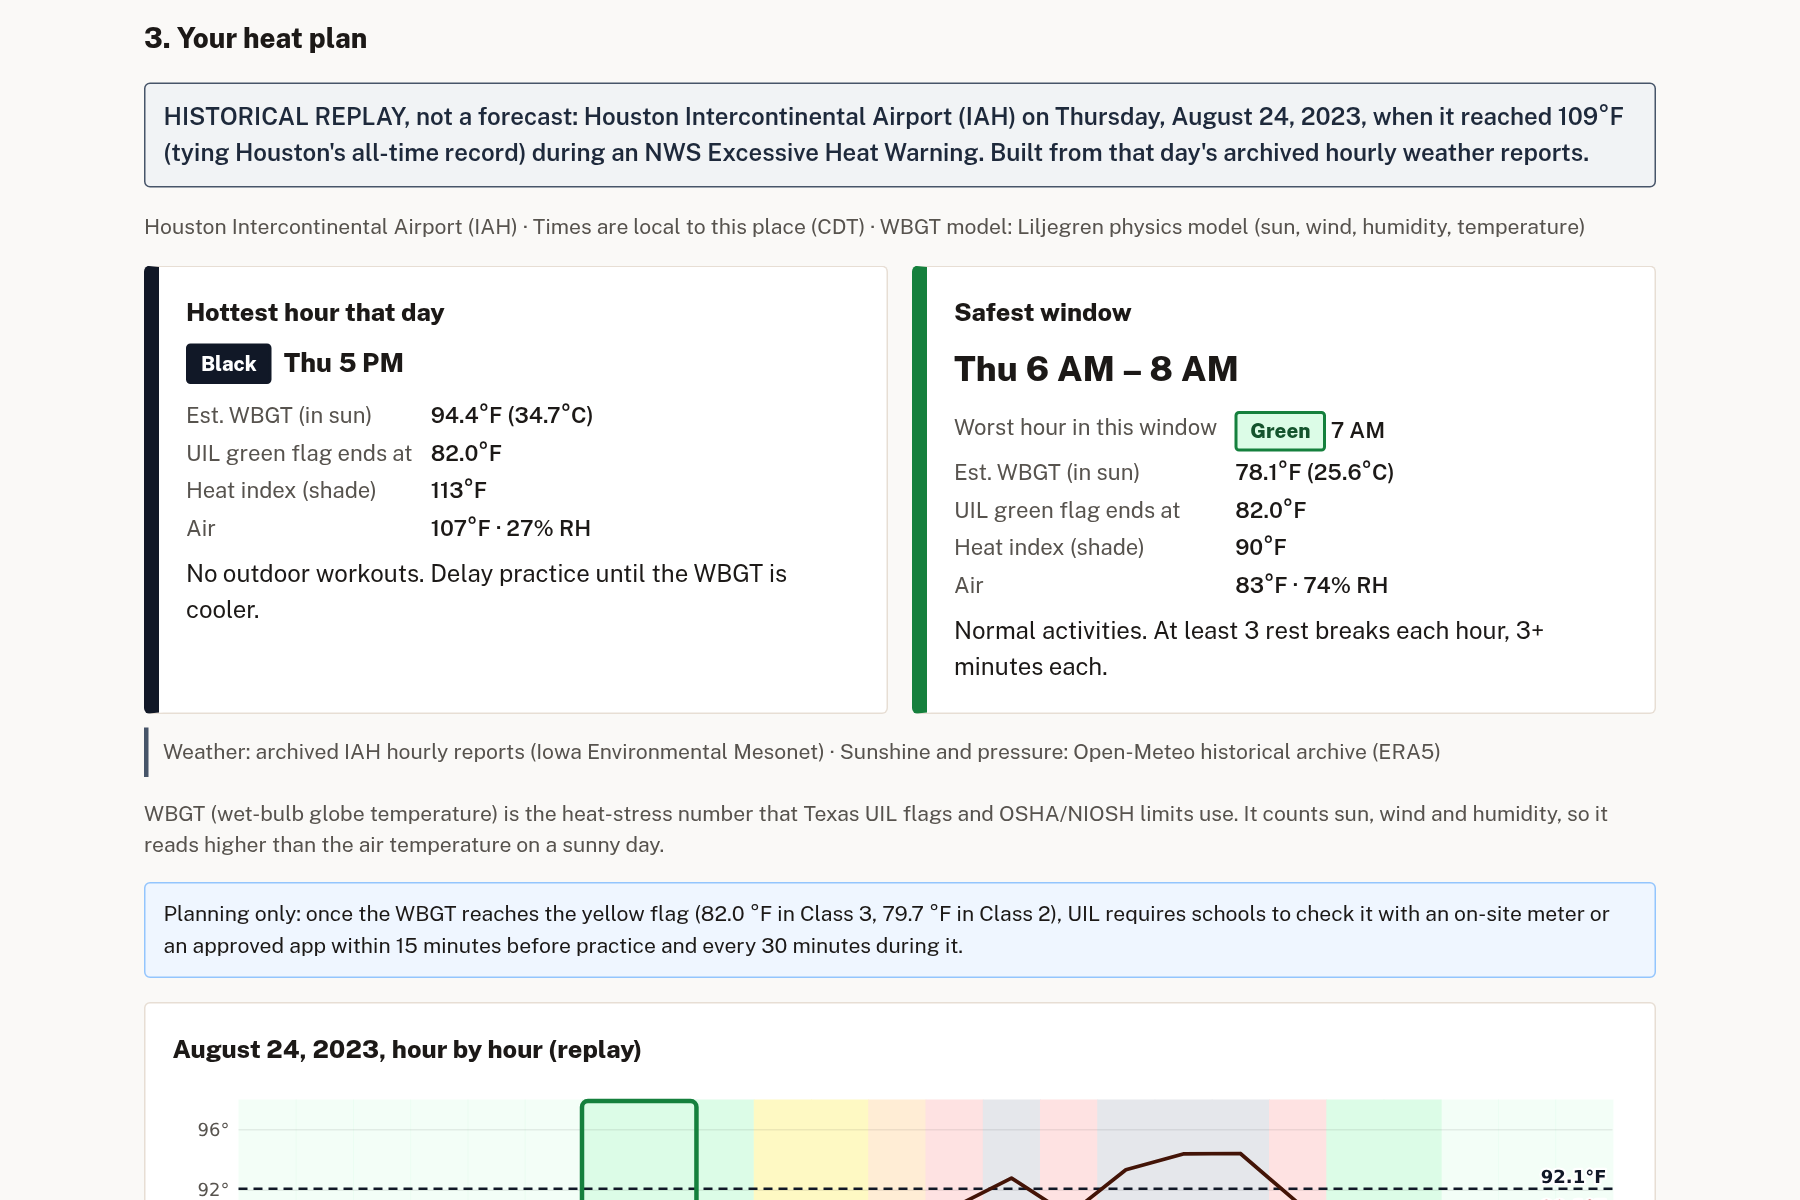
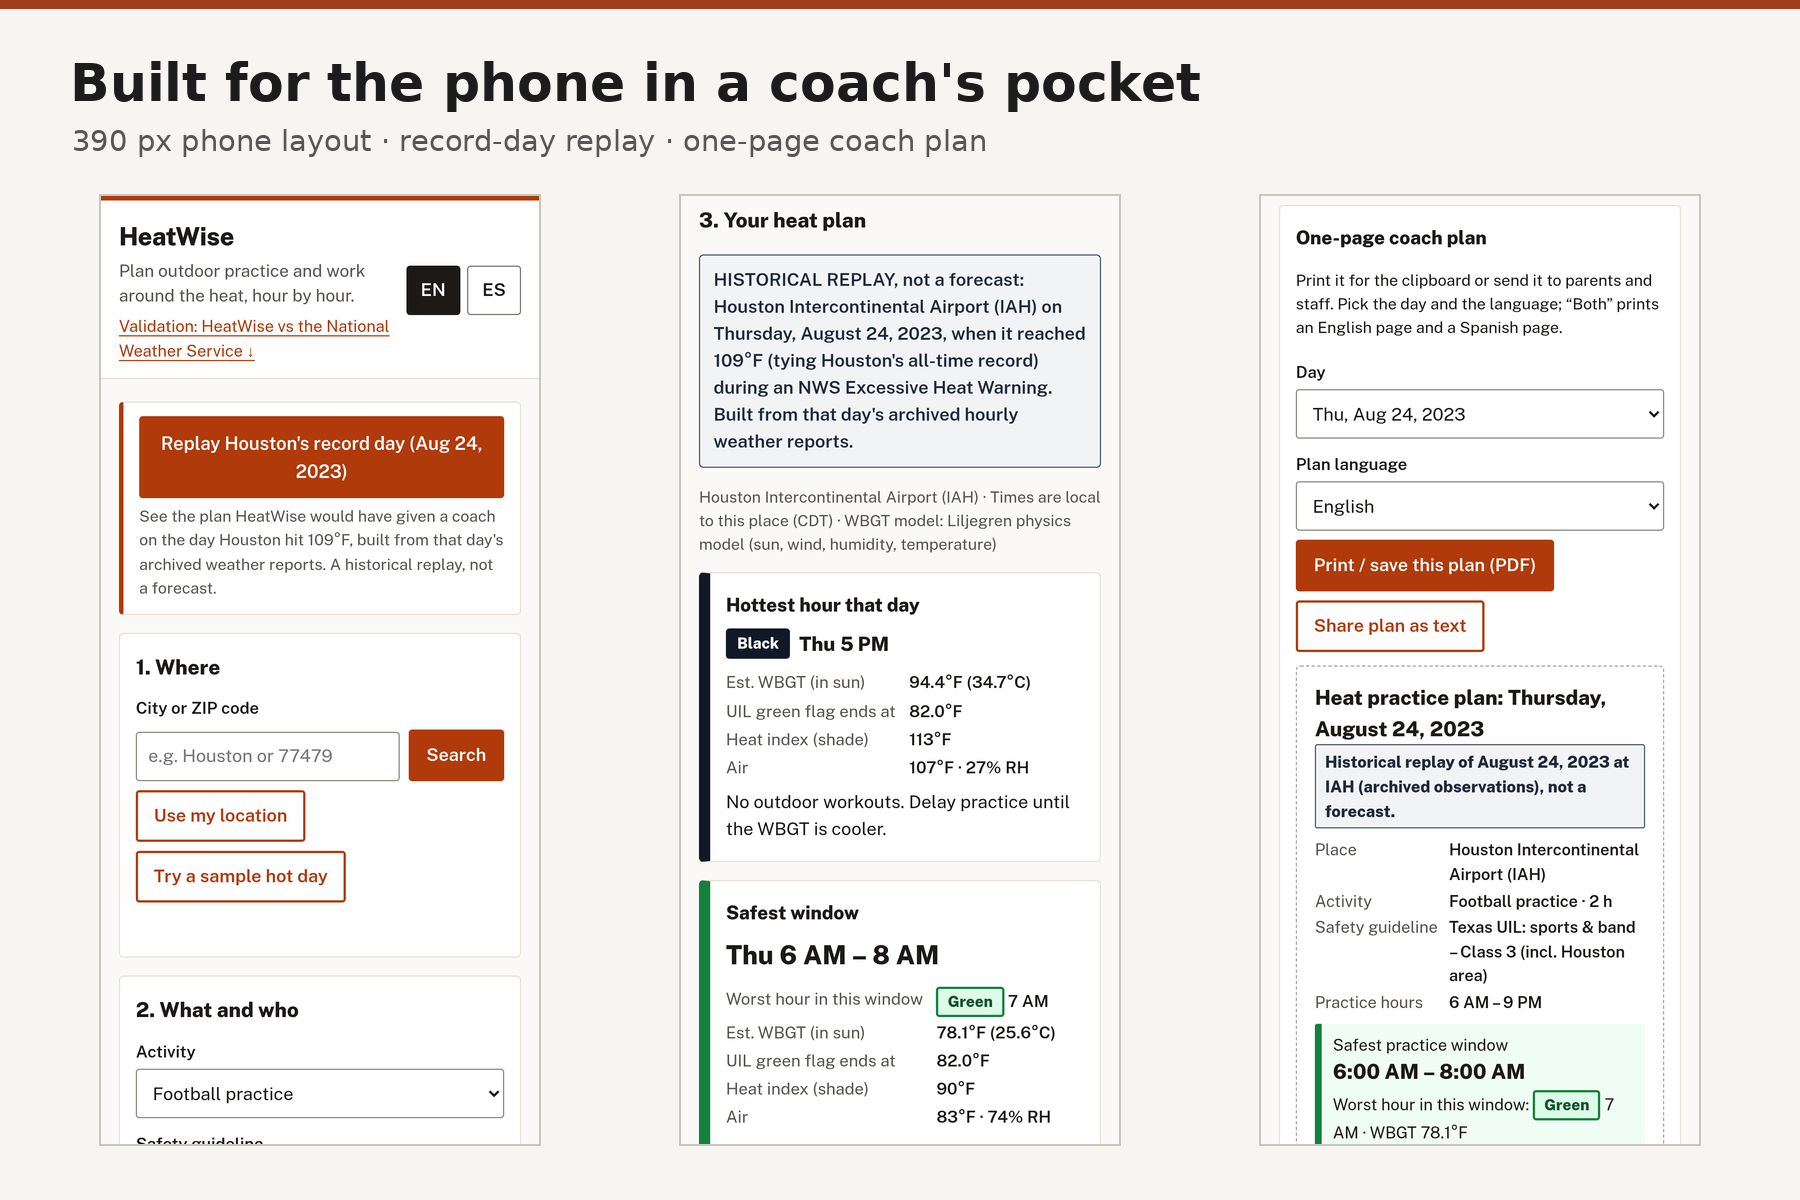
- A one-click replay of Houston's record day (Aug 24, 2023, 109°F): archived weather runs through the same plan view, clearly labelled as a historical replay
How I built it
- Data: for U.S. places, hourly temperature, humidity and wind come from the National Weather Service gridded forecast (api.weather.gov); sunshine and pressure come from Open-Meteo. Outside the U.S., or if the NWS doesn't answer, everything comes from Open-Meteo. Both are free with no API key, and the plan shows which source it used. Place search uses Open-Meteo's geocoding.
- Science: I estimate wet-bulb globe temperature (WBGT), the index OSHA, NIOSH, the military, and Texas UIL use, with the Liljegren et al. (2008) physics model. My JavaScript port matches the open-source reference implementation (pywbgt) to within 0.05 °C in the tests. For athletics I compare WBGT with UIL's flags; for work I add OSHA/NIOSH clothing factors and compare with the limit for the workload and acclimatization status. If sun or wind data are missing, it falls back to the Bureau of Meteorology approximation WBGT = 0.567T + 0.393e + 3.94.
- Algorithm: finding the safest window is a minimax problem. Among all runs of consecutive allowed hours, I want the one whose worst hour is coolest. I solve it in O(n) with a monotonic-deque sliding-window maximum, and verify it against a brute-force solver on 500 random test cases.
- Stack: plain HTML, CSS, and JavaScript ES modules. No framework, no build step, no backend, no tracking. The SVG chart is drawn by hand. Hosted on GitHub Pages.
- Quality: all the math lives in pure functions with dependency-free tests (node tests/heat.test.mjs) checking the WBGT model against pywbgt, sun position against NREL's SPA, the heat index against NWS chart values, UIL flag edges, OSHA/NIOSH limits, hydration, acclimatization, that every English string has a Spanish one, the NWS grid parser, every forecast fallback, and place search. A headless-browser check covers the 390 px phone layout, both languages, accessibility (axe-core), and error states.
- Reliability: if the NWS forecast fails, the plan falls back to Open-Meteo and says so. If no forecast can be loaded, HeatWise says so, shows a clearly labelled synthetic sample day, and offers "Try again".
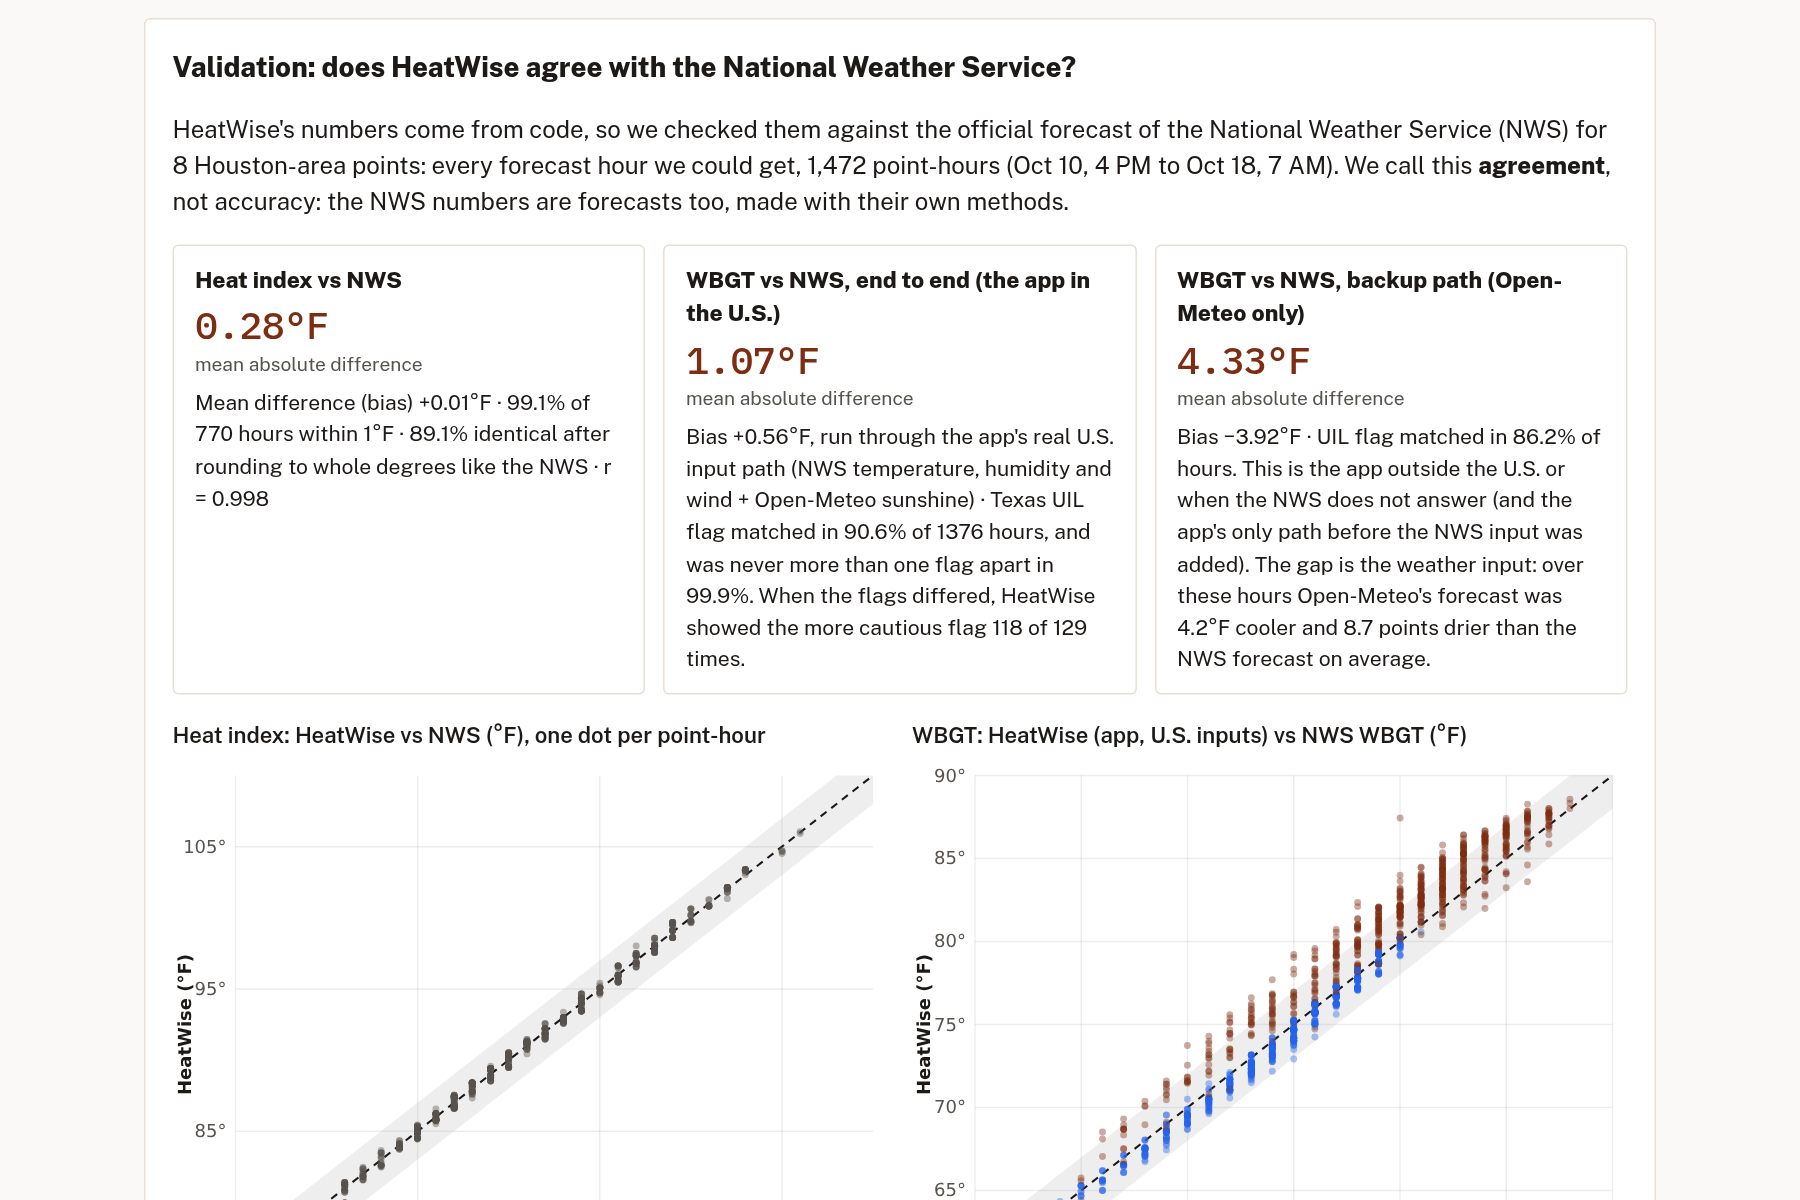
Validation: does it agree with the National Weather Service?
I checked HeatWise against the NWS's own forecast for 8 Houston-area points over every forecast hour the NWS grid had (1,472 point-hours, Oct 10-18, 2026, from the forecast issued Oct 10 at 4:06 PM CDT, via api.weather.gov). I call it agreement, not accuracy, because the NWS numbers are forecasts too.
- Heat index: my formula, run on the NWS's forecast temperature and humidity, matched the NWS forecast heat index with a mean absolute difference of 0.28 °F and a bias of +0.01 °F over 770 hours at or above 80 °F (99.1% within 1 °F; r = 0.998).
- What the first study found (and what I changed): the formulas matched, but the app's original weather input, Open-Meteo alone, forecast air about 4.2 °F cooler and 8.7 humidity points drier than the NWS that week, so its WBGT read 3.9 °F low, the unsafe direction. The formula wasn't the weak link; the forecast feeding it was. So I switched U.S. places to the NWS grid.
- WBGT, end to end, after the fix: the end-to-end bias went from -3.92 °F to +0.56 °F (mean absolute difference 4.33 to 1.07 °F). The Texas UIL flag now matches the NWS in 90.6% of 1,376 hours, and in 118 of the 129 disagreements HeatWise shows the more cautious flag.
- Replay of Houston's record day (Aug 24, 2023): IAH hit 109 °F, tying Houston's all-time record (NWS Houston climate summary: https://www.weather.gov/media/hgx/climate/summary/Aug_2023_Regional_Climate_Summary.pdf). Running the airport's archived hourly reports through HeatWise: heat index peaked at 117 °F, WBGT in the sun at 94.4 °F, the UIL flag was black (no outdoor workouts) for 4 hours and red for 3 more, and the safest 2-hour practice window was 6-8 AM (green). HeatWise's heat index matched the Iowa Environmental Mesonet's independent calculation for all 24 reports within 0.01 °F.
What makes it innovative
- Personalized to the activity, not just the weather: the same afternoon can be "caution" for a spectator and "extreme" for an unacclimatized football player in pads.
- Prescriptive, not just descriptive: it schedules the safest window with an optimal algorithm.
- Bilingual and shareable, built for coaches and crew leads who need one plan for a whole group, including Spanish-speaking families and workers.
- Validated against the National Weather Service, with a replay of Houston's record-heat day. The study found a real problem (the weather input read cool); I fixed it and re-measured.
- Honest about uncertainty: it says plainly that it's a screening tool.
Challenges I ran into
- Real WBGT needs a black-globe and natural wet-bulb thermometer, which forecasts don't give you. I ported the Liljegren physics model and tested it against the reference code.
- Forecast times come in the location's local time, while the browser may be in a different time zone, so I had to format times without letting the browser shift them.
- The NWS API asks apps to identify themselves with a User-Agent header, but browsers don't let a web page set it. I tested that the API still answers browser requests (CORS allows *), kept requests simple, and built a fallback for every way it can fail.
- I had to turn guidelines written for employers into advice a teenager or a coach can act on in 10 seconds.
Accomplishments I'm proud of
- An O(n) best-window algorithm with a brute-force-verified test
- Every number in the app traces back to UIL, OSHA, NIOSH, the NWS, or the published WBGT model
- A validation study that changed the design: 0.28 °F heat-index agreement with the NWS, and an end-to-end WBGT bias cut from -3.9 °F to +0.6 °F
- It works on a phone, in two languages, with no sign-up and no cost
What I learned
How WBGT differs from the heat index, why acclimatization changes safe limits so much, sliding-window algorithms, and how to design for people who need a decision, not a data dump.
What's next
- Repeat the study over a full summer and against on-site WBGT meters
- A coach mode with roster acclimatization tracking
- Alerts when an upcoming practice window turns high-risk
- More languages reviewed by native speakers, and a pilot with a local school athletic or band program
Disclaimer
HeatWise is a screening and planning tool, not medical advice. OSHA recommends on-site WBGT measurement for the most accurate assessment. When in doubt, cool the person and call 911.
References
OSHA Heat Hazard Recognition https://www.osha.gov/heat-exposure/hazards ; OSHA First Aid https://www.osha.gov/heat-exposure/illness-first-aid ; NWS Heat Illness https://www.weather.gov/safety/heat-illness ; UIL Heat Stress Plan https://www.uiltexas.org/health/info/heat-stress-and-athletic-participation ; Liljegren et al. 2008 https://doi.org/10.1080/15459620802310770 ; CDC/NIOSH https://www.cdc.gov/niosh/heat-stress/recommendations/index.html ; NWS Heat Index Equation https://www.wpc.ncep.noaa.gov/html/heatindex_equation.shtml ; Howard et al., JAMA 2024 https://jamanetwork.com/journals/jama/fullarticle/2822854 ; Open-Meteo https://open-meteo.com/ ; NWS API https://www.weather.gov/documentation/services-web-api ; Iowa Environmental Mesonet https://mesonet.agron.iastate.edu/request/download.phtml
Built With
- css3
- es-modules
- github
- html5
- iowa-environmental-mesonet
- javascript
- national-weather-service-api
- node.js
- open-meteo-api
- svg

Log in or sign up for Devpost to join the conversation.