-
-
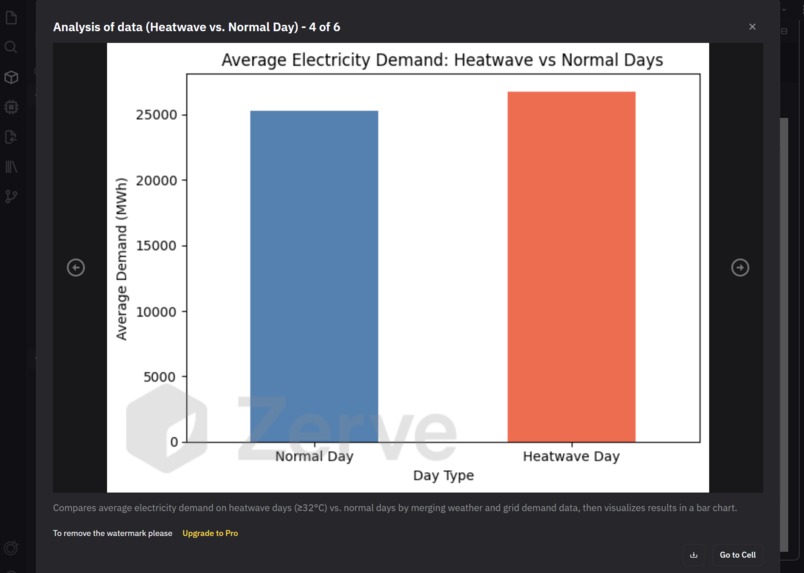
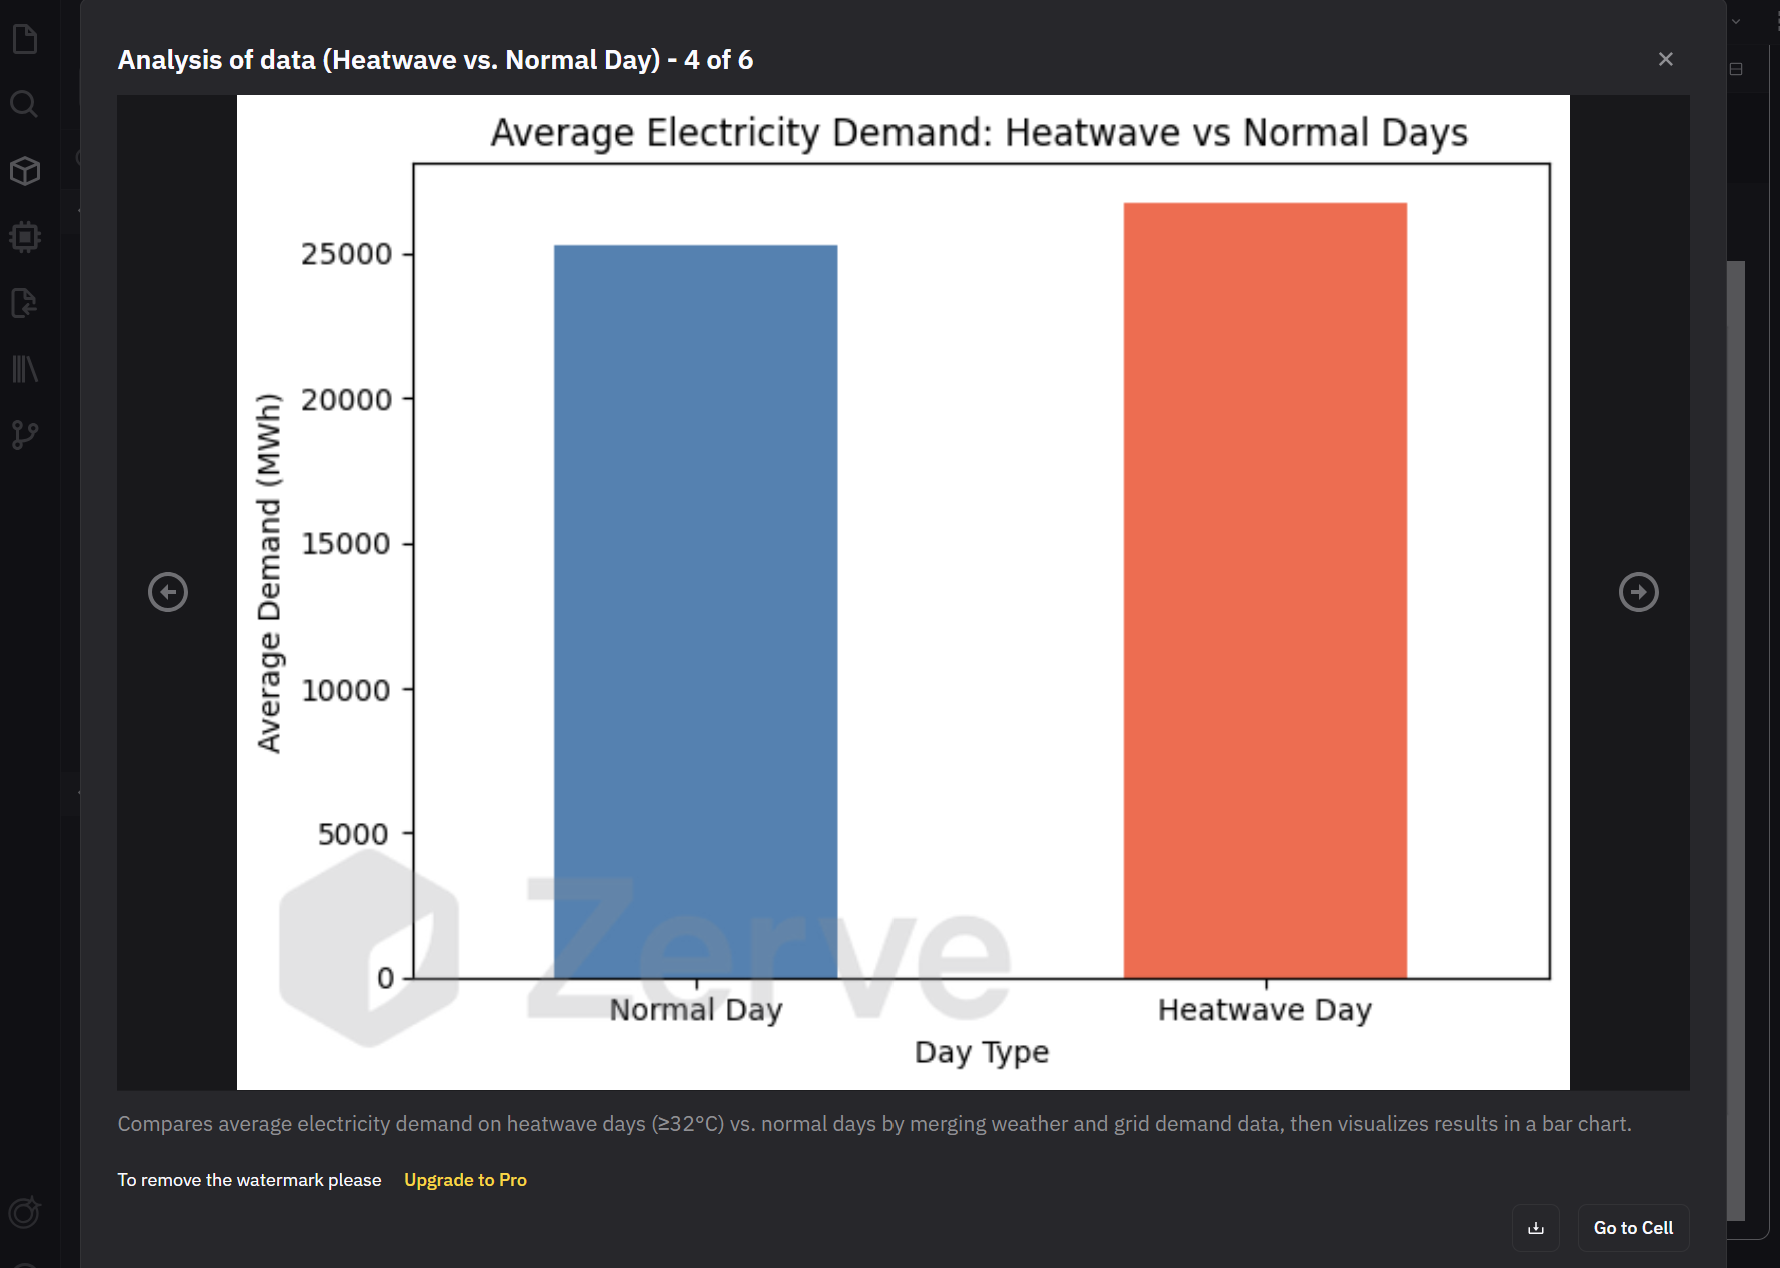
heatwave vs normal demand
-
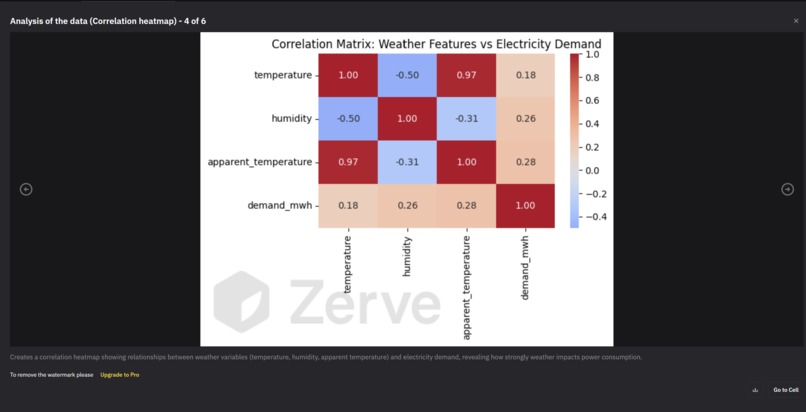
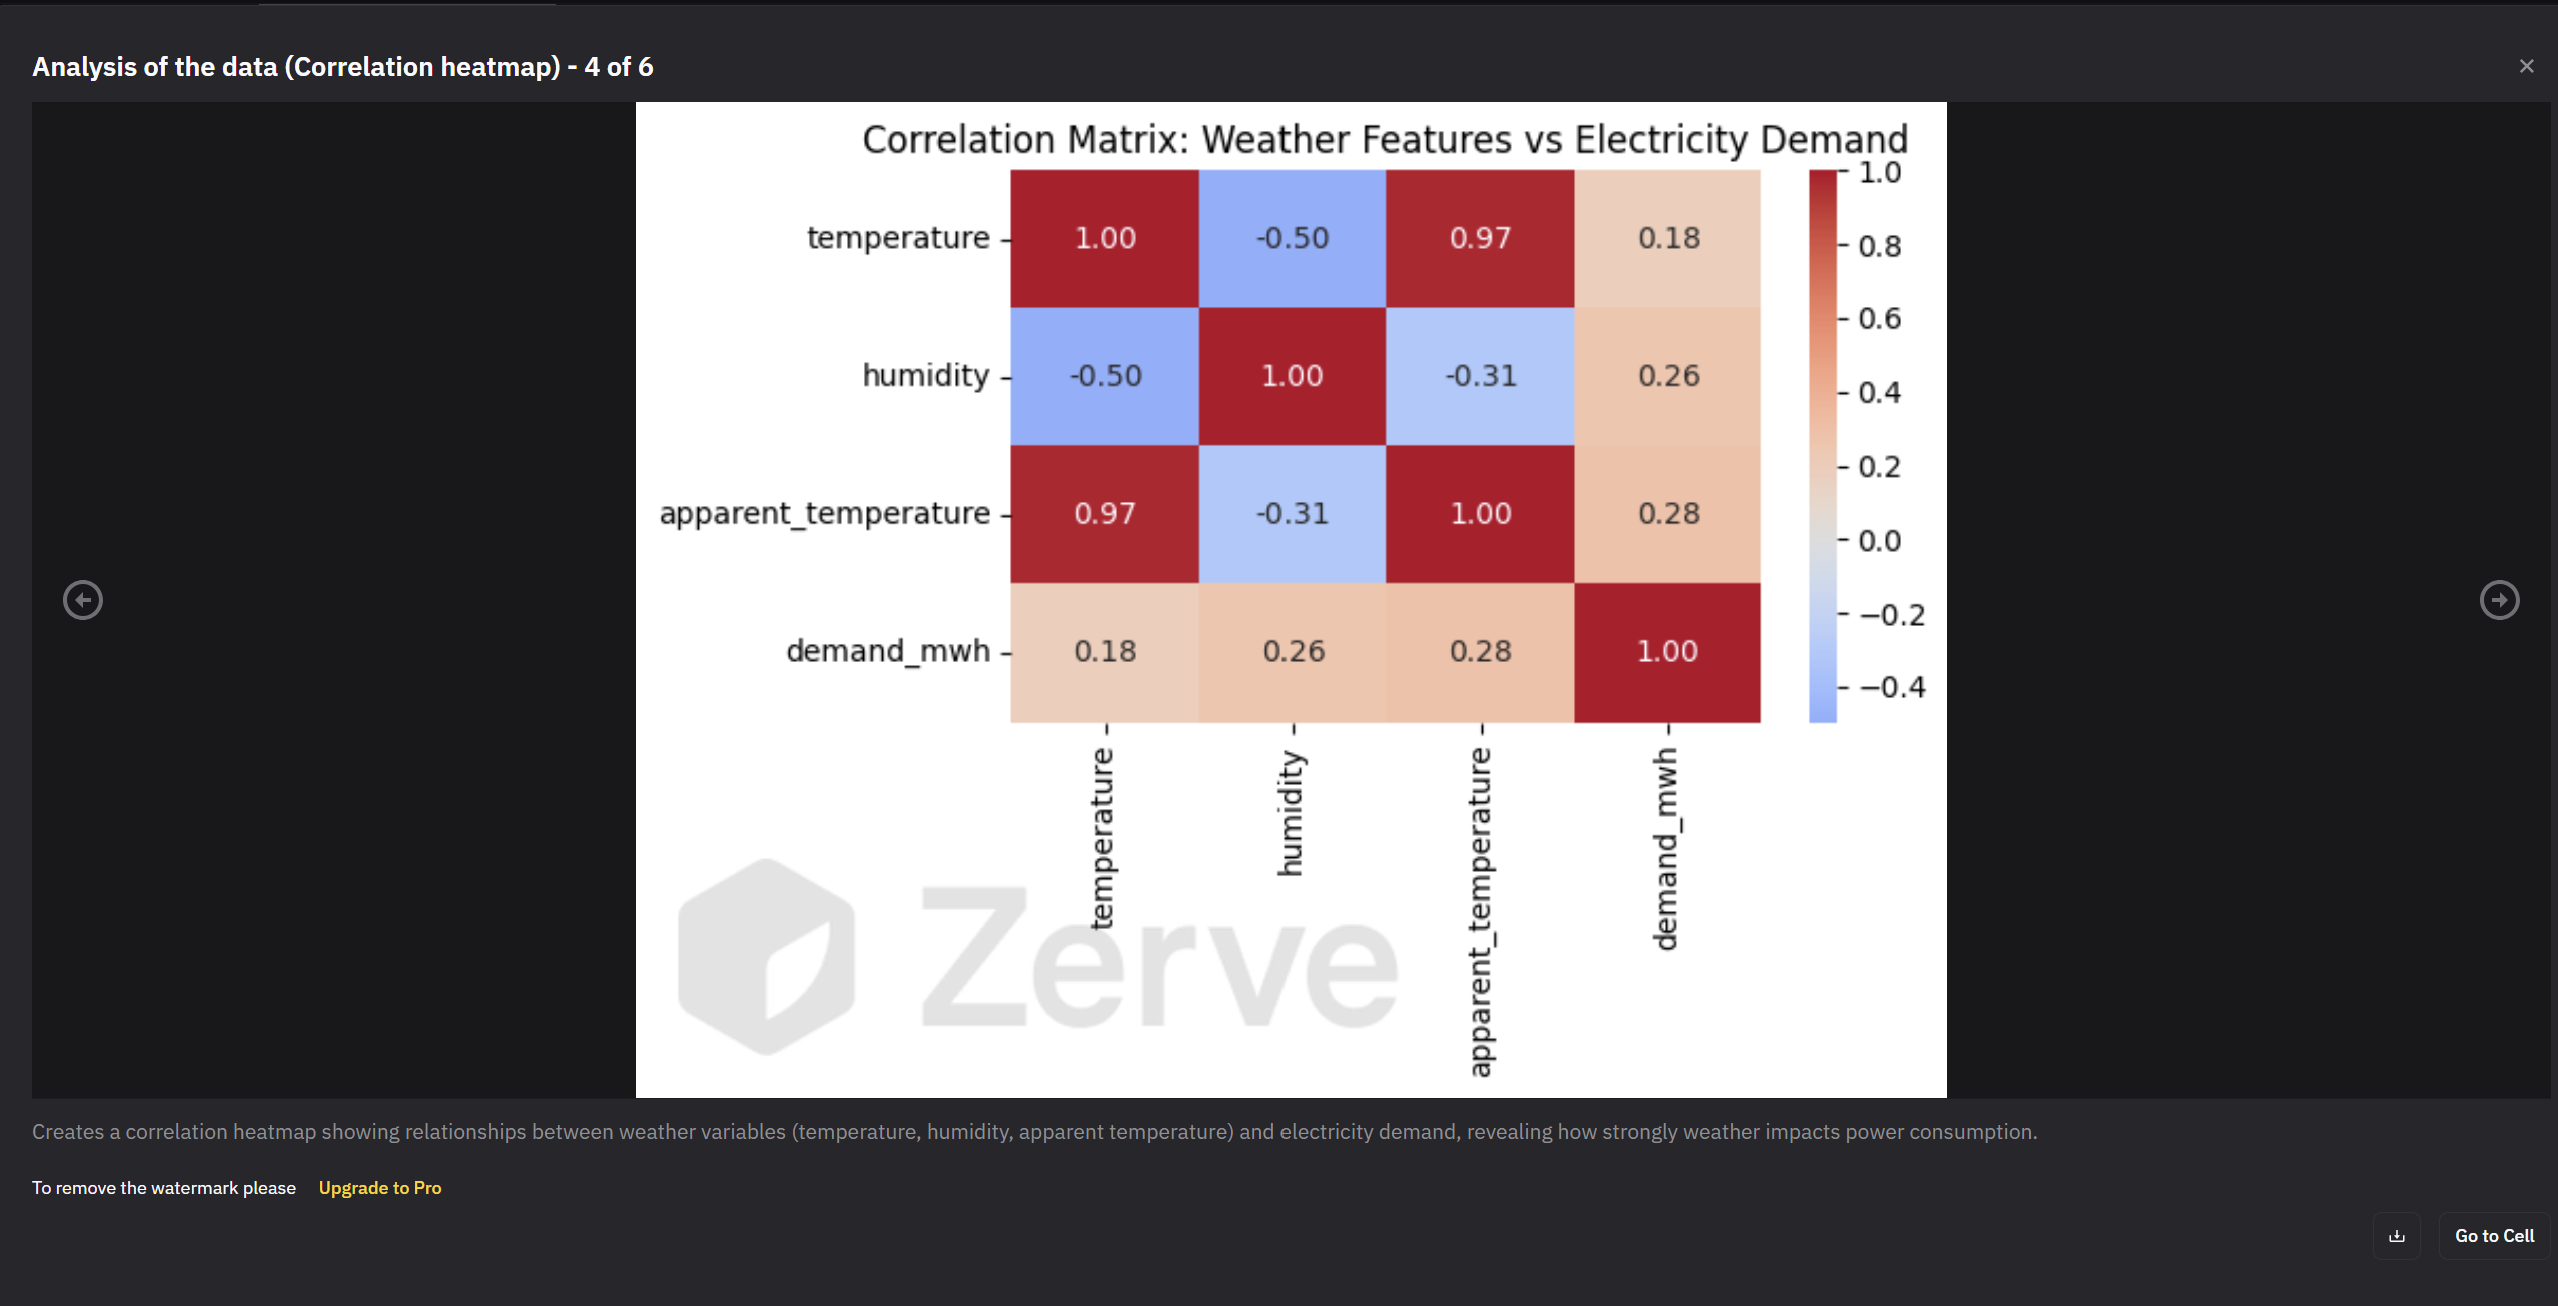
correlation matrix between features and electricity demand
-
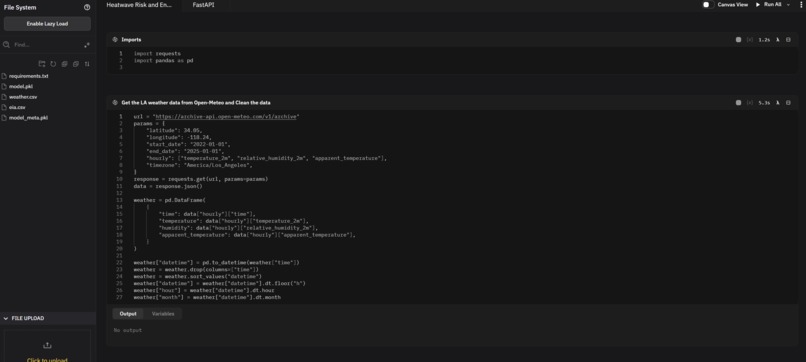
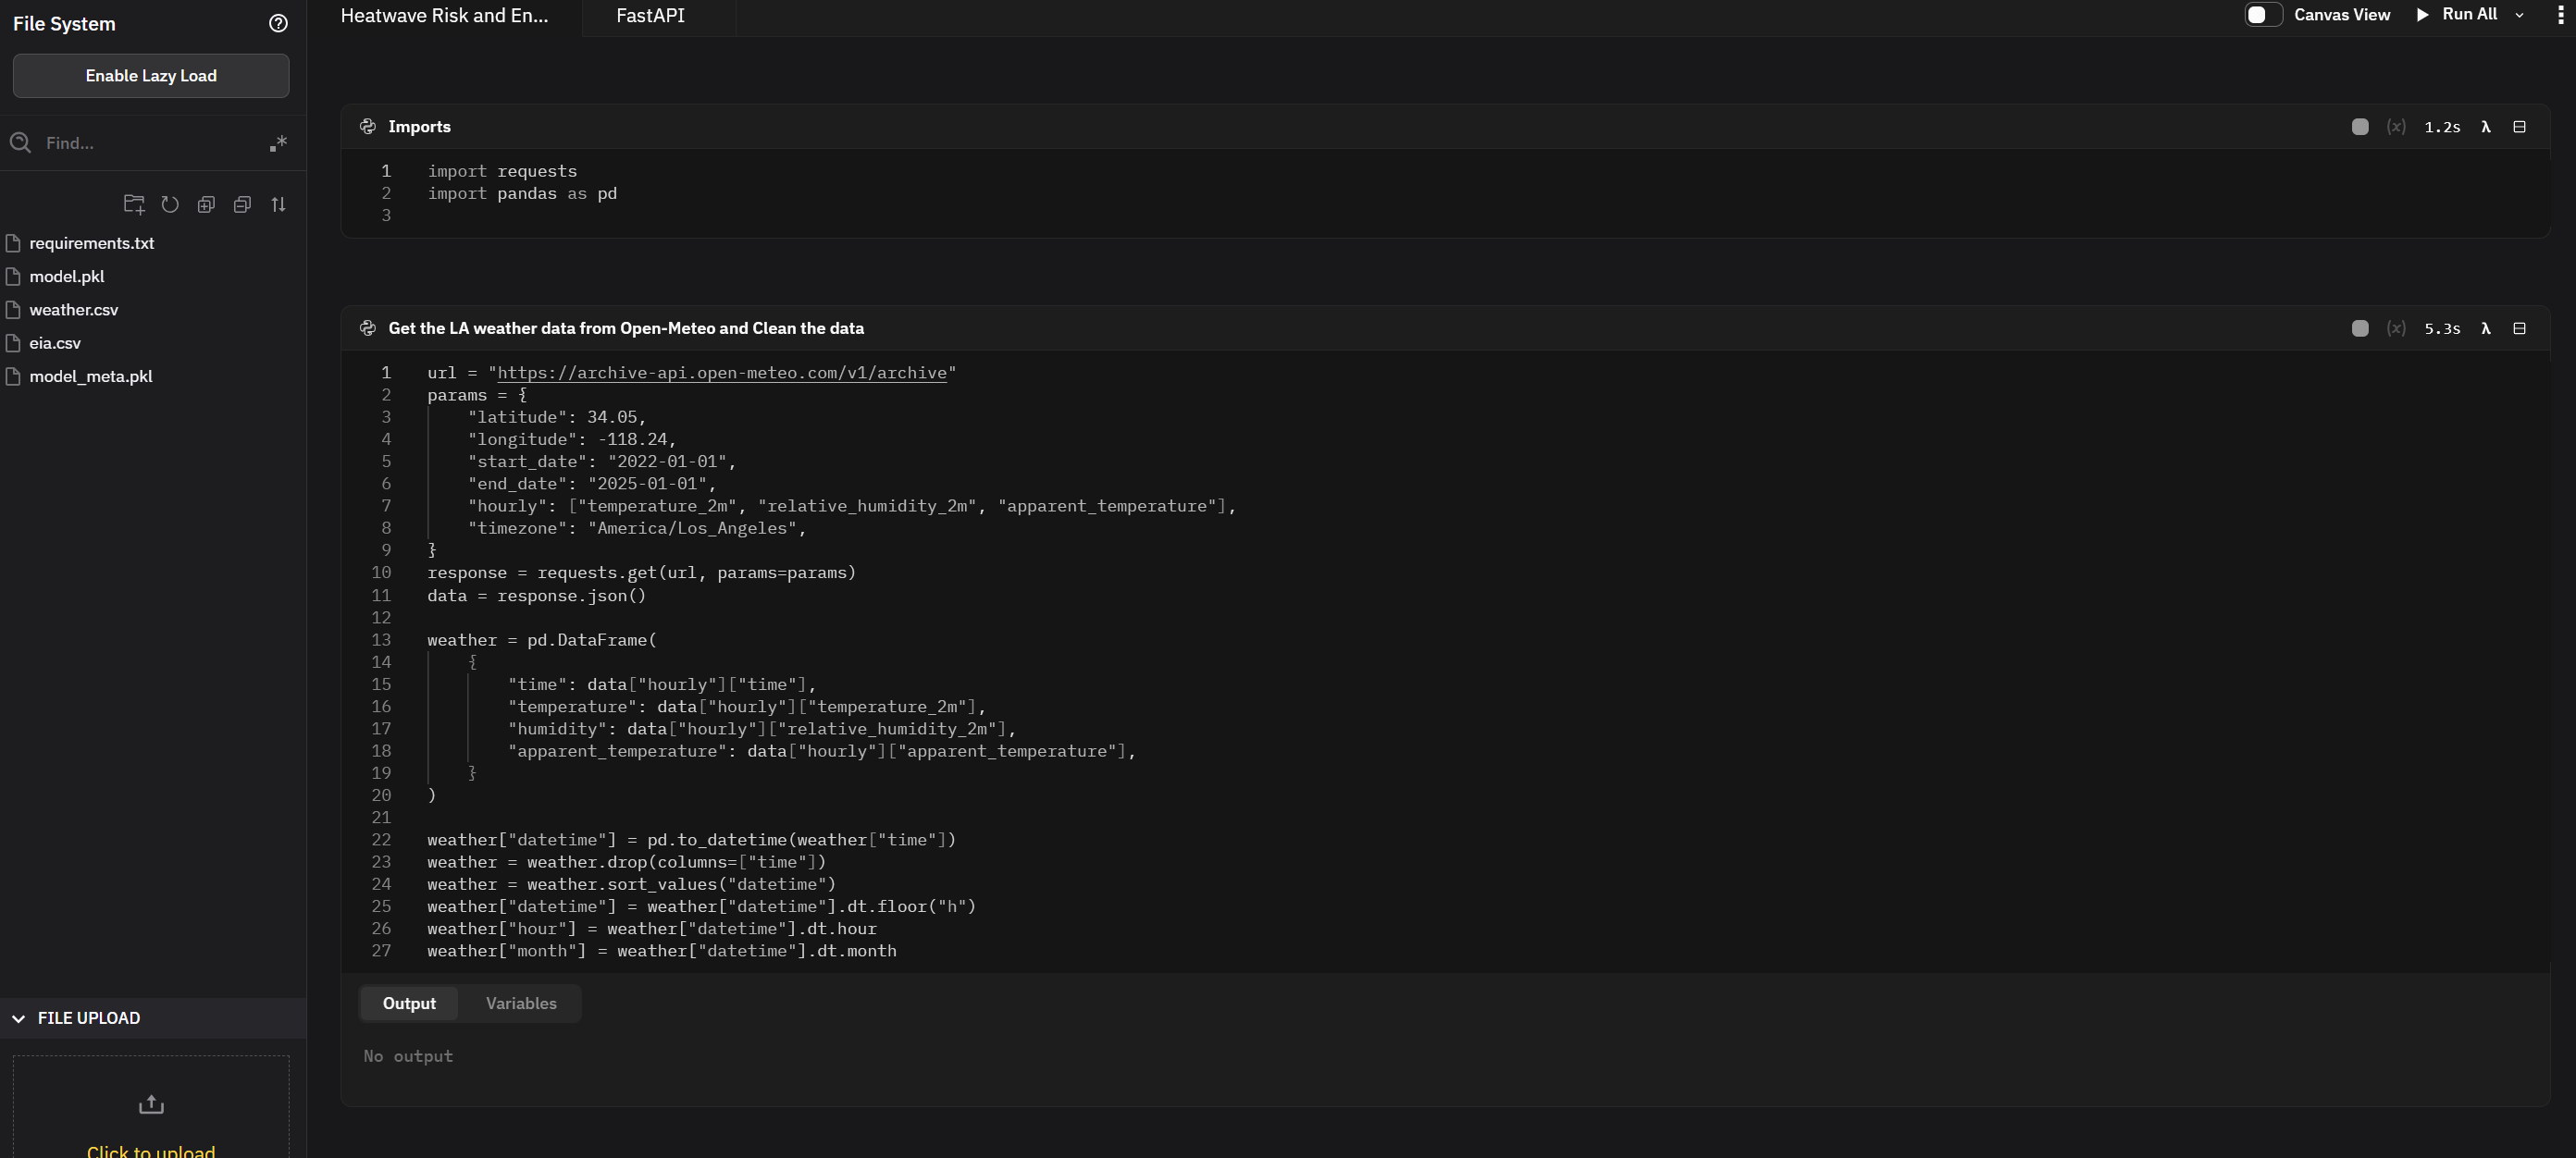
reading and merging datasets
-
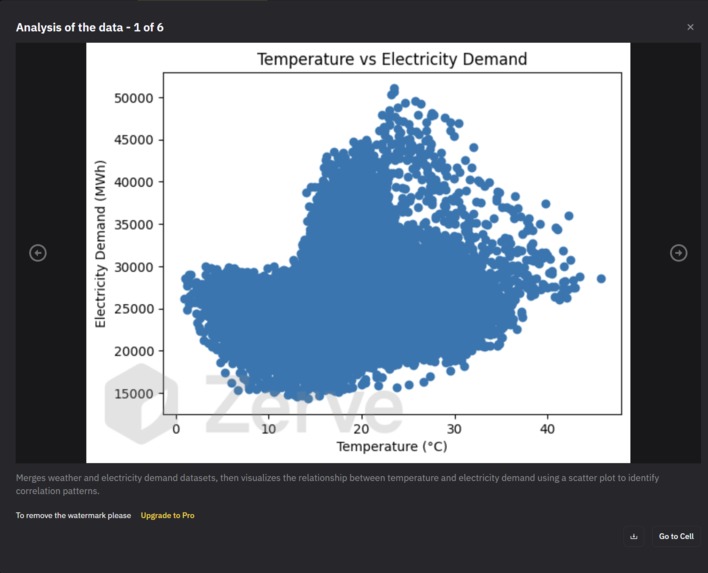
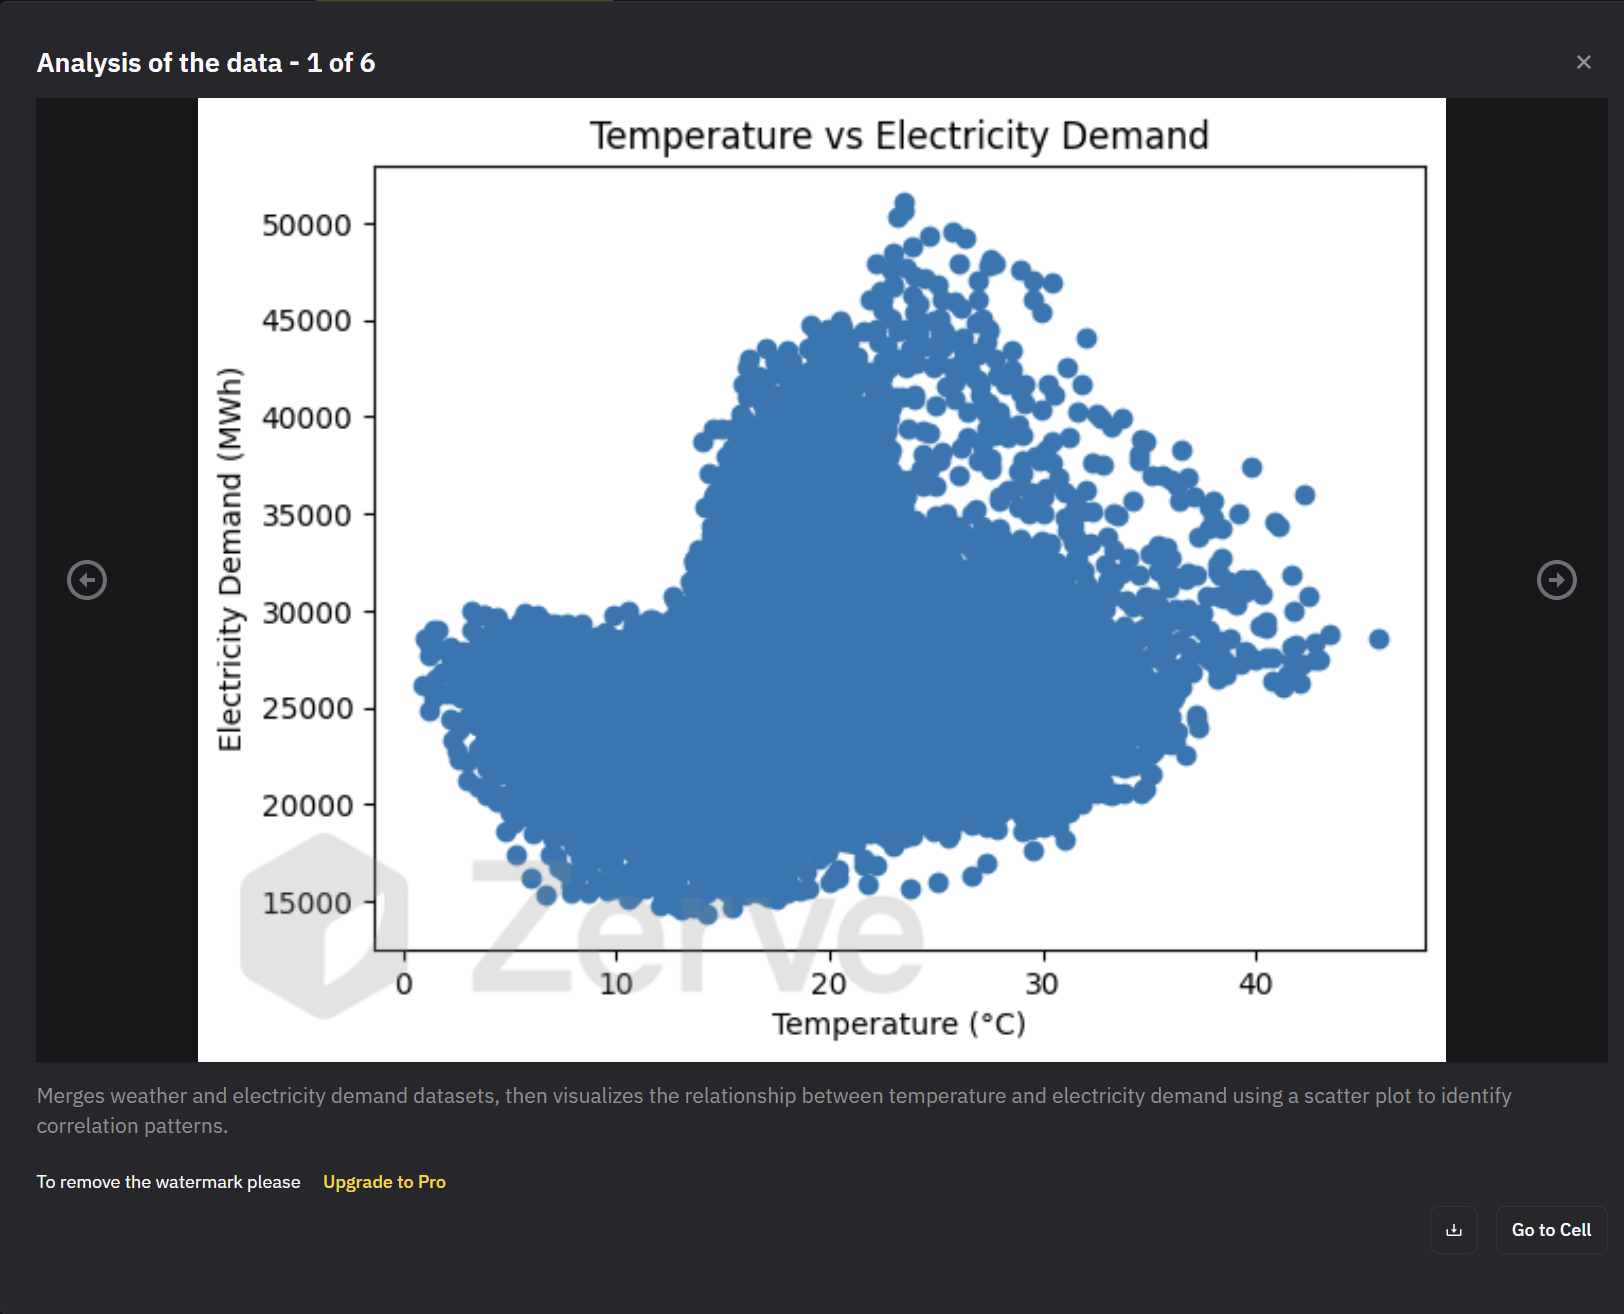
temperature vs energy demand
-
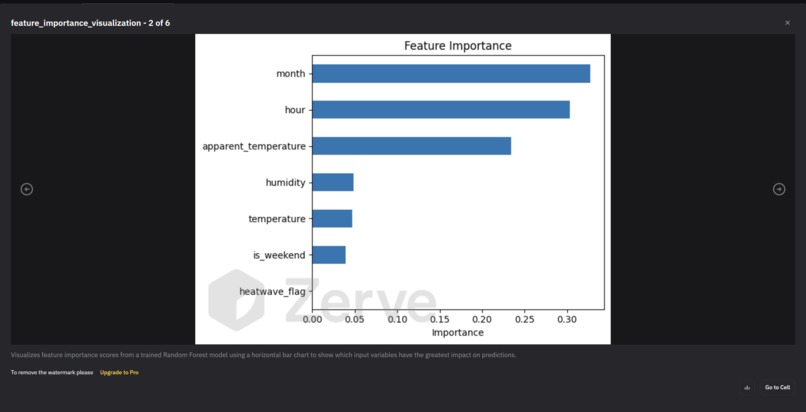
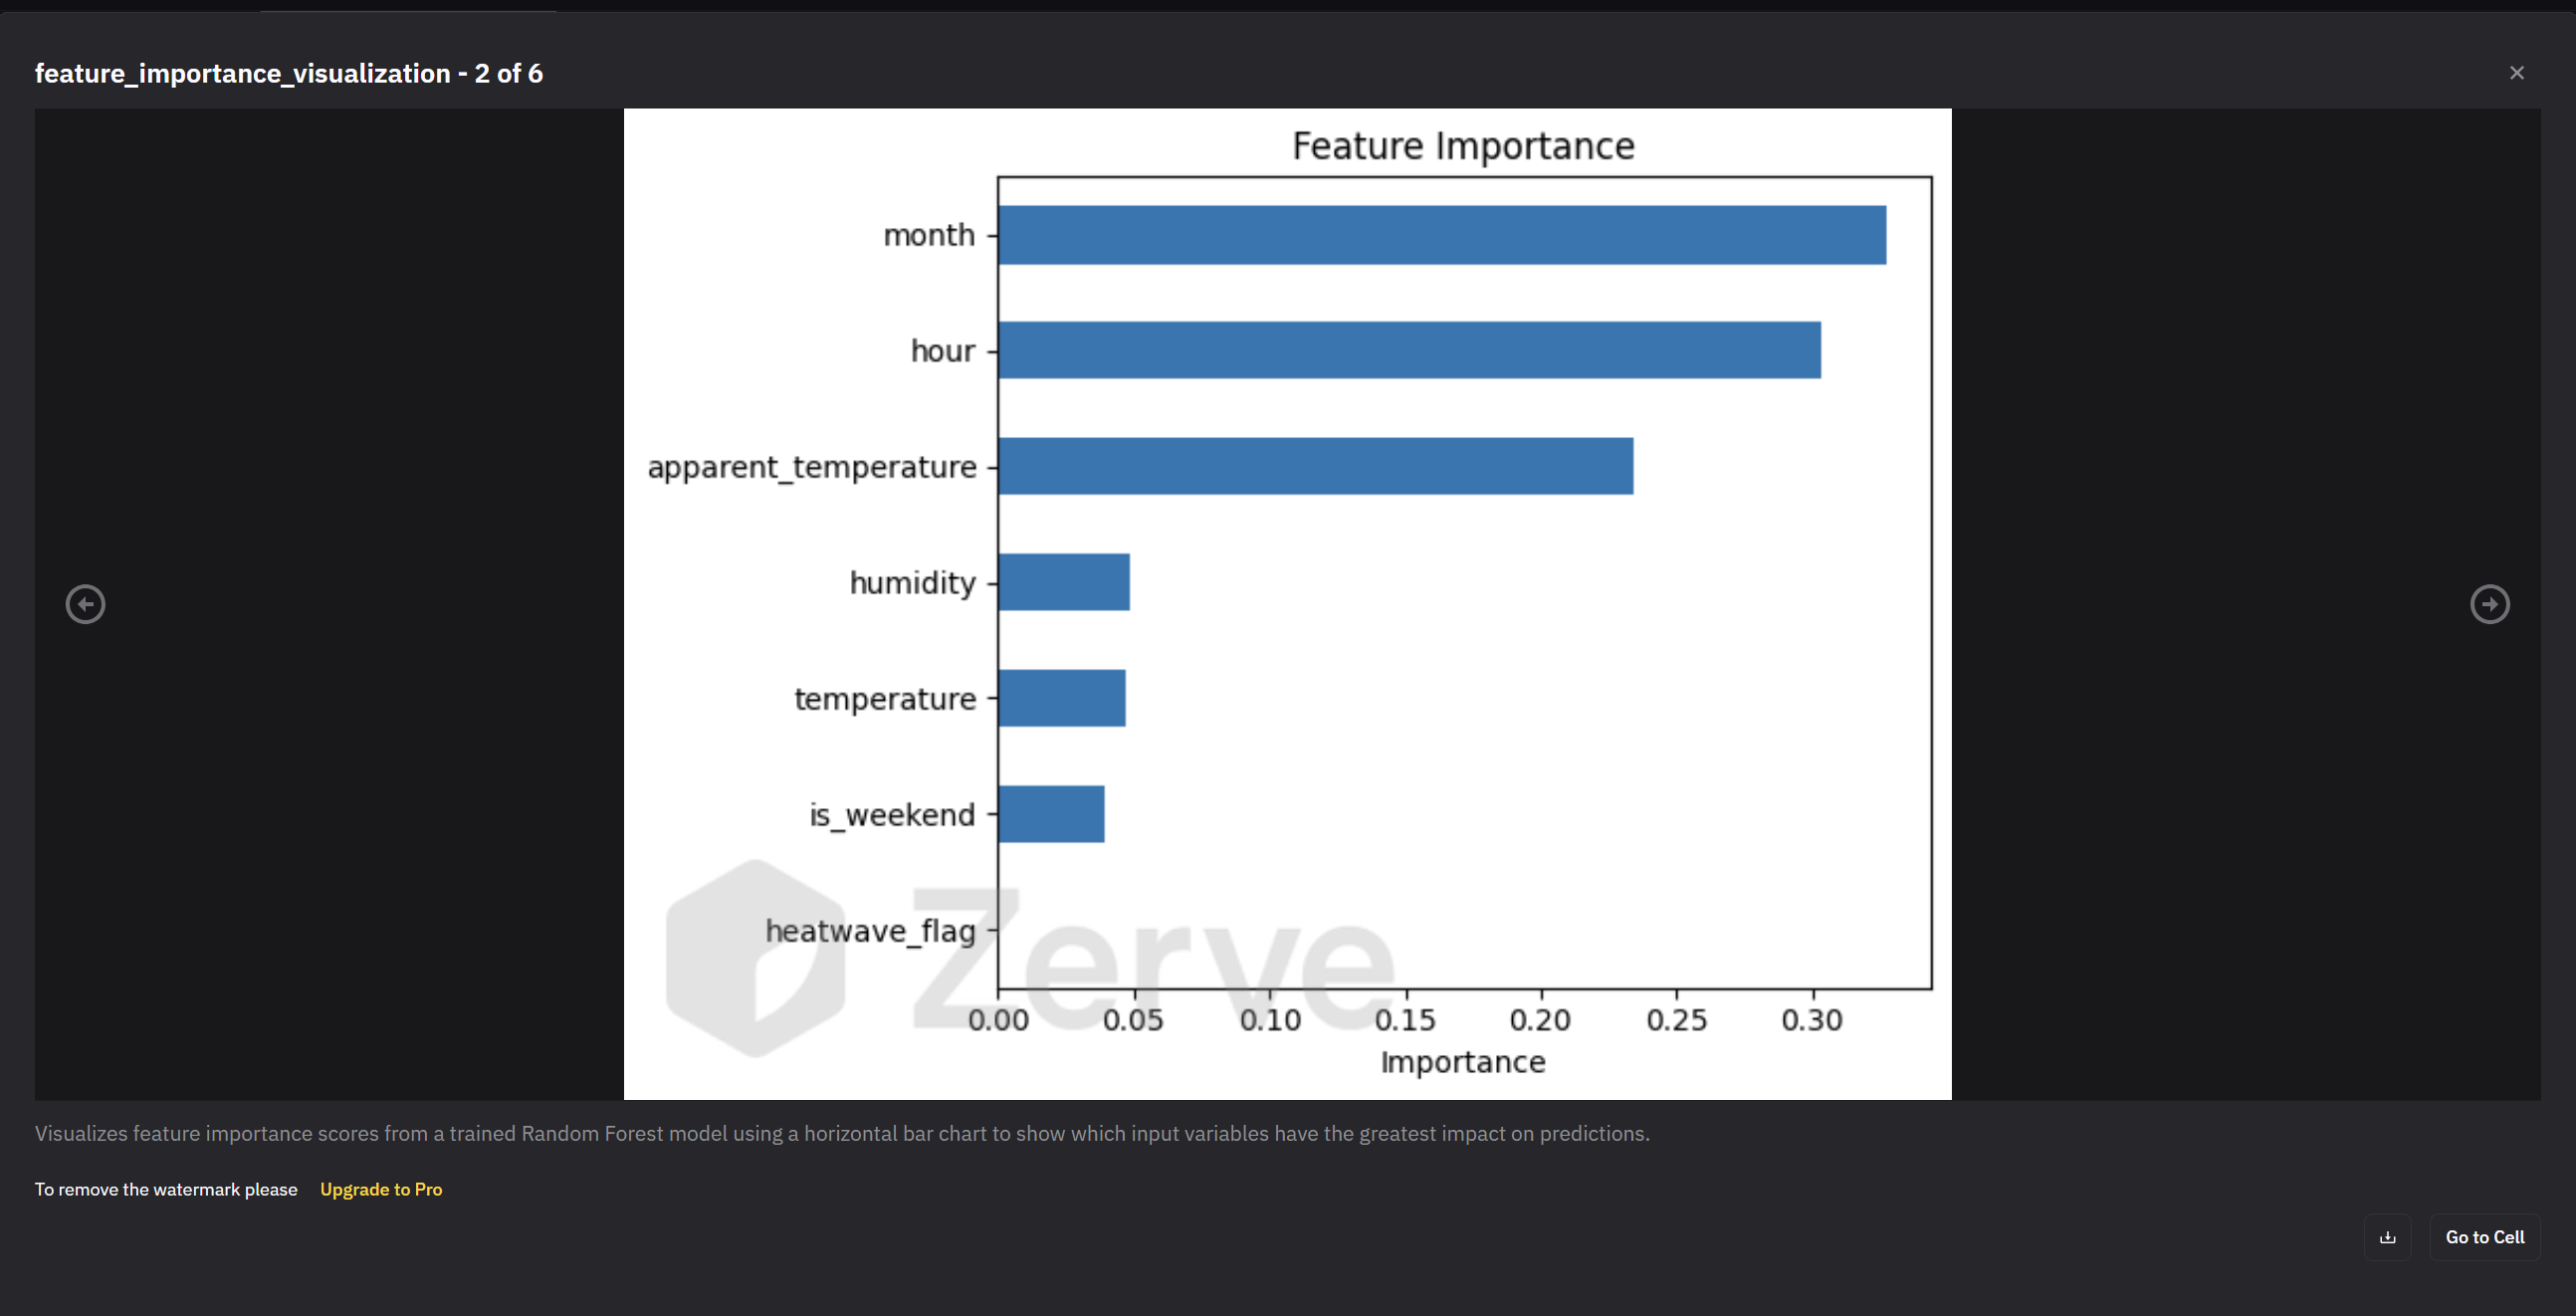
feature importance
Inspiration
As heatwaves become more frequent and intense, electricity grids face growing pressure from spikes in air conditioning demand. We were inspired by the question:
Can historical weather data help predict when heatwaves will push electricity demand into dangerous territory?
We wanted to build something that not only forecasted demand, but also translated those predictions into an interpretable risk signal that could support grid resilience.
What it does
Heatwave Energy Demand Predictor forecasts electricity demand spikes during extreme heat using historical weather and grid demand data. It predicts hourly electricity demand and classifies periods into Low, Medium, or High risk based on grid stress levels. The project helps identify when heatwaves may push demand into dangerous territory, supporting more proactive energy planning.
How we built it
We combined hourly weather data from Open-Meteo (temperature, humidity, apparent temperature) with hourly CAISO electricity demand data from EIA, covering 2022–2025.
After merging the datasets by timestamp, we performed exploratory analysis through visualizations, including temperature-demand relationships, demand by hour, heatwave comparisons, and correlation analysis.
We then trained a Random Forest Regressor using seven engineered features:
- Temperature
- Humidity
- Apparent temperature
- Hour of day
- Month
- Heatwave indicator
- Weekend flag
Finally, we added a risk classification layer based on demand percentiles to make the output more interpretable.
Why It Matters
As climate extremes increase, proactive forecasting can help utilities anticipate stress before outages happen.
This project shows how data science and machine learning can contribute to smarter energy planning and climate resilience.
Challenges we ran into
One major challenge was handling timestamps and timezone alignment, especially interpreting hourly demand peaks correctly.
Another challenge was that simple correlations between weather variables and demand were weak, making feature engineering and model selection important.
We also worked through balancing predictive performance with interpretability, which led us to include feature importance analysis and the risk-level framework.
Accomplishments that we're proud of
- Building an end-to-end predictive workflow from raw data to risk forecasting
- Discovering that time-of-day and seasonal effects were stronger predictors than temperature alone
- Turning regression outputs into a practical grid risk classification system
- Creating a project that connects machine learning with a real climate resilience problem
What we learned
We learned that electricity demand under extreme weather is driven by nonlinear interactions, not single variables alone.
We also gained experience in:
- Time series feature engineering
- Demand forecasting with machine learning
- Translating model outputs into decision-support tools
- Using data storytelling and visualization to surface insights
What's next for Heatwave Energy Demand Predictor
Future improvements could include:
- Incorporating more weather variables (wind, solar radiation, wildfire smoke)
- Adding multi-region forecasting beyond California
- Testing advanced forecasting models such as XGBoost or LSTMs
- Integrating real-time data feeds for live demand risk monitoring
- Expanding the tool into an early-warning dashboard for utilities and policymakers
Built With
- api
- jupyter-notebook
- jupyternotebook
- machine-learning
- matplotlib
- numpy
- pandas
- python
- random-forest-regressor
- randomforestregressor
- scikit-learn
- seaborn
- zerveai

Log in or sign up for Devpost to join the conversation.