-

High Performance - light theme
-

Weather Map Example
-
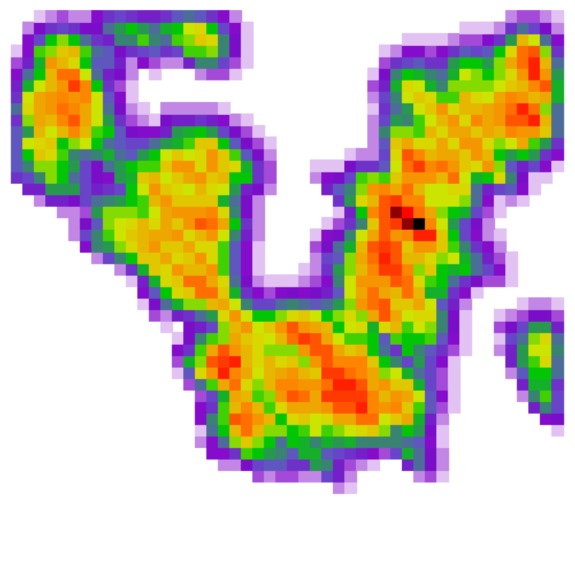
Low Performance - light theme
-

High Performance - dark theme


Inspiration
My background and main interests are in computer graphics and data visualization, so I wanted to create a solution in these areas. I am from Montana, and I live in Miami, both of which have fairly extreme weather events. It was this idea about weather that helped me think about a heat map.
What it does
HeatMap.js is a front-end javascript library that can generate smooth heat maps from a discrete 2D array of numbers. This is done efficiently (on load), on the client machine. For less powerful client computers, the algorithm can be tuned to run faster with small compromises to the resulting heat map.
Heat maps generated by HeatMap.js require very little storage, as an array of integers takes much less space than an image of similar quality. As such, they can be loaded by client machines that have very slow internet connections in a small amount of time.
The algorithm that transforms the array into a smooth image treats each value in the array as a coefficient of a 3D bell curve. The function that generates the color of a pixel in the heat map is the sum of the bell curves in the vicinity of the pixel. The algorithm is the most important part of this project, as it allows something that typically takes a very long time to generate to generate in O(pixels) time and O(1) space.
How I built it
I built this library using javascript, and p5.js. p5.js is an open-source and lightweight javascript graphics library. While the codebase for this library is fairly small, the algorithm was very difficult to create, and most of the time was spent on small optimizations, as the goal was to create something that can run client-side. The algorithm is the real MVP here.
Challenges I ran into
The challenge was to do something that typically takes a long time (generating heat maps) in a much smaller amount of time. Typically, it is only viable to pre-generate heat maps and then load them as an image on a website. That was something that I wanted to avoid, as it increases the amount of data that needs to be stored on a server, and could make websites load slower for people with slower internet connections.
Accomplishments that I'm proud of
Not only did I get this library working, I even put in features that allow users to tune the resolution, in case the heat map is very large, or to accommodate users with slow processors on their computers (e.g., smartphones).
What I learned
I got some more experience with javascript. Javascript is a very slow language inherently, so if you can do something that typically requires a high performance programming language with it, it feels like a serious accomplishment.
What's next for HeatMap.js
There are more optimizations that I can make to shave off a small fraction of the runtime. Most of the major optimizations have already been made, however.
Built With
- javascript
- p5.js

Log in or sign up for Devpost to join the conversation.