Inspiration
On a hot summer day, I opened the weather app, and noticed there was a heat advisory. I decided to go skateboarding with a friend outside, causing my parents to be concerned, and ensure I was well prepared. Even hours later, however, I hadn't felt any differently than I do on a typical summer day -- why? I had skateboarded under an expanse of trees the entire duration, and never experienced any direct sunlight. My father, however, decided to mow the lawn, and came inside exhausted, an experience directly opposite to mine. Resulting from this, I realized that there's a major flaw in weather app detection regarding temperature advisories, and there aren't investigated methods to reduce temperature related risk. A single temperature or heat advisory doesn't have any relevance in terms of heat exposure, depending on nearby materials, sunlight levels, humidity, forestry, etc. Weather alerts give info on dangerous heat, but not what locations specifically, and what can be done to reduce this risk. This is what gave way to HeatLens's creation.
What it does
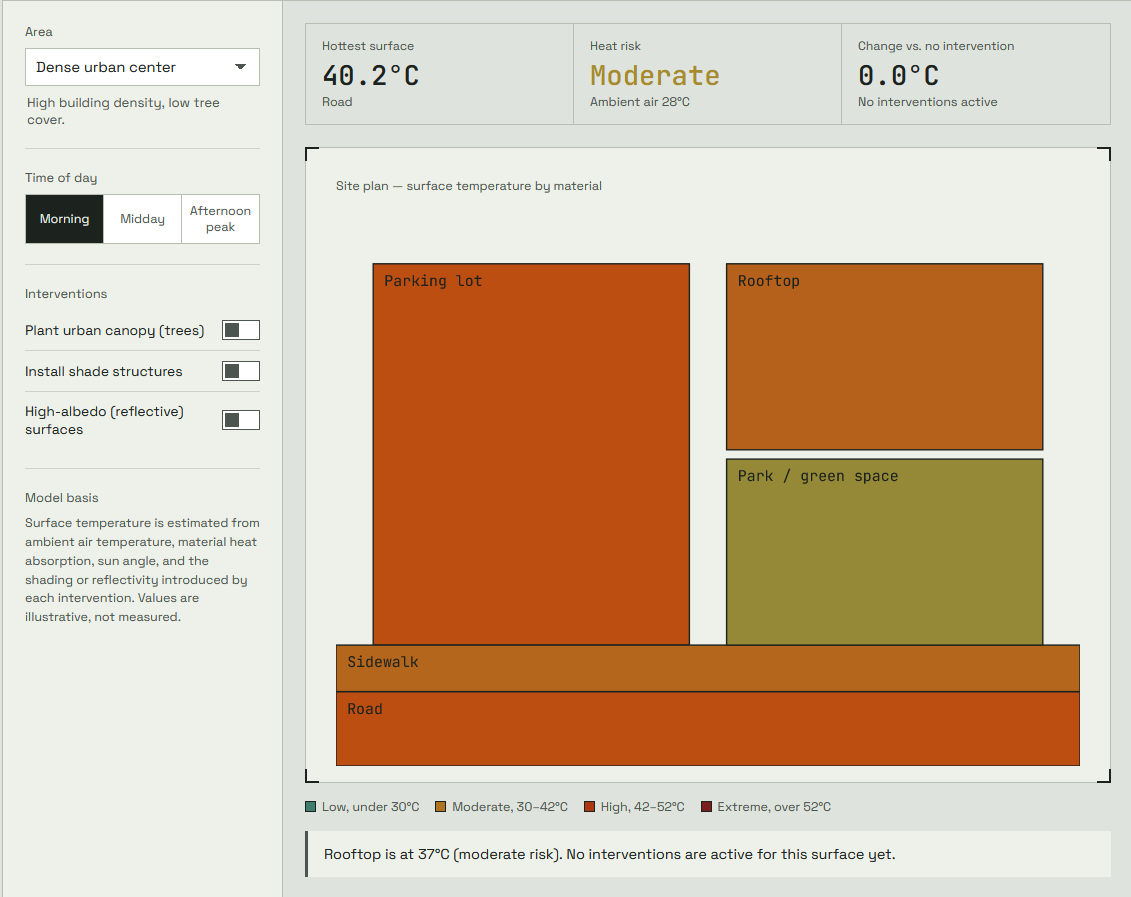
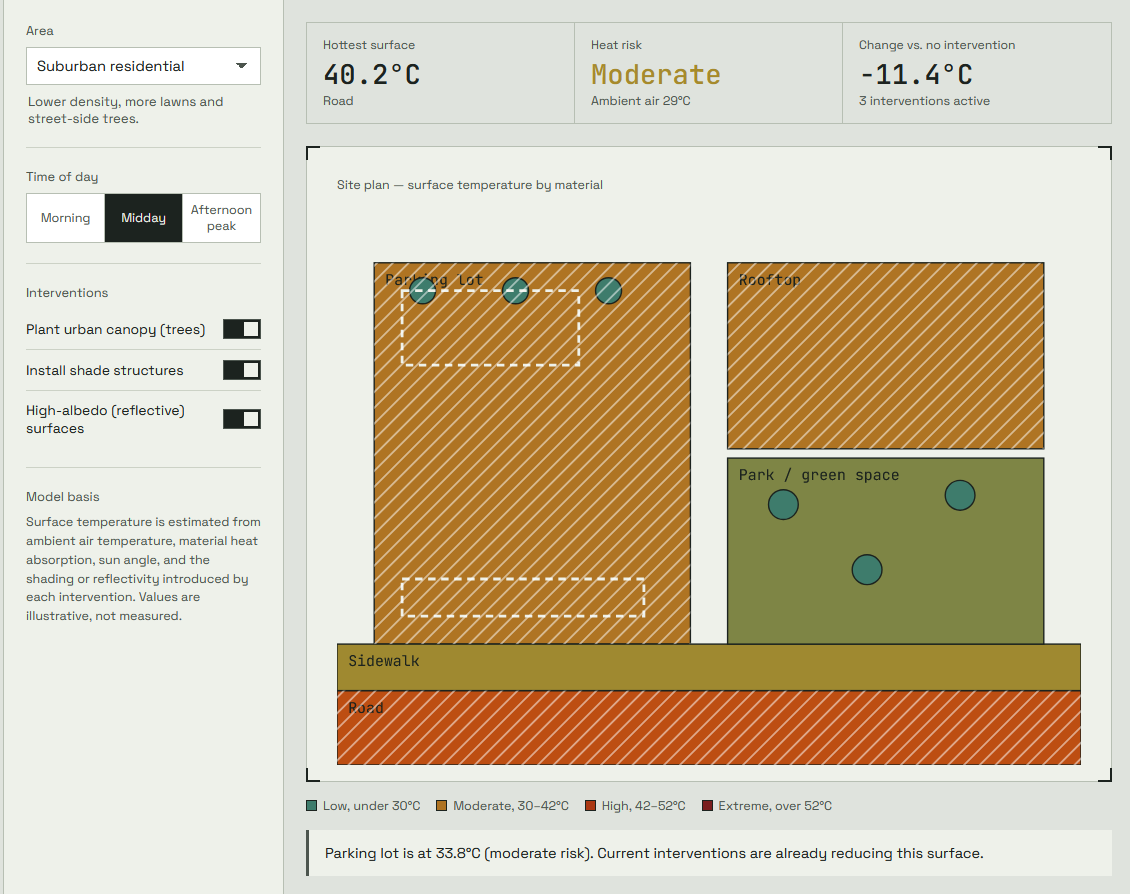
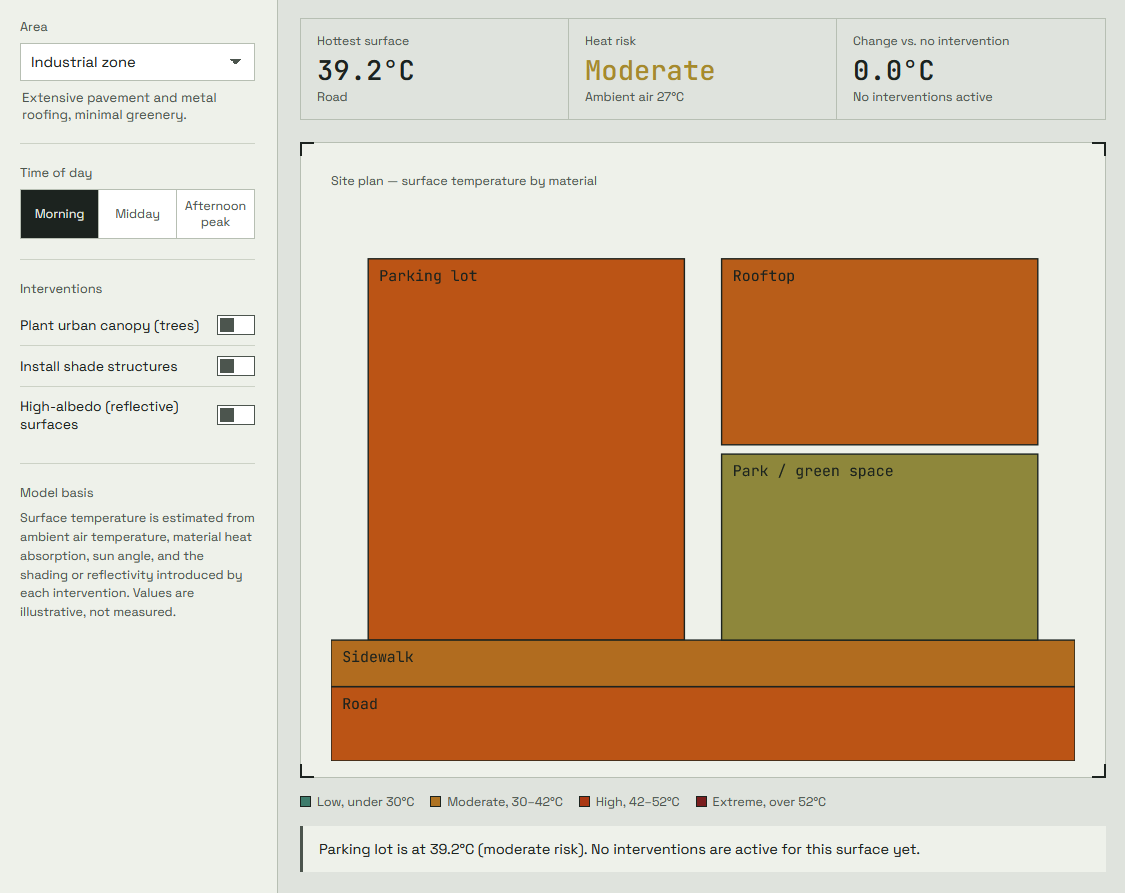
HeatLens takes broader heat warnings into local information available to all, alongside providing intervention methods. Further details are given, regarding the most dangerous, and most safe locations, depending on various conditions. HeatLens uses satellite imagery, weather data, environmental elements, physics-modeling, and artifical intelligence to estimate local heat risk. Instead of simply stating temperature, HeatLens will identify areas such as parking lots, sidewalks, parks, and more, which may experience a wide variety of thermal conditions. The intervention simulator allows for users to test various solutions, such as higher forestry, shade structures, and reflective surfaces being implemented, demonstrating the impact on modeled heat risk.
How we built it
HeatLens is a physics-based decision system, relying on more than simple artificial intelligence. The proposed project combines satellite imagery to cover land/vegetation levels, weather data for temperature, humidity, etc. surface details, such as material of ground, building data to estimate shade and heat retention, physics-modeling to represent local heat influenced by environment, machine learnign to identify patterns in temperature and location, improving predictions, as well as GIS-based visuals to create an intuitive heat-risk map as a result.
Challenges we ran into
One of the largest challenges of this project is balancing scientific accuracy with plausible implementation. Heat exposure has many elements to it, which is exactly what weather apps do not cover. A simple temperature cannot capture each element of heat exposure, so the most important factors had to be determined to calculate heat risk, while also keeping the project realistic. Another challenge is the use of data, as the prototype simulation uses simulated data, which does not have real ties to genuine, scientific, applicable data.
Accomplishments that we're proud of
I'm proud of the simulation aspect, as it provides insight into the prototypes of an innovative project. Furthermore, the premise of the project itself is one I am proud of, as HeatLens does not simply identify heat exposure, but also gives methods for reducing risk. HeatLens is a project I have not previously seen explored, improving the readability of daily weather in the common eye.
What we learned
I learned that solving real-world problems doesn't always require excessively complicated technology or data, but identifying a problem that isn't being currently solved or covered. Furthermore, I learned about the various scientific connections required for this project, including the usage of physics, environmental science, satellite technology, AI, GIS, urban planning, etc.
What's next for HeatLens
The first step I would implement is replacing simulated data with real, available environmental data as well as using satellite information. Then, HeatLens's testing could be validated, and further improved for real world usage. Future versions of the project may also include further details or elements, such as neighborhood heat maps, heat risk predictions over the course of a full day, scales of certainty, etc.
Crediting
Image for this project upload comes from Pixabay, featuring a royalty free vector. Link below if interested, or necessary. https://pixabay.com/vectors/sun-ray-shine-307189/
Built With
- css3
- gis
- github
- html5
- javascript
- machine-learning
- physics
- satellite


Log in or sign up for Devpost to join the conversation.