Description
The goal of this project is to provide a website which displays the data located at chillingeffects.org in visual form. The goal is achieved by harvesting chillingeffects.org via a harvester which is queued up by a discovery worker. Both are designed to run on iron.io as workers, but they can run anywhere. The harvested data is aggregated and displayed on the webserver.
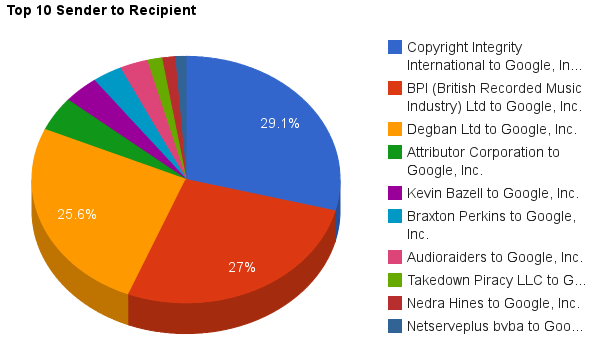
I had to strip away most of what I wanted to do because I got sick on Friday. Which is why the webserver only displays one kind of aggregated data and doesn't allow any customized visual representation of the data by the user. It's not a final product. It's more a prototype. The data in the chart image is based on the notices from 1 to 1000. It does not represent every notice stored at chillingeffects.org because I the web API has limited access without an API key.
The heatingeffects project contains the following go packages:
- harvester
- discovery
- common
- webserver
- chillingeffects
chillingeffects
Go API for chillingeffects.org. Contains only one required function (RequestNotices) to get a notice via an ID.
harvester
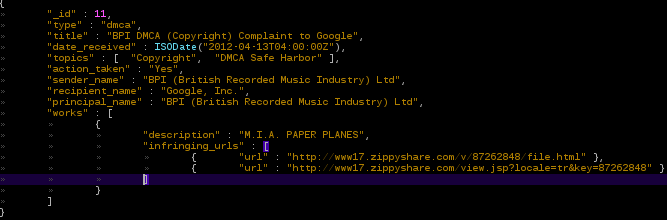
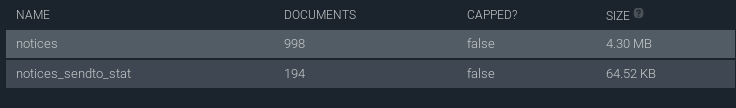
Fetches notices from chillingeffects.org and inserts them into a MongoDB database.
discovery
Discovery querys the database for the latest harvested notice ID. It gets https://chillingeffects.org/ to extract the latest notice ID. With the latest harvested and extracted ID it queues up taks on iron.io. The amount of notices each worker (harvester) has to fetch is based on a configuration value.
webserver
Displays one web page under ":9000/" which displays the top ten sender to recipient, sorted by notices.
common
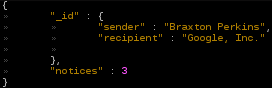
Contains config, database schema and aggregation script.
Timeline
Saturday
Created the harvester and discovery worker.
Sunday
Most of the time got consumed by figuring out MongoDB's aggregation framework and mapreduce. The rest was spent on getting a minimal webserver running to display one chart.

Log in or sign up for Devpost to join the conversation.