-
-
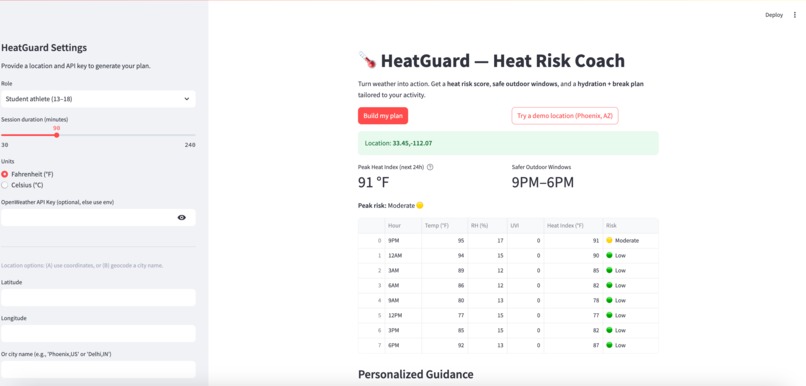
Image of UI
-
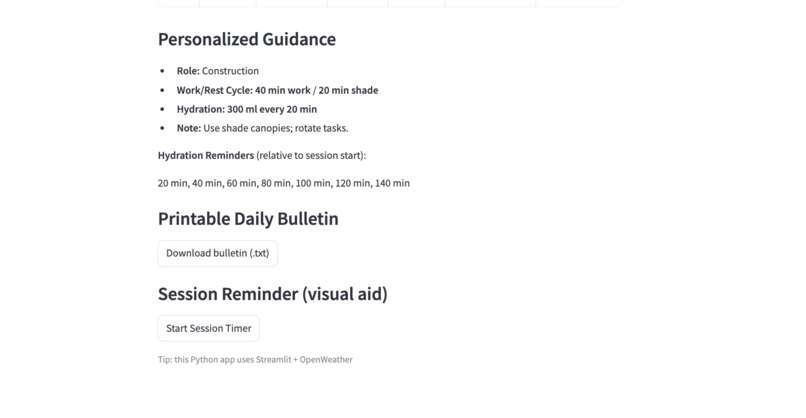
Image of UI
Inspiration
The idea for HeatGuard came from a personal experience. One summer afternoon, while volunteering at a local community event, my friend and I spent hours outside in the direct sun handing out supplies. There wasn’t much shade, and even though it didn’t seem too hot at first, the humidity and constant exposure added up. Suddenly, my friend fainted from heat exhaustion. It was terrifying, and it made me realize how quickly heat can become dangerous — especially when you don’t realize how high the risk really is. That moment stuck with me, and it inspired me to create a tool that could prevent situations like that from happening to anyone else.
What it does
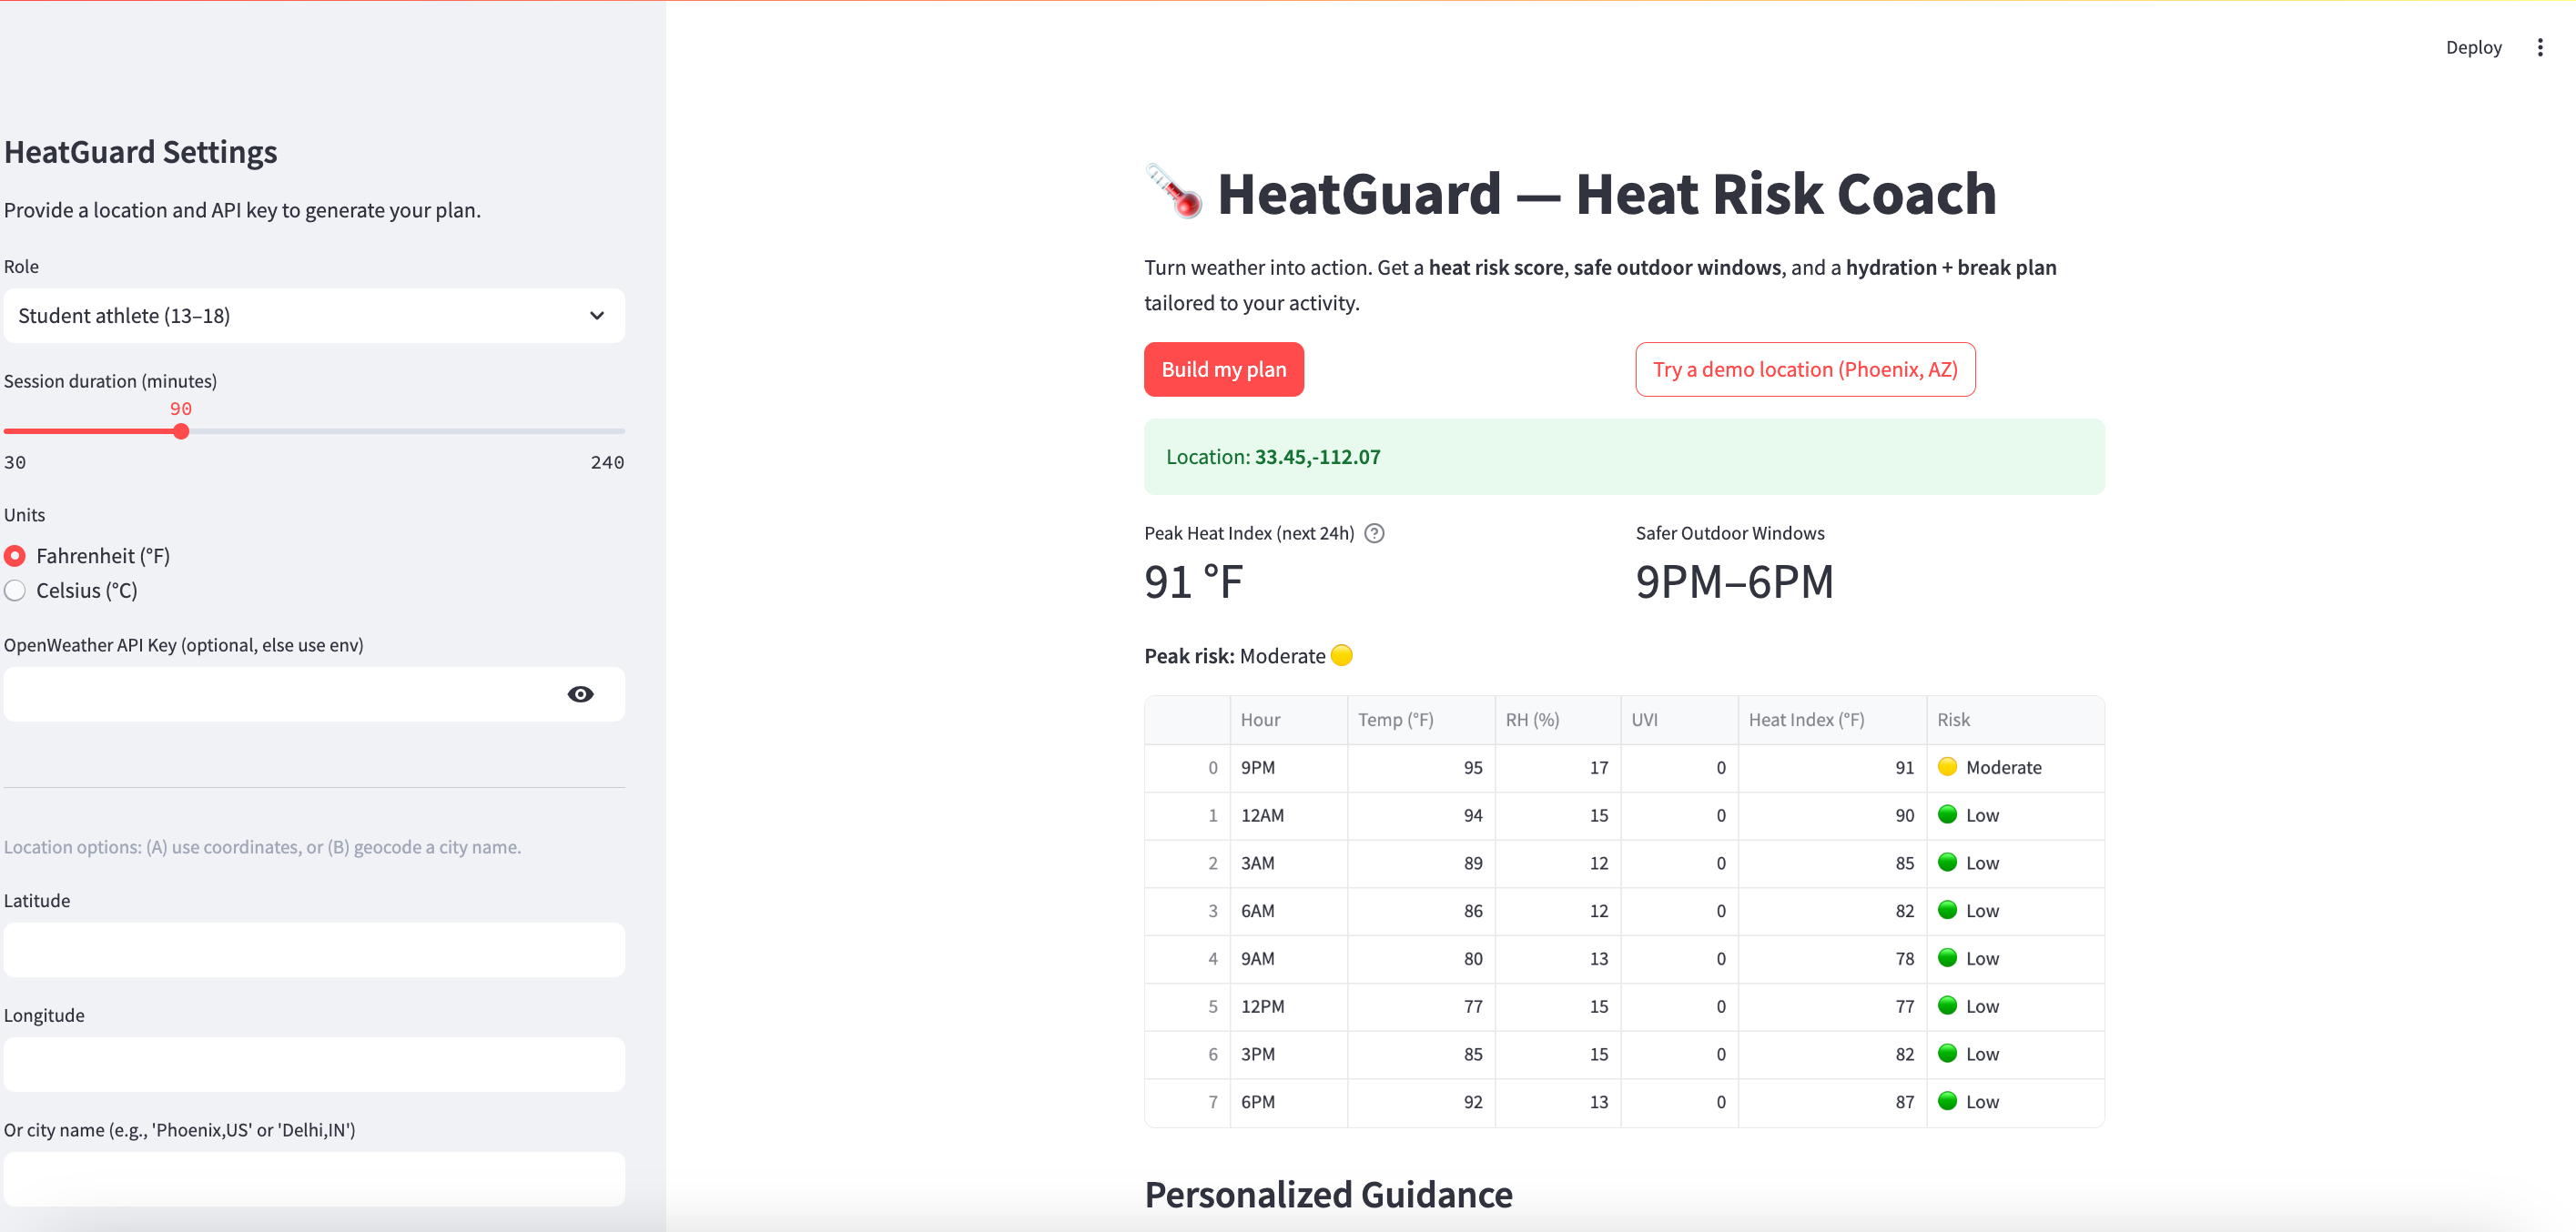
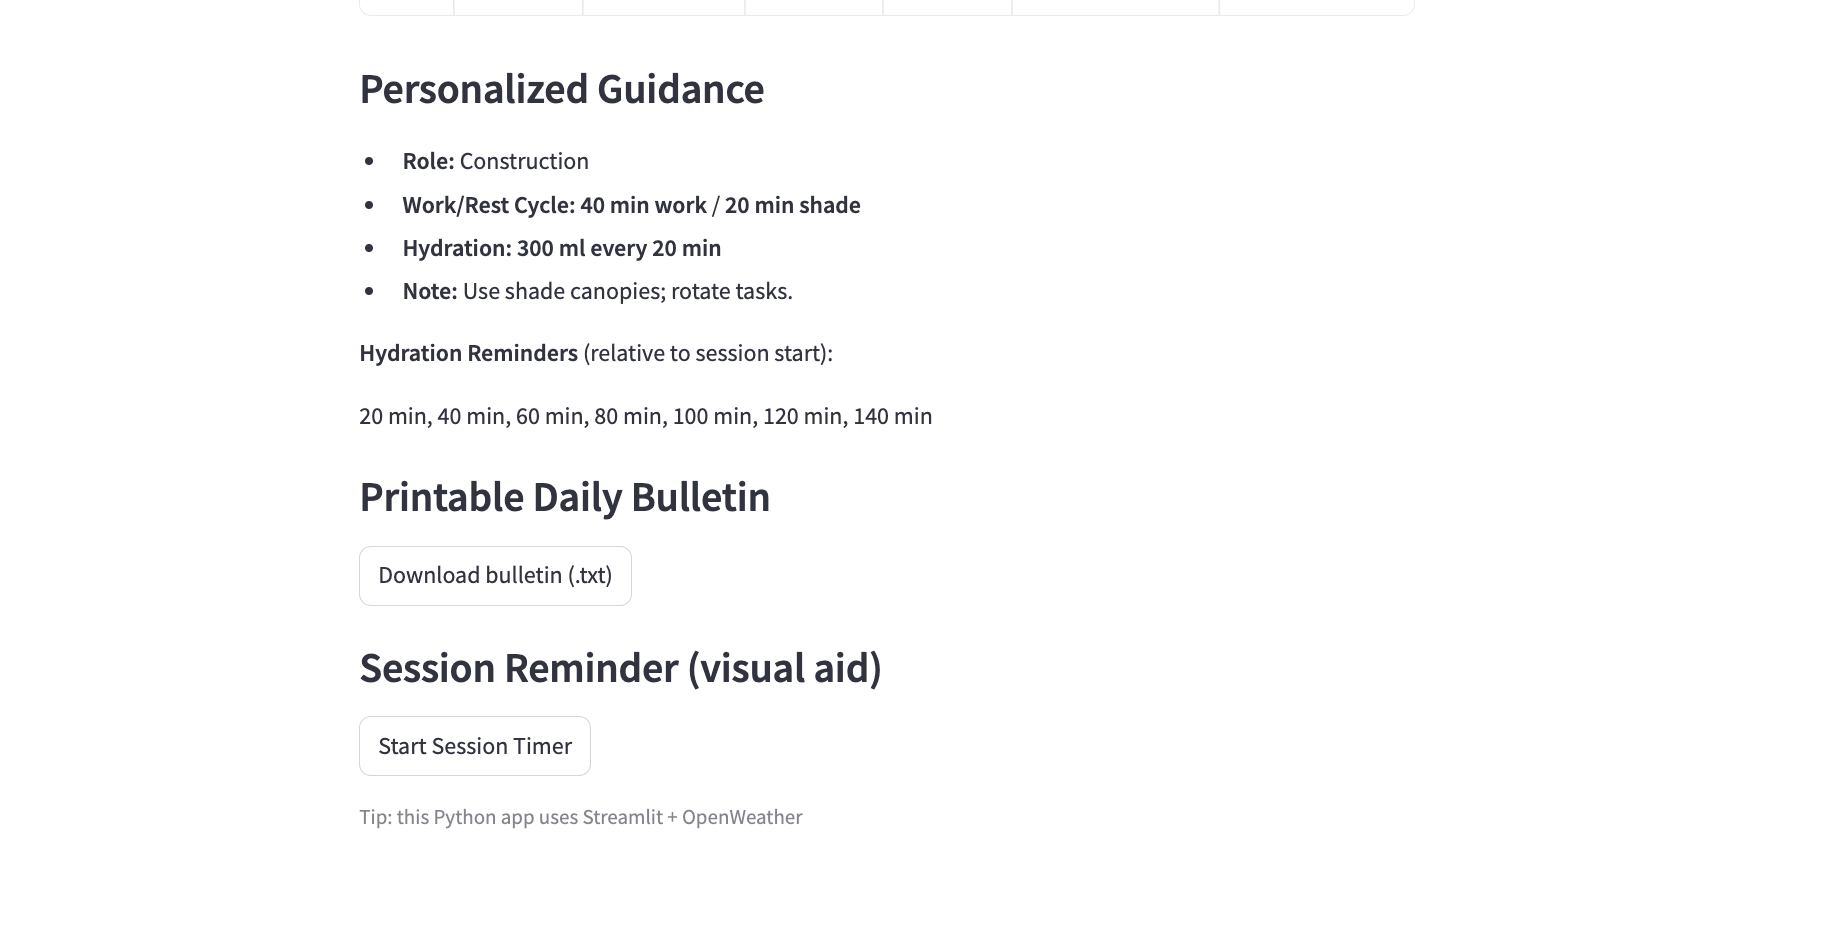
HeatGuard is a web app that helps people stay safe in extreme heat by turning real-time weather forecasts into personalized safety plans. It takes a city or coordinate location, retrieves the upcoming weather data, and calculates the Heat Index using temperature and humidity. Based on this, it identifies the level of heat risk (Low, Moderate, High, or Extreme) throughout the day. Then, it creates a customized plan that includes safer outdoor time windows, work/rest cycle recommendations, hydration schedules, and safety notes tailored to the user’s role — like a student athlete, construction worker, or delivery courier. It also generates a downloadable daily bulletin and includes a built-in timer that reminds users when it’s time to hydrate during their session. In short, HeatGuard helps people know when it’s safe to go, and when it’s time to rest.
How we built it
I built HeatGuard entirely in Python using Streamlit to create an interactive web app that combines data analysis and user-friendly design. I started by using the OpenWeather Geocoding and Forecast APIs to retrieve location coordinates and 3-hour weather forecasts, which include temperature and humidity. I implemented the official NOAA Rothfusz regression formula to calculate the Heat Index for each time block, then mapped those values into risk levels ranging from Low to Extreme. I used this risk data to generate personalized guidance for different roles, including recommended work/rest cycles, hydration amounts, and safer outdoor time windows. To display everything cleanly, I used Pandas to structure the forecast data into tables and Streamlit’s layout tools to build the UI, with a session timer and hydration reminders for real-time use. I also set up environment variables with a .env file to keep the API key secure and excluded from GitHub. Throughout the process, I used Git and GitHub for version control to keep my project organized and shareable.
Challenges we ran into
One of the hardest challenges was adjusting my approach when the OpenWeather One Call API (which gives hourly data) started rejecting free-tier API keys. I had to revise the logic to use the 3-hour forecast endpoint instead, while keeping the risk classification just as accurate. Another challenge was dealing with time zones — the API returned timestamps in UTC, which made it tricky to display local hours cleanly for users.
Accomplishments that we're proud of
I’m proud that I was able to turn a personal experience into something that can actually help others. Seeing this project come together into a functional, interactive tool was something that made me really proud. I’m especially proud of the fact that HeatGuard doesn’t just display weather data — it interprets it into something meaningful, giving people actionable steps to stay safe. Turning complex calculations like the Heat Index into a simple and intuitive experience felt like a big achievement, and watching it work felt like proof that even a small idea can have real impact.
What we learned
Building HeatGuard taught me a lot about how to combine data with design to help people. I learned how to access and process real-time forecast data from public APIs, and how to calculate the Heat Index using the official NOAA Rothfusz regression formula. I discovered how to turn raw numbers into clear, human-centered guidance for different roles like student athletes, construction workers, and elderly people outdoors. I also learned about securely handling API keys through environment variables and .env files, as well as designing an intuitive interface using Streamlit.
What's next for HeatGuard
I want to make HeatGuard accessible on mobile so outdoor workers, students, and coaches can quickly check conditions on the go. I also plan to add automatic location detection, hourly UV forecasts, and real-time alerts that warn users before conditions become dangerous. In the long term, I want to partner with schools and community organizations to share this tool during heat waves and sports seasons. My goal is to make HeatGuard something people can rely on — a simple, everyday resource that quietly helps keep them safe.
Built With
- dotenv
- github
- openweatherforecastapi
- openweathermap
- pandas
- python
- streamlit


Log in or sign up for Devpost to join the conversation.