Inspiration
In 2021, a heat dome killed 619 British Columbians in five days. 98% died indoors. 80% had three or more chronic conditions. 56% lived alone. Every single one was known to the healthcare system, lived at a known address, in a neighborhood identifiable as a heat island. Nobody checked on them until it was too late. BC has the lowest air conditioning rate in Canada; only 32% of households.
In Vancouver, just 26%. Among BC renters, only 24%. Among racialized residents, under 18%. And even seniors who have AC often don't turn it on; a 35–42% spike in electricity bills forces them to choose between staying cool and buying medication. The current system is a city-wide broadcast. The same alert goes to a healthy 25-year-old with AC and an 82-year-old with heart failure in a heat island apartment.
There's no system connecting real-time heat data to individual health risk to caregiver action. We built HeatGuard to close that gap.
What does our solution do
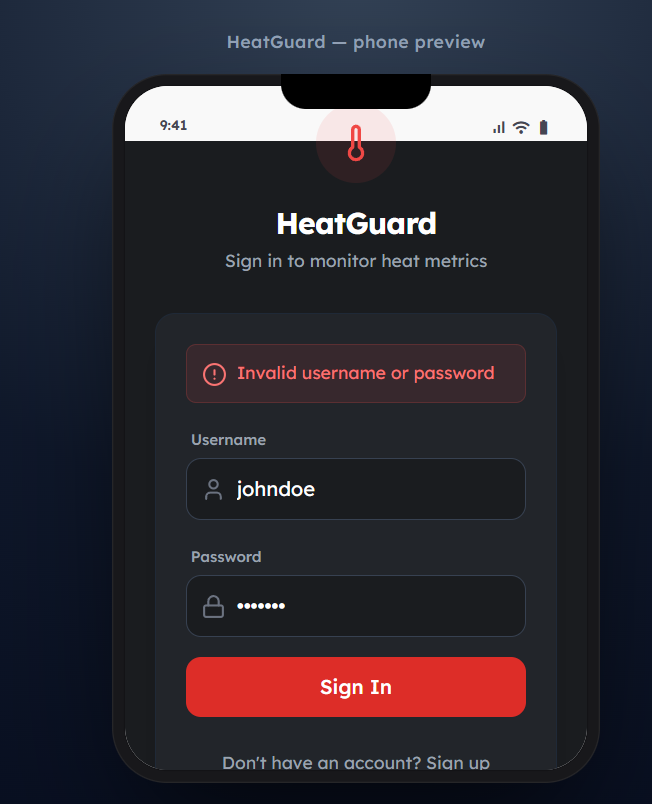
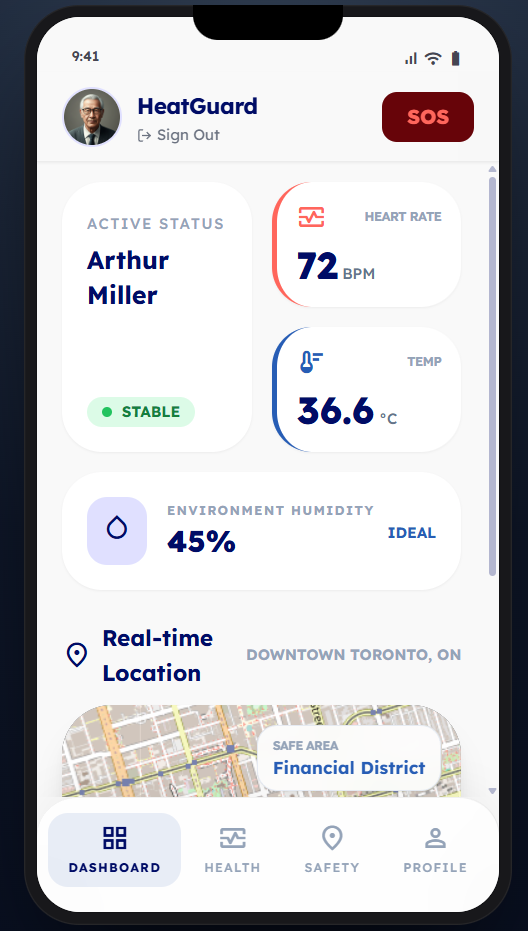
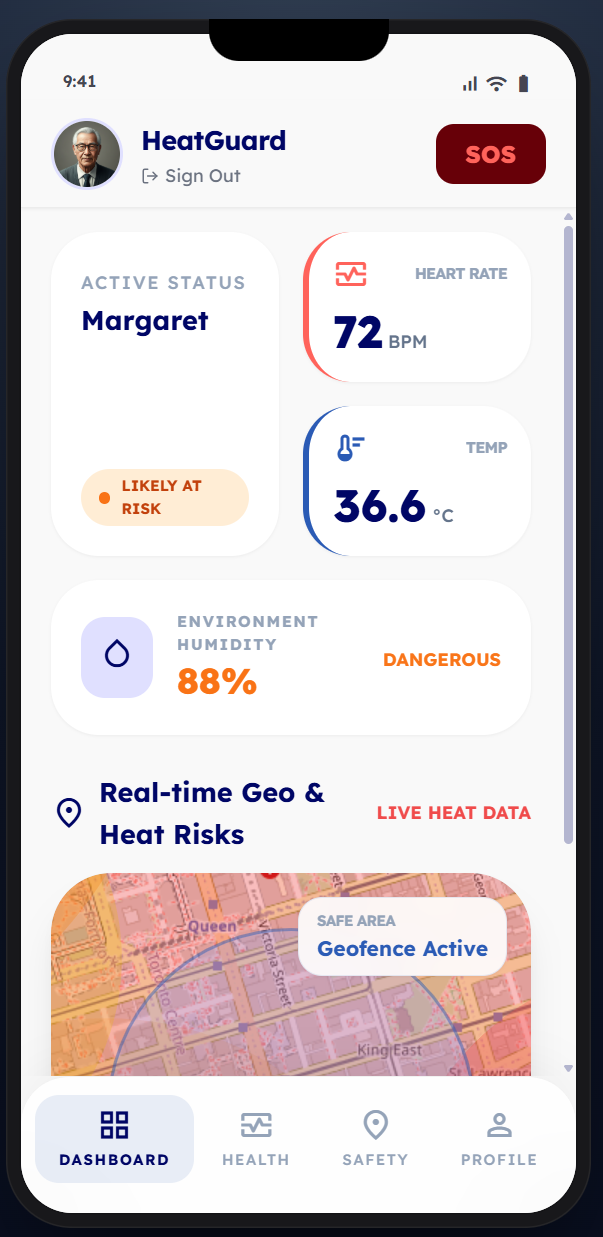
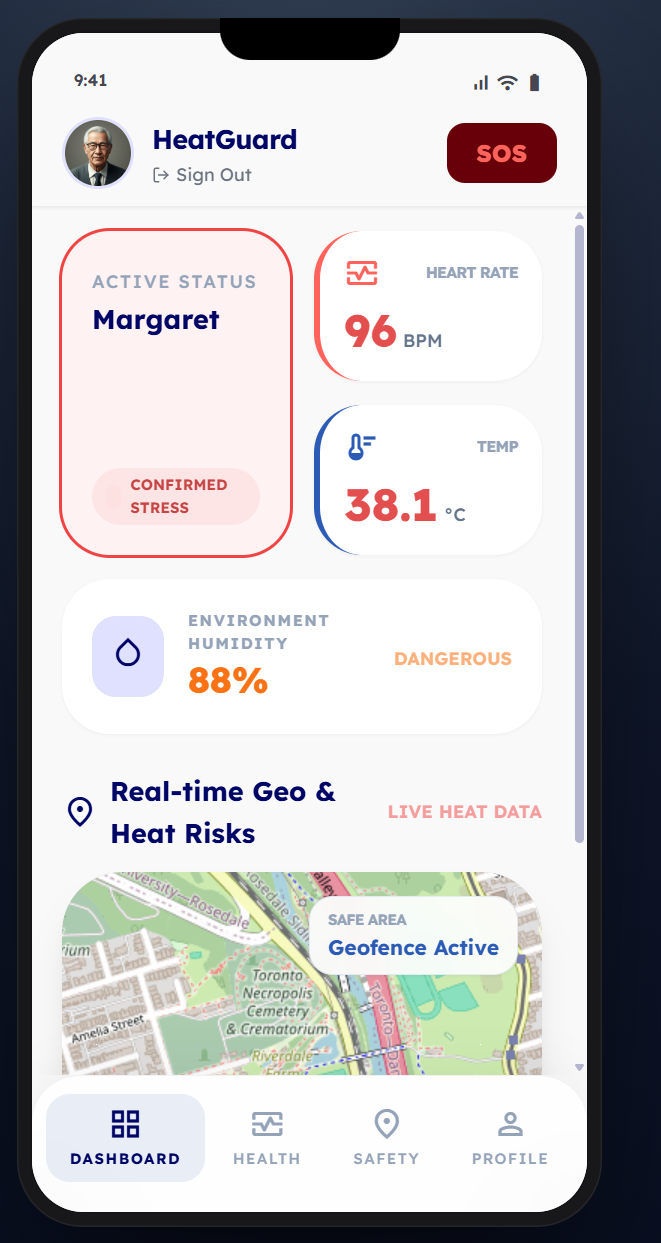
HeatGuard is a wearable-to-app platform that continuously monitors at-risk seniors through a wristband tracking real-time vitals, location, and hyperlocal heat conditions; automatically alerting caregivers when a vulnerable individual's heat exposure exceeds their personalized medical safety threshold.
Three layers working together:
Dynamic Heat Risk Map: Every city block gets a real-time Heat Danger Score combining urban heat island intensity (from satellite data and land surface features), live Environment Canada weather data, forecast trajectory, and time-of-day sun exposure. Updates continuously as conditions change.
Wearable Health Monitoring: The connected wristband tracks heart rate and activity level. These physiological signals confirm heat stress directly; a rising heart rate while stationary is a textbook early sign of heat exhaustion. The wearable also provides ground-truth ambient temperature at the person's actual location, closing the gap between outdoor model estimates and indoor reality.
Proactive Alert Engine: Continuously cross-references environmental danger with physiological signals against the person's individualized risk threshold (adjusted for their specific conditions; cardiovascular disease, COPD, diabetes, medications affecting thermoregulation). When cumulative exposure exceeds their threshold, it triggers a graduated cascade:
Level 1 → Notification to the individual: hydration reminder, cooling center directions, symptom checklist Level 2 → Alert to their PSW/caregiver with vitals, location, risk score, and recommended action Level 3 → Escalation to emergency contacts if no caregiver response
The duration component is critical. 33°C for 20 minutes is uncomfortable. 33°C for 4 hours without AC for someone with heart disease is life-threatening. HeatGuard tracks cumulative exposure, not just instantaneous temperature.
How we built it
Data Pipeline — Downloaded UHI baseline data using Landsat 8 thermal imagery and municipal 3D building massing data. Calculated per-block features (impervious surface %, tree canopy, building geometry) using OpenStreetMap. Integrated Environment Canada weather API for real-time temperature. Structured everything into a 100m grid.
Heat Model + Risk Scoring — Built the Heat Danger Score calculator combining UHI anomaly, live weather, solar position (via pvlib), and humidex correction. Personal risk thresholds derived from Health Canada and WHO heat-health guidelines — each medical condition adjusts the safe threshold downward by documented amounts.
Wearable Integration — Connected wristband data (heart rate, activity) to the risk scoring engine. Physiological signals feed into a composite stress indicator that confirms or overrides the environmental-only estimate. Simulated wearable data streams for the demo calibrated against published heat stress vital sign patterns.
Alert Engine — Built the three-level cascade with WebSocket delivery for real-time alerts. Configurable escalation timers with caregiver acknowledgment buttons that feed back into the cascade logic.
Frontend — React dashboards: heat risk map (Mapbox GL JS), PSW client monitor (sortable by risk level with one-click actions), and mobile personal view (simplified large-text PWA with emergency button). Time acceleration for demo — 1 second = 1 hour so judges watch a full heat day unfold live.
Validation — Tested Heat Danger Score against the geographic distribution of 2021 heat dome deaths. Our highest-scoring zones aligned with the neighborhoods that had the highest mortality (Fraser North, Fraser East, Vancouver), confirming the feature engineering is sound. Personal risk model correctly flags individuals matching the victim profile for Level 2 alerts within 90 minutes of peak conditions.
Challenges we faced
Indoor vs. outdoor temperature gap — Our environmental model estimates outdoor conditions, but deaths happen indoors. The wearable partially solves this by providing actual ambient temperature at the person's location. We also added building-level risk multipliers (upper floor, south-facing, pre-1980 construction) from published thermal studies.
Weather station granularity — Environment Canada stations are kilometers apart. We resolved this by using the UHI model to interpolate — the station provides the base temperature, per-block anomaly adjusts it locally.
Privacy framework — Health data plus location requires robust consent and compliance with BC's PIPA. We designed with encryption and role-based access but full compliance would need additional development for a production pilot.
Accomplishments we’re proud of
The demo moment works. Watching the heat map update, a person's risk score climb, their wearable vitals confirm stress, and the alert cascade trigger in real time, it makes heat mortality feel immediate and solvable. The model validates against real deaths. Our highest-risk zones match the actual geographic distribution of the 2021 heat dome fatalities. The underlying science holds up.
The business case is instant. One prevented ER visit saves $5,000–15,000. HeatGuard costs $2/person/month. Preventing 80 ER visits per summer pays for the entire BC deployment.
What we learned?
The gap between having data and saving lives is a software problem, not a data problem. Every piece of information needed to prevent 619 deaths existed in 2021, heat maps, disease registries, caregiver networks. Nobody had connected them. We also learned that energy insecurity is a health determinant, seniors avoiding AC they already have because they can't afford the electricity bill reframes this from a cooling problem to a monitoring problem.
What’s next?
Short-term (1–2 weeks): Live Environment Canada API pipeline replacing pre-computed data Production wearable SDK integration (Fitbit Web API, Apple HealthKit) replacing simulated streams SMS/voice call fallback for alerts via Twilio Expanded coverage across full Metro Vancouver
Long-term scalability:
Municipal pilot with Vancouver Coastal Health (500–1,000 registered individuals through existing PSW networks) Provincial expansion to Quebec (470 heat deaths/summer) and Ontario (highest population + renter concentration) International deployment through community health worker networks — India's 1M+ ASHAs, Bangladesh's 54,000 clinics
Integration with municipal emergency operations for dynamic cooling center deployment and ambulance pre-positioning
Built With
- react
- supabase

Log in or sign up for Devpost to join the conversation.