-
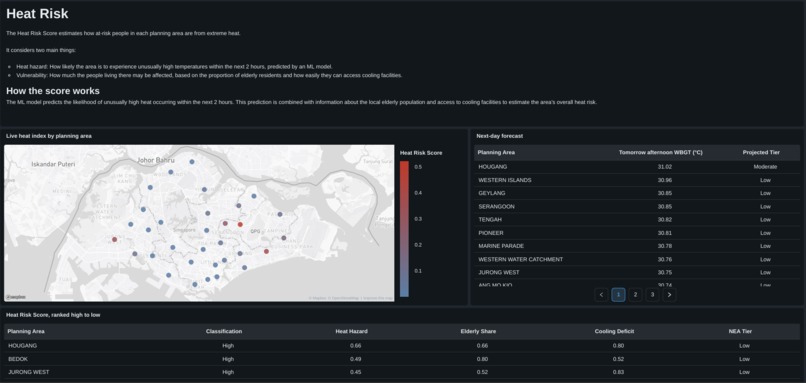
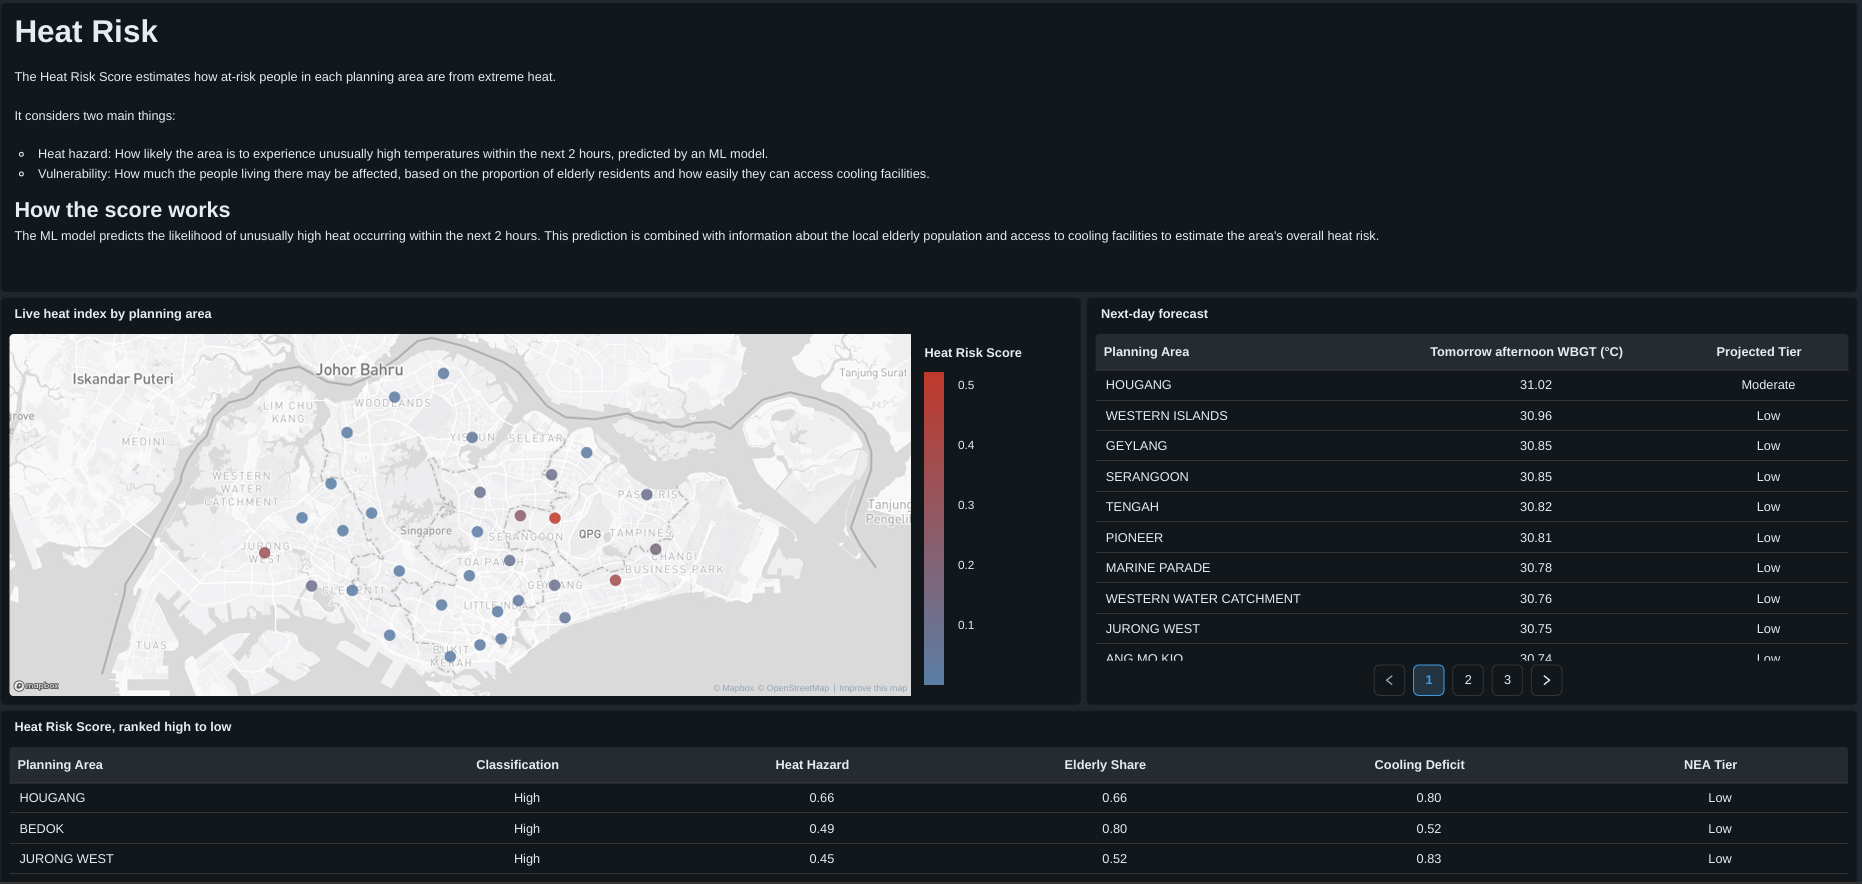
Heat Risk Dashboard
-
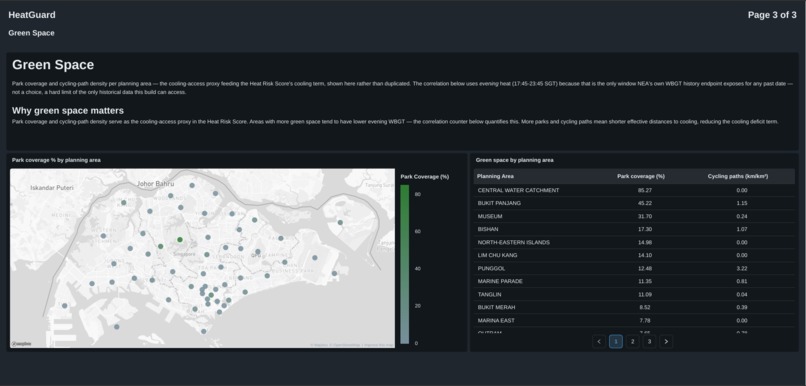
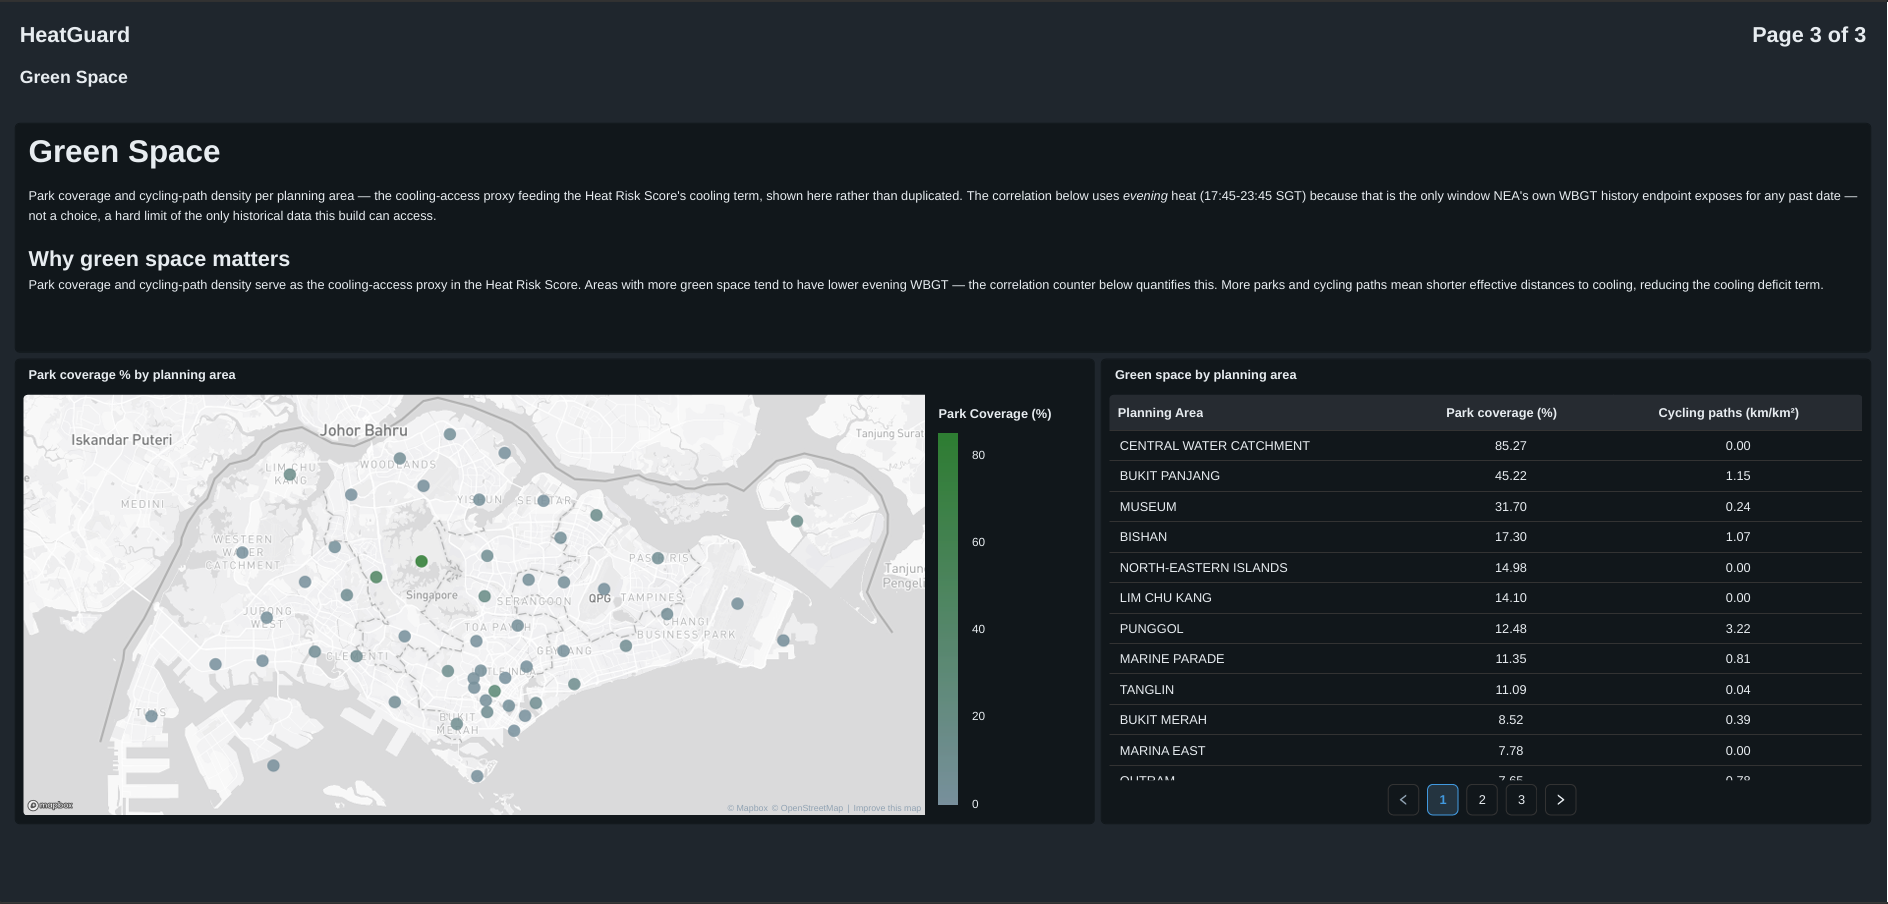
Green Space Dashboard
-
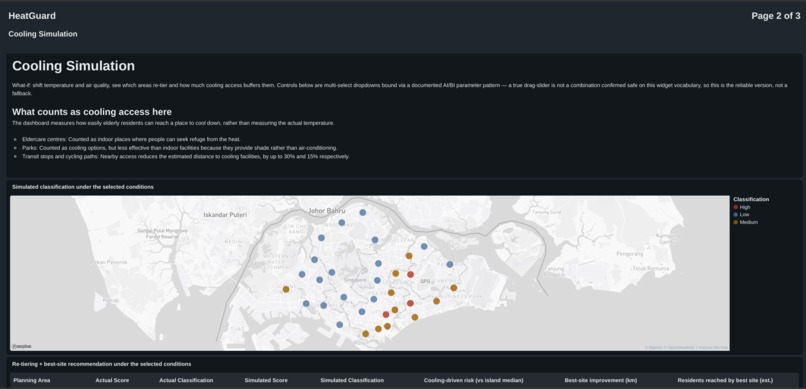
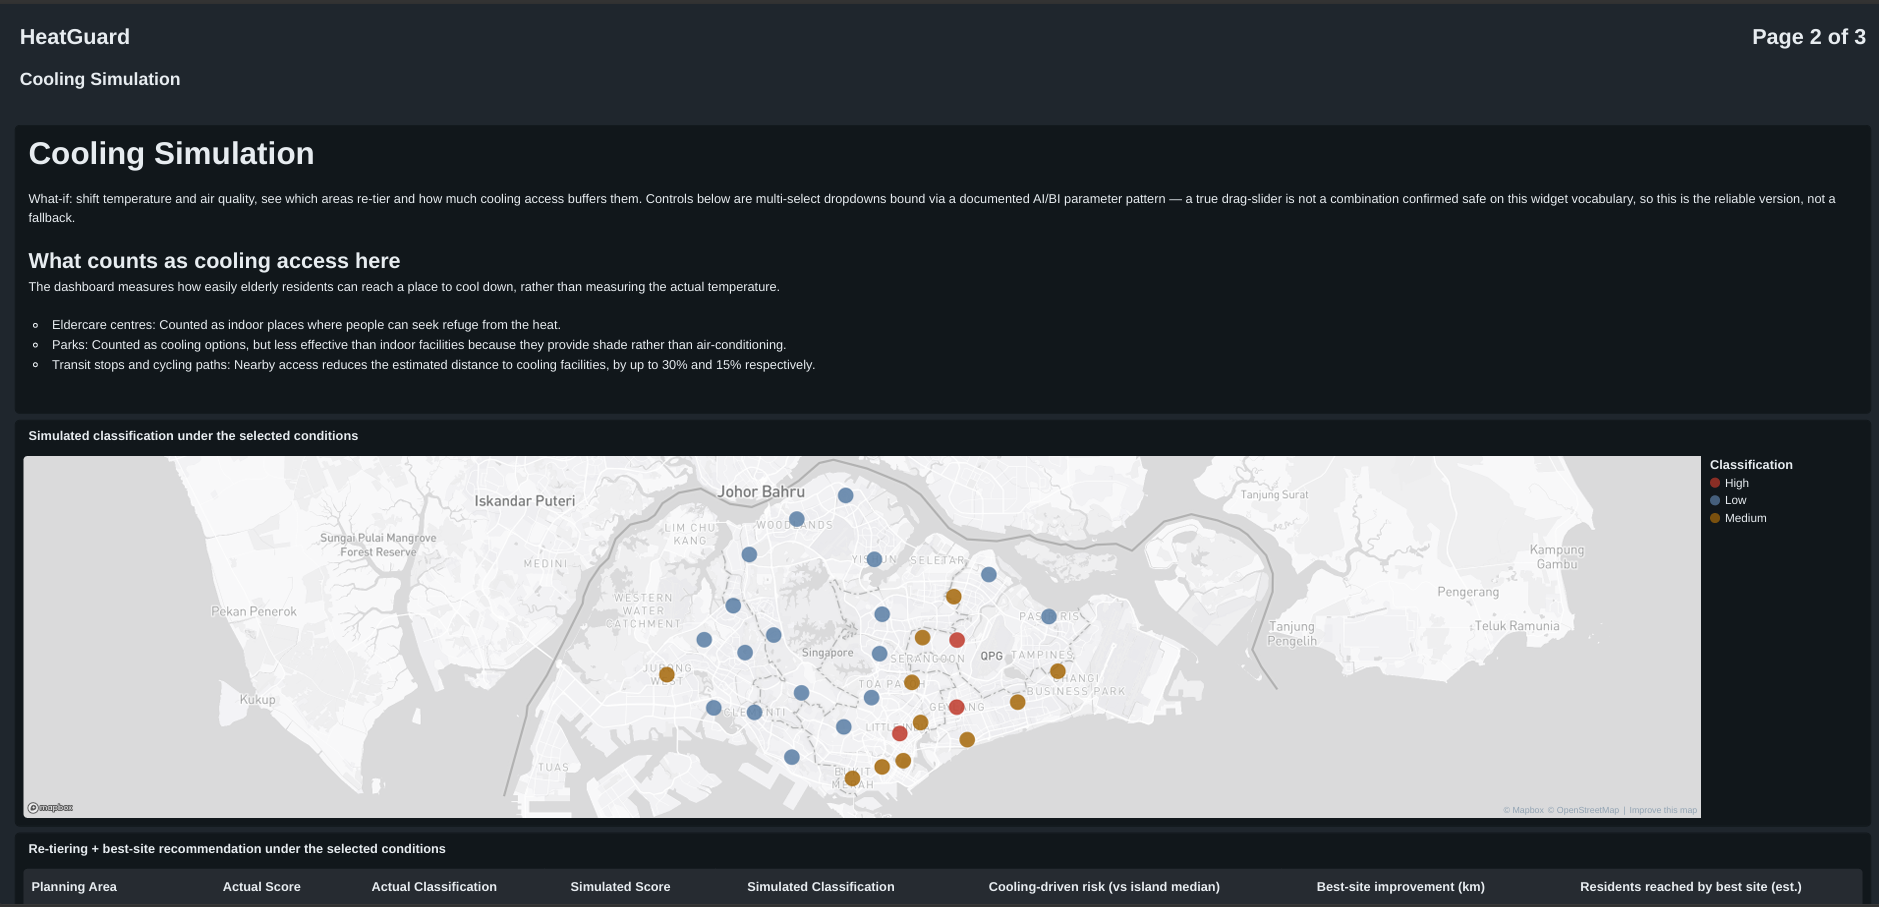
Cooling Sim
Inspiration
Singapore's heat risk isn't spread evenly. Elderly residents in HDB estates far from air-conditioned refuges, parks or transit are the most exposed, but the public heat readings come from only about 30 weather stations. We wanted to turn those sparse readings into something a community outreach worker could act on: which areas are at risk, which blocks to visit first, and where one new cooling spot would help most.
What it does
HeatGuard is an urban heat risk dashboard for Singapore's 55 planning areas. Heat Risk: a live score per area, combining the chance of dangerous heat with how vulnerable residents are, plus a ranked door-knock list for outreach teams. Cooling Simulation: adjust temperature and air quality (PSI) and see how areas re-tier under those conditions. For each area it proposes one new cooling centre and shows how much it would shorten the average distance to a refuge. Green Space: park and cycling-path coverage compared with how hot an area gets in the evening. Next-day forecast: tomorrow's afternoon wet-bulb globe temperature (WBGT) per area.
How we built it
Everything runs on Databricks Free Edition as a medallion pipeline (Bronze → Silver → Gold notebooks, with a 15-minute job and a daily refit job) and an AI/BI Dashboard on top. Using live and 12-month historical WBGT from NEA.
Challenges we ran into
Evening-only history. NEA's WBGT history only returns 17:45–23:45 SGT, for every date we tried. So we labelled every chronic-heat metric "evening", and trained the first models on evening hours only. Which is not a good representation of heat in Singapore.
Accomplishments that we're proud of
A full end-to-end model that derives heat risk to elderlies based on different metrics. A hazard model that looks ahead. A gradient-boosted classifier predicts whether a station's WBGT will reach an elevated-heat level within the next 2 hours. It's trained on 12 months of history plus live readings and checked on a 30-day time holdout.
What we learned
What a model's accuracy figure measures matters as much as its value. Evening accuracy can't stand in for afternoon accuracy. Failing quietly is worse than failing loudly. Several of our worst bugs were widgets showing nothing or an error while all the tests passed. A dashboard needs one owner. Pushing it from code and editing it in the UI at the same time overwrote work, so we made the UI the source of truth.
What's next for HeatGuard
Let the afternoon forecast switch to its own afternoon-trained model as live data builds up, then report its real accuracy. Add daytime readings to the hazard model, which has only seen evening hours so far. Improve block-level accuracy as geocoding of HDB blocks improves.
Built With
- data.gov.sg
- databricks
- onemap
- python
- sql

Log in or sign up for Devpost to join the conversation.