Inspiration: Heart disease is the #1 killer globally, but AI in clinics is often ignored because doctors don't trust "black boxes." I wanted to build a tool that proves its logic using real-world data like the Framingham study.
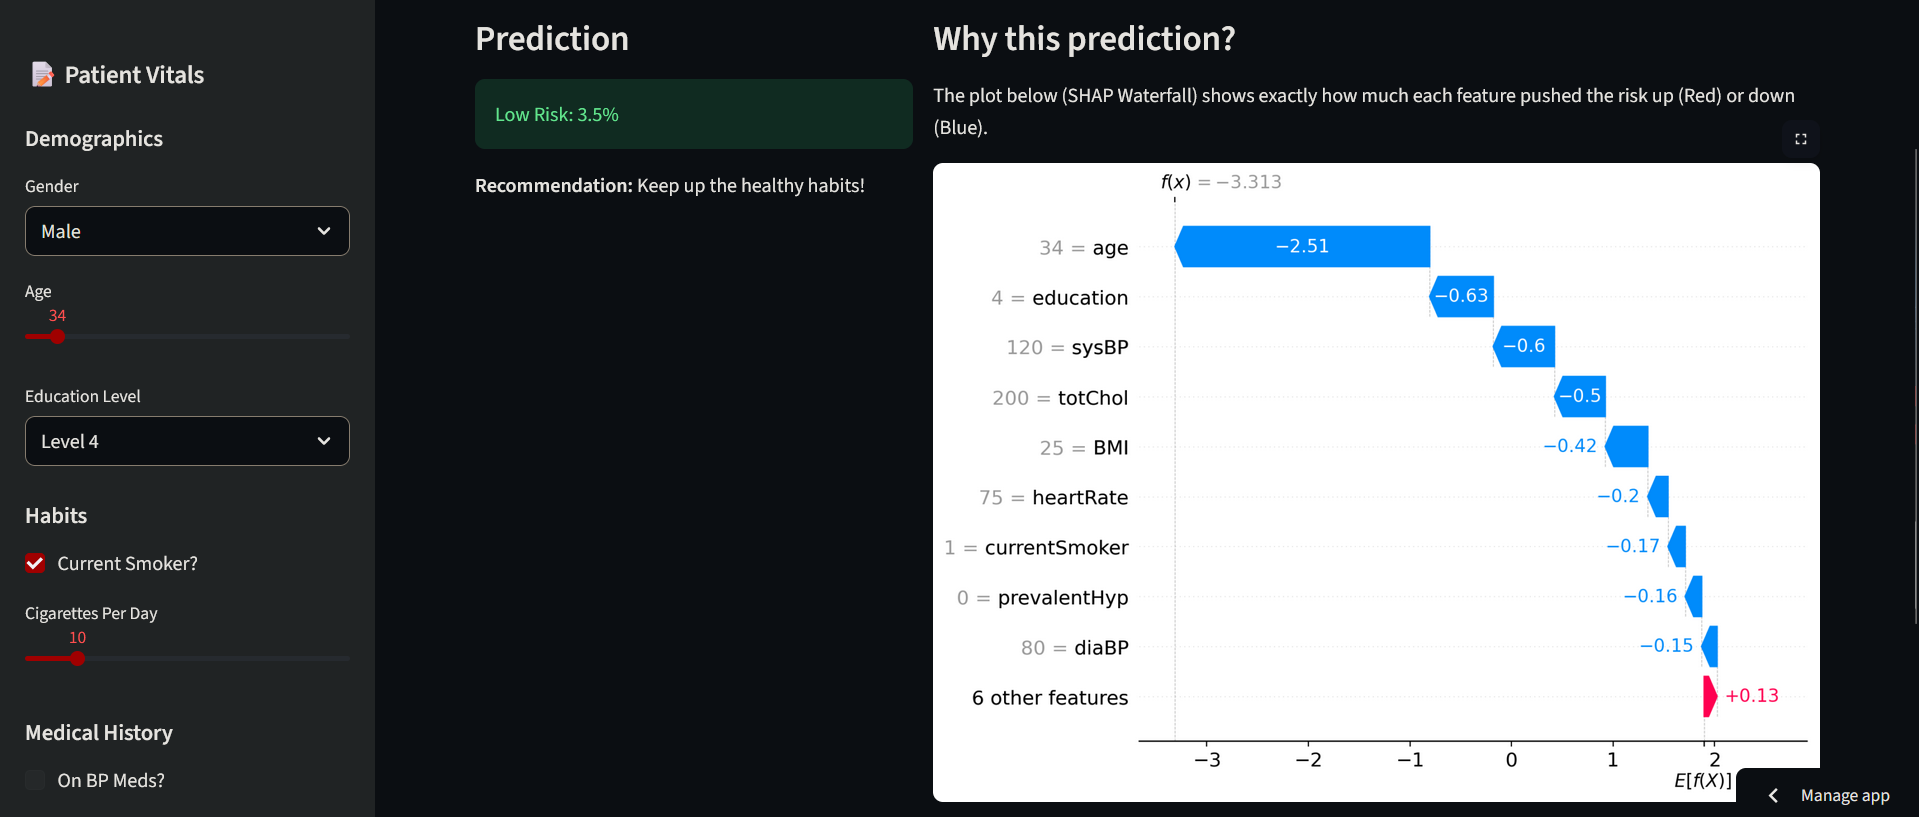
What it does: It predicts 10-year risk of heart disease and provides a "Waterfall Plot" for every patient, showing how factors like systolic BP, age, and education level contribute to their individual risk score.
How I built it: I used Python with XGBoost for the core engine and SHAP for the explainability layer. I established a Logistic Regression baseline to prove technical rigor and built a Streamlit dashboard for a real-time demo.
Challenges I ran into: Data leakage! I realized that many models cheat by oversampling (SMOTE) before splitting the data. I had to refactor my entire pipeline to split before oversampling to ensure honest metrics (~0.62 AUC).
Accomplishments that I'm proud of: Identifying "Education" as a top-3 risk factor. It proved that my model wasn't just doing math; it was capturing the socioeconomic determinants of health that impact long-term patient outcomes.
What I learned: That "high accuracy" is often a lie in medical data. Real-world data is messy, and a robust 0.62 AUC model with perfect transparency is far more useful than a 0.99 AUC model that no doctor can explain.
Built With
- numpy
- pandas
- python
- scikit-learn
- shap
- streamlit
- xgboost

