-
-
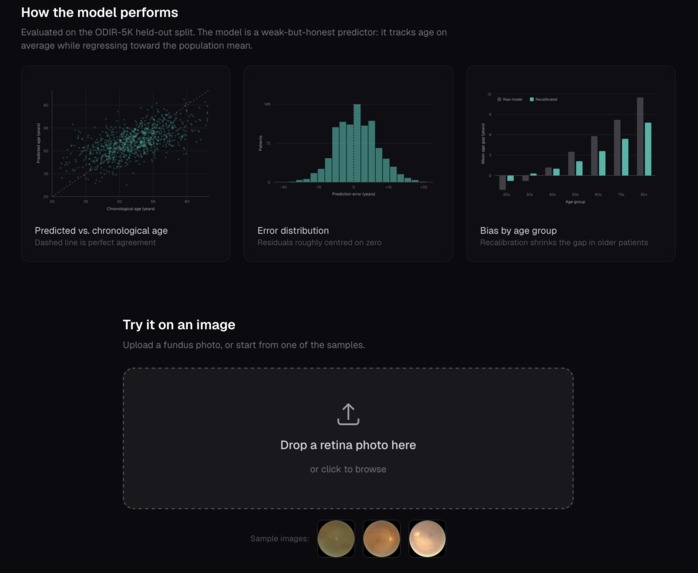
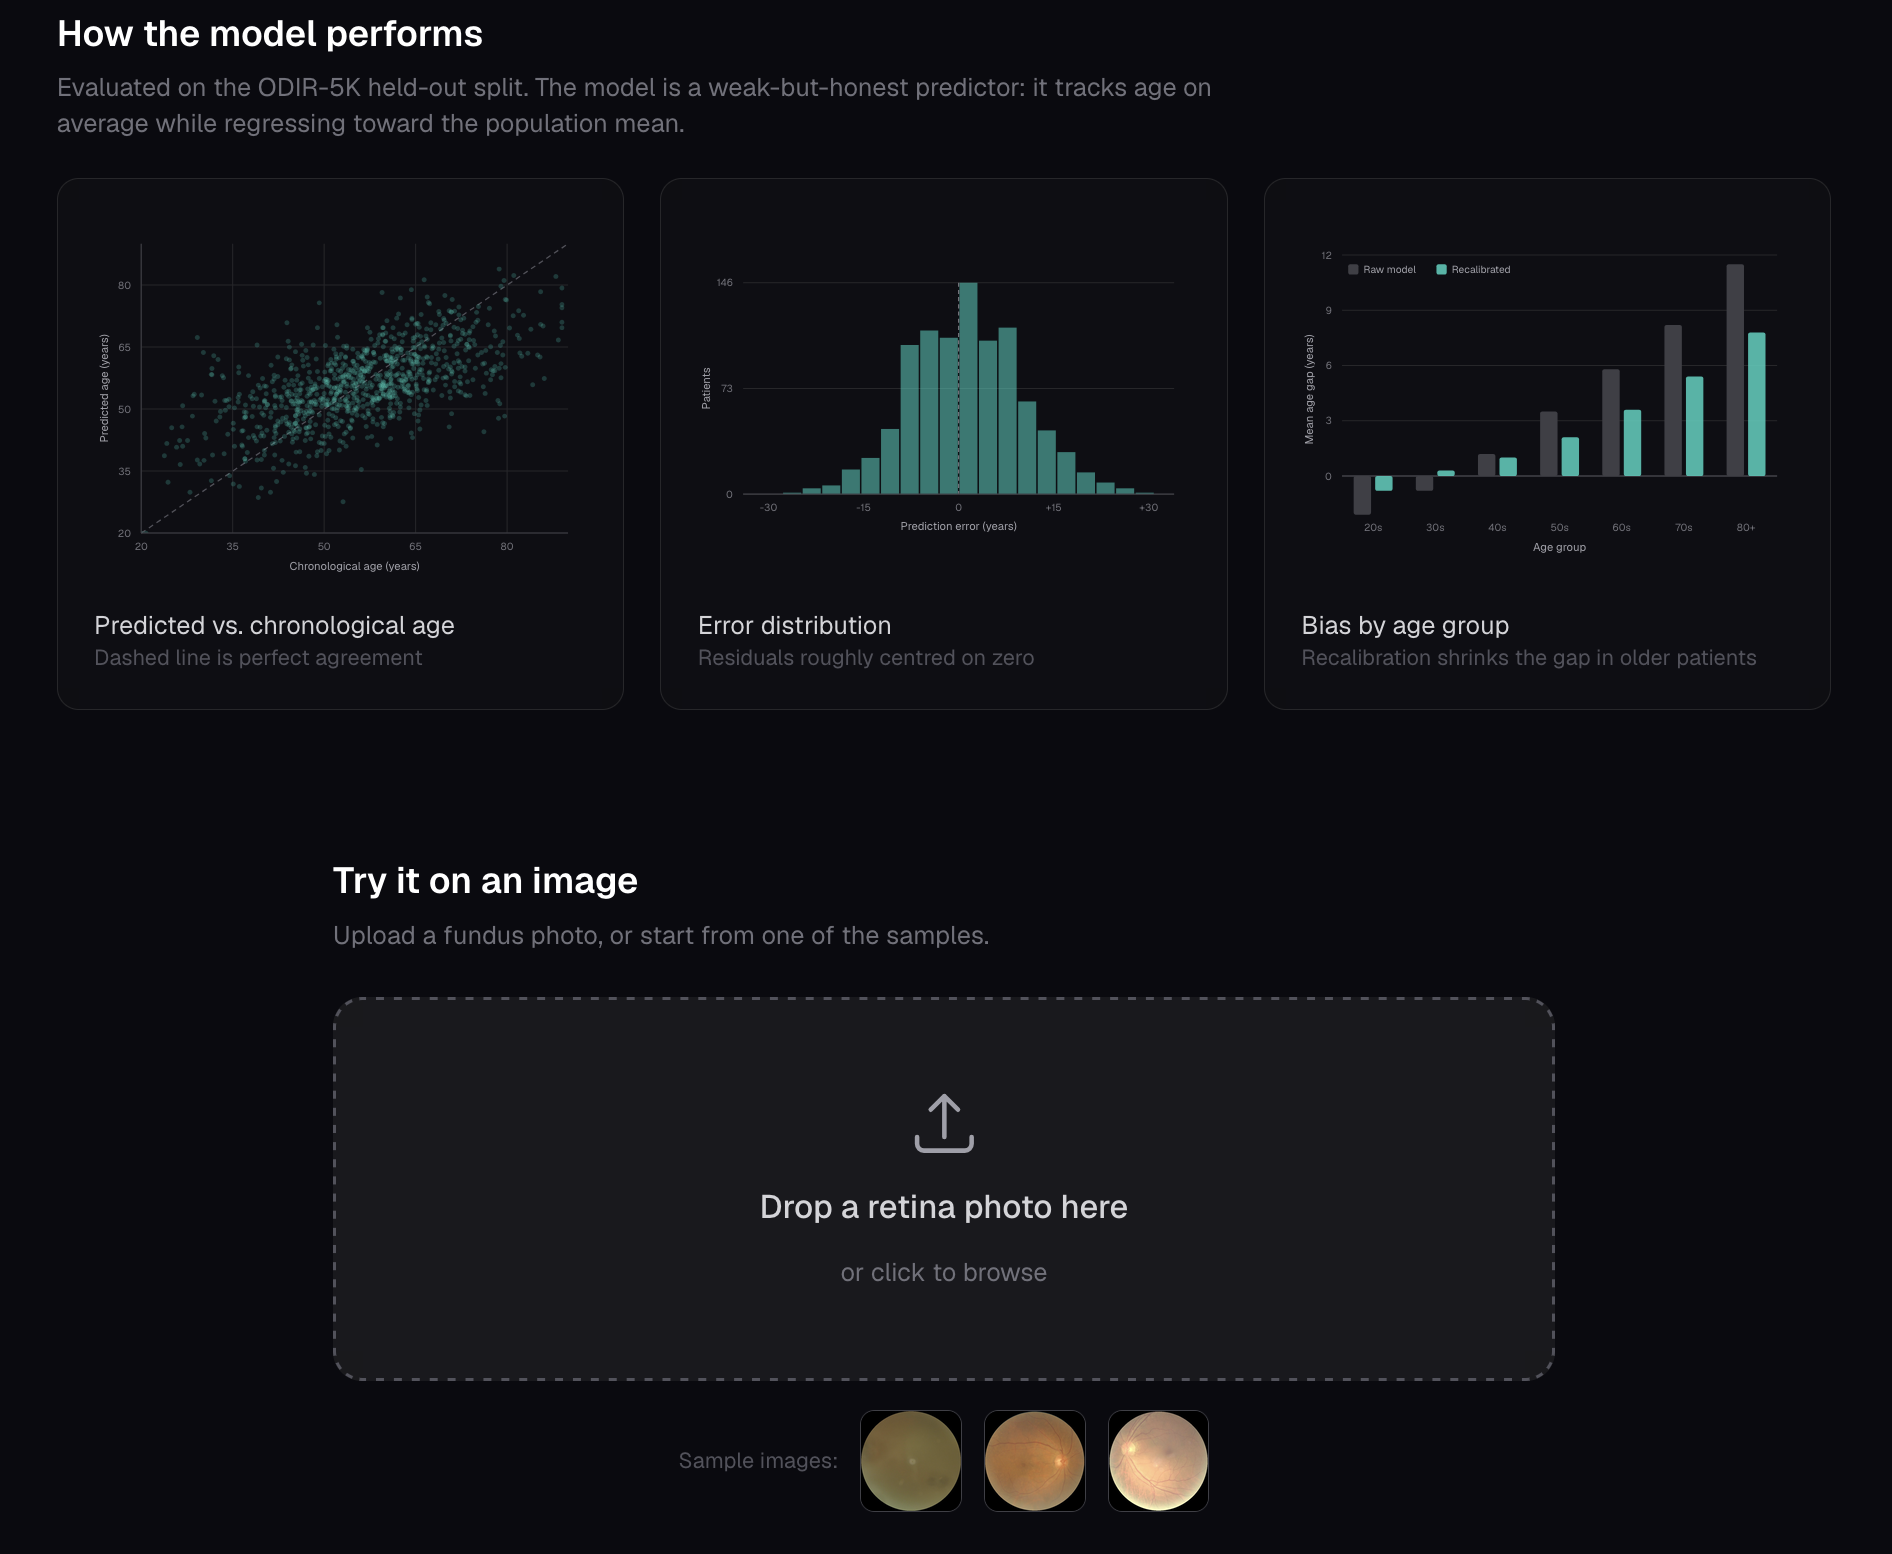
Model performance on held-out retinal scans, predicted vs. actual age, error spread, and bias by group.
-
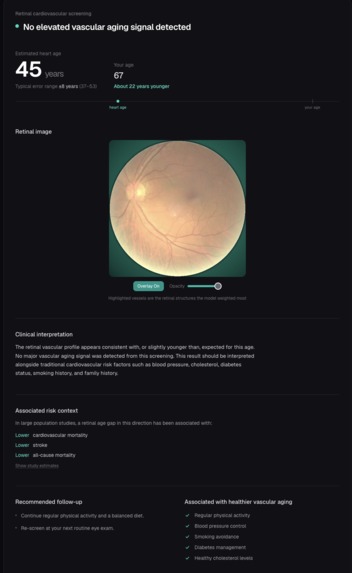
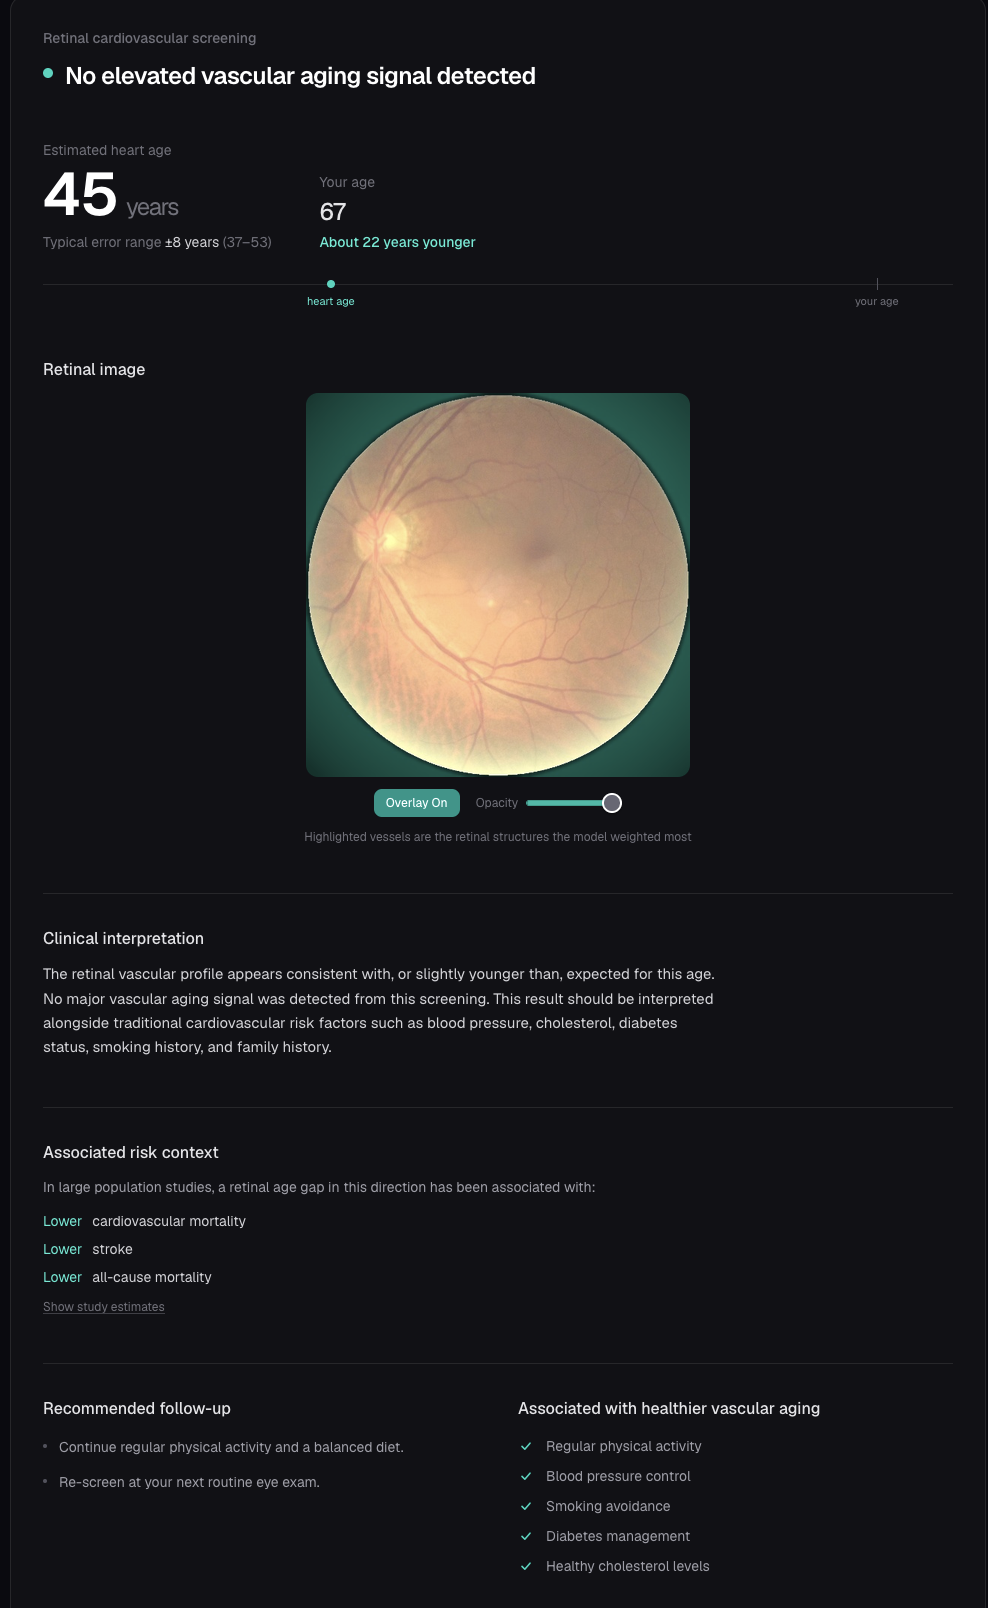
Clinical screening result: estimated heart age with a confidence range, vessel overlay, interpretation, and follow-up guidance.
-
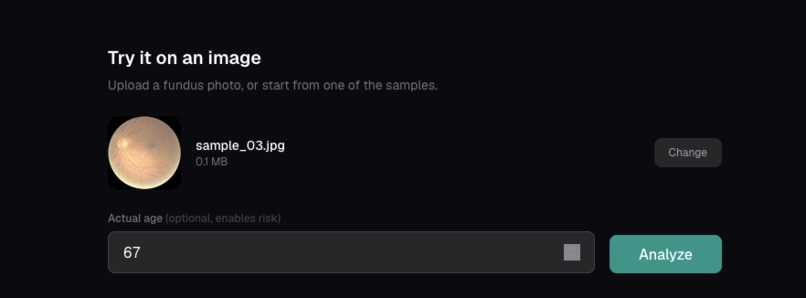
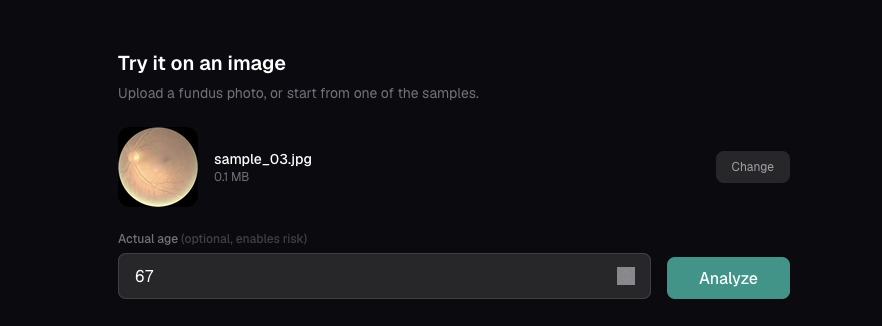
Drop in a fundus photo and add your age, one click runs the screen. No blood draw, no cardiologist needed.
Inspiration
Heart disease is the #1 cause of death on Earth , yet most of the people most at risk are never screened, because cardiology is expensive, reactive, and gated behind specialists. Meanwhile, there's a quiet fact from a field called oculomics: the retina is the only place in the human body where you can directly, non-invasively see blood vessels. Their condition mirrors the heart's. In 2018, Google showed (Nature Biomedical Engineering) that a deep network could read age, sex, blood pressure, and even major cardiac events straight off a fundus photo.
So I wanted to build an app that can take a photo any optometrist already takes for free and turn it into a cardiovascular screen, for the billions of people who will never see a cardiologist.
What it does
HeartSight takes a single retinal photo and returns three things:
- A predicted "heart age" ( the age your vasculature looks like.)
- An age-gap risk score - the retinal age gap
- A vessel saliency map (Grad-CAM) showing which regions drove the prediction.
where a positive gap suggests older-looking vasculature than expected for the person's actual age. Previous studies have shown that this gap is associated with cardiovascular and mortality risk. HeartSight categorizes the result into Low / Moderate / High risk levels
How I built it
The pipeline is a pragmatic transfer-learning stack:
- Backend: a ViT-B/16 as a feature extractor.
- I extracted embeddings once and cache them to
.npy. After that, the age regressor trains in seconds on CPU instead of hours on a GPU. That single decision made iteration fast enough to actually do research - Backend: FastAPI with one
/predictendpoint,preprocess → embed → heart_age → risk_band → saliency_overlay, returning JSON. - Frontend: Next.js + Tailwind ; A simple a drag-and-drop upload, an animated SVG heart-age dial that counts up, a green/amber/red risk gauge, and a saliency overlay with an opacity slider. The visual is the product. The research: I wanted to go beyond a simple demo. Published oculomics models are known to struggle with generalization across different cameras and patient populations, and many tend to be biased toward predicting lower risk. To address this, I:
- Measured generalization by evaluating the model on APTOS 2019, a dataset it never encountered during training.
- Reduced low-risk bias using isotonic regression calibrated on a held-out validation set, with before-and-after calibration curves displayed on a dedicated /methods page.
What I learned
- Generalization is where machine learning becomes truly challenging. Seeing MAE increase from 7.66 to 4.66 years when moving to a new dataset taught me more than any in-distribution metric
- Calibration ≠ accuracy. Isotonic regression fixed the direction of the bias even where it couldn't fix the magnitude of the error.
Challenges I faced
| Challenge | What happened | How I handled it |
|---|---|---|
| No Kaggle API key | Couldn't pull ODIR-5K the easy way | Planned for a manual download + alternative-dataset fallback from day one |
| RETFound weights | The ideal retinal foundation model was slow/unreliable to fetch | Fell back to a timm ViT-B/16 ImageNet backbone, identical pipeline, slightly higher MAE, fully reproducible |
| Cross-dataset age labels | Many fundus datasets (APTOS, Messidor) lack age | Designed validation around what the data actually supported |
results
| Metric | Value |
|---|---|
| Test MAE (ODIR-5K) | 4.66 years |
| (ODIR-5K) | 0.227 |
| Cross-dataset MAE (APTOS) | 12.8 years |
| Training samples | 4,450 |
| Backbone | ViT-B/16 (768-d embeddings) |
Built With
- next.js
- odir-5k
- opencv/pillow
- python
- pytorch
- scikit-learn
- tailwind

Log in or sign up for Devpost to join the conversation.