Inspiration
A risk score of 0.9 means little to a patient, and not much more to a busy clinician. It doesn't say where. Pointing at the artery that is probably narrowed, and saying why, changes the conversation. I wanted a tool that does exactly that, is honest about how good it is, and runs on any laptop.
What it does
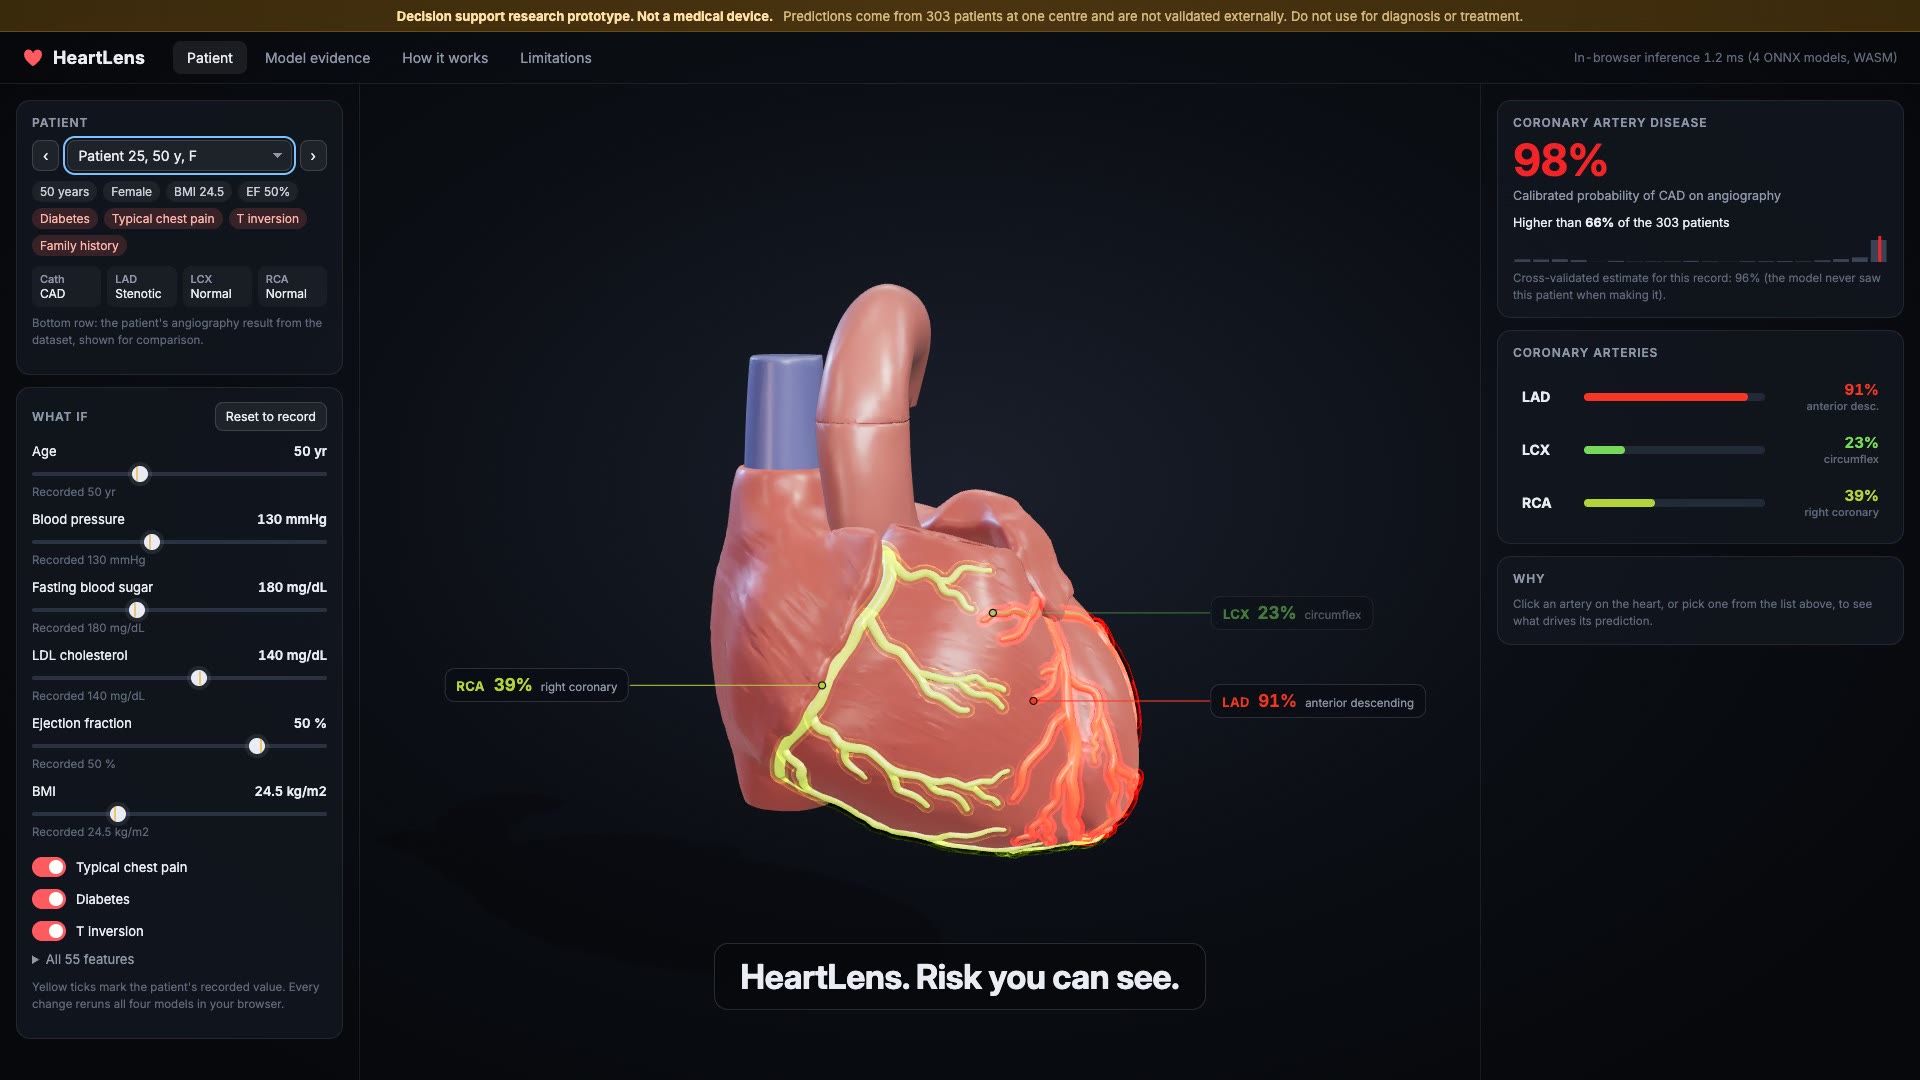
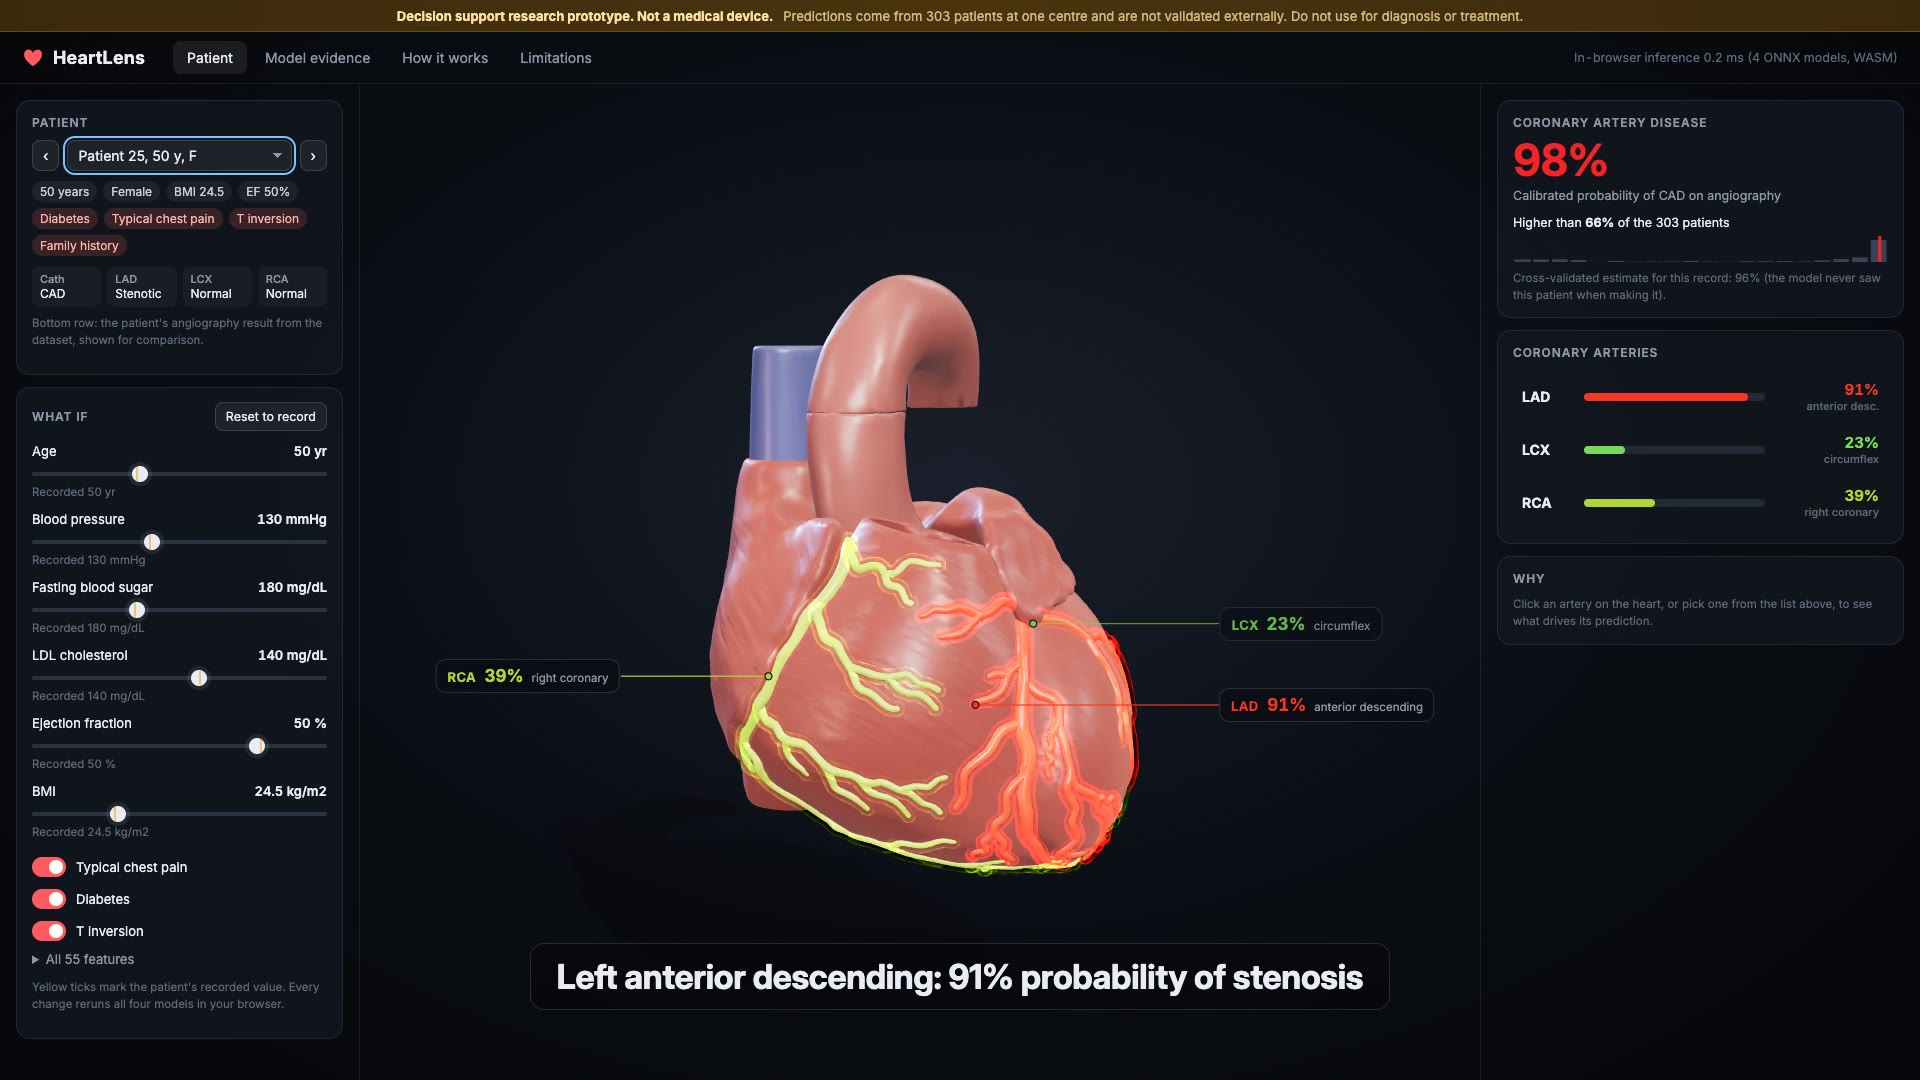
- Predicts coronary artery disease (CAD) plus stenosis of the left anterior descending (LAD), left circumflex (LCX) and right coronary (RCA) arteries from 55 routine features: demographics, history, symptoms, exam, ECG, labs and echo.
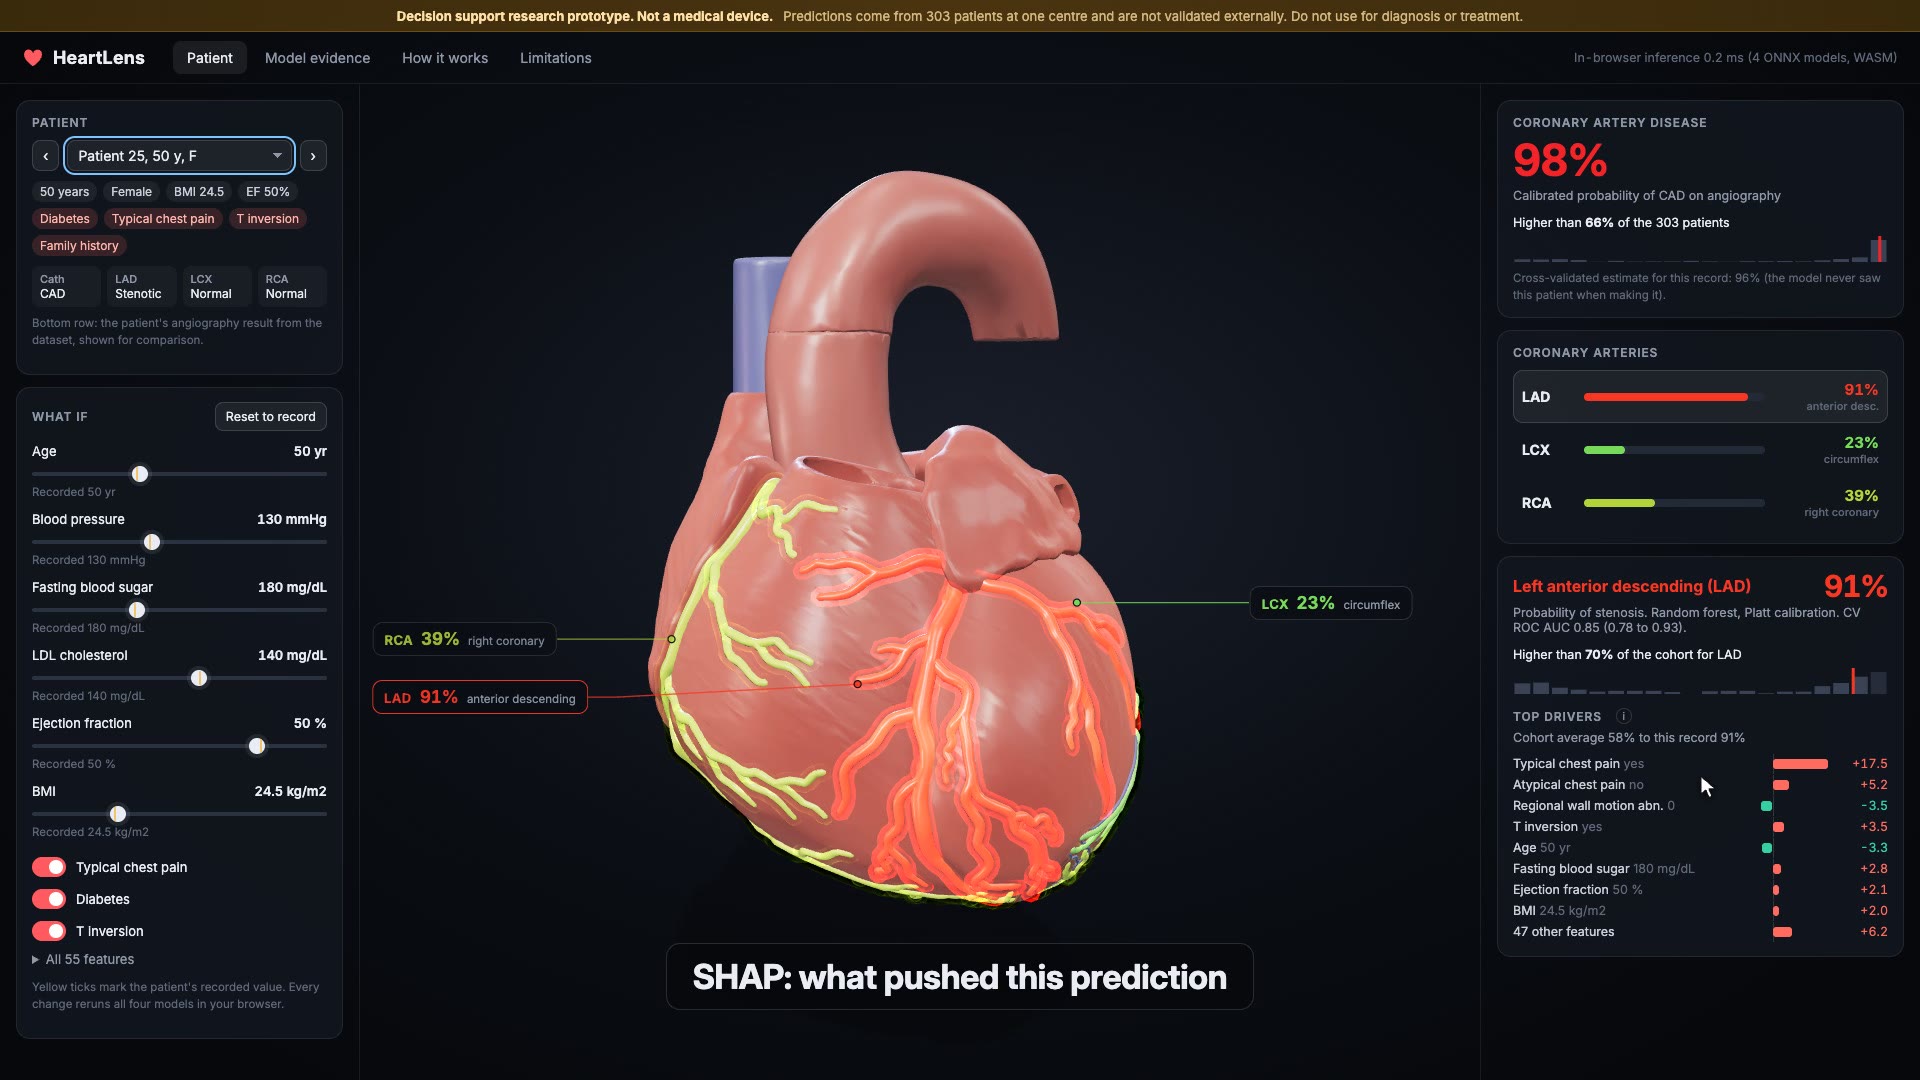
- Paints each prediction onto its artery on a real anatomical 3D heart (BodyParts3D). Green is low, red is high. The overall CAD probability subtly tints the muscle. Orbit, zoom, click an artery.
- Explains every prediction with SHAP: a waterfall of the top drivers in percentage points, plus the patient's percentile among all 303 patients.
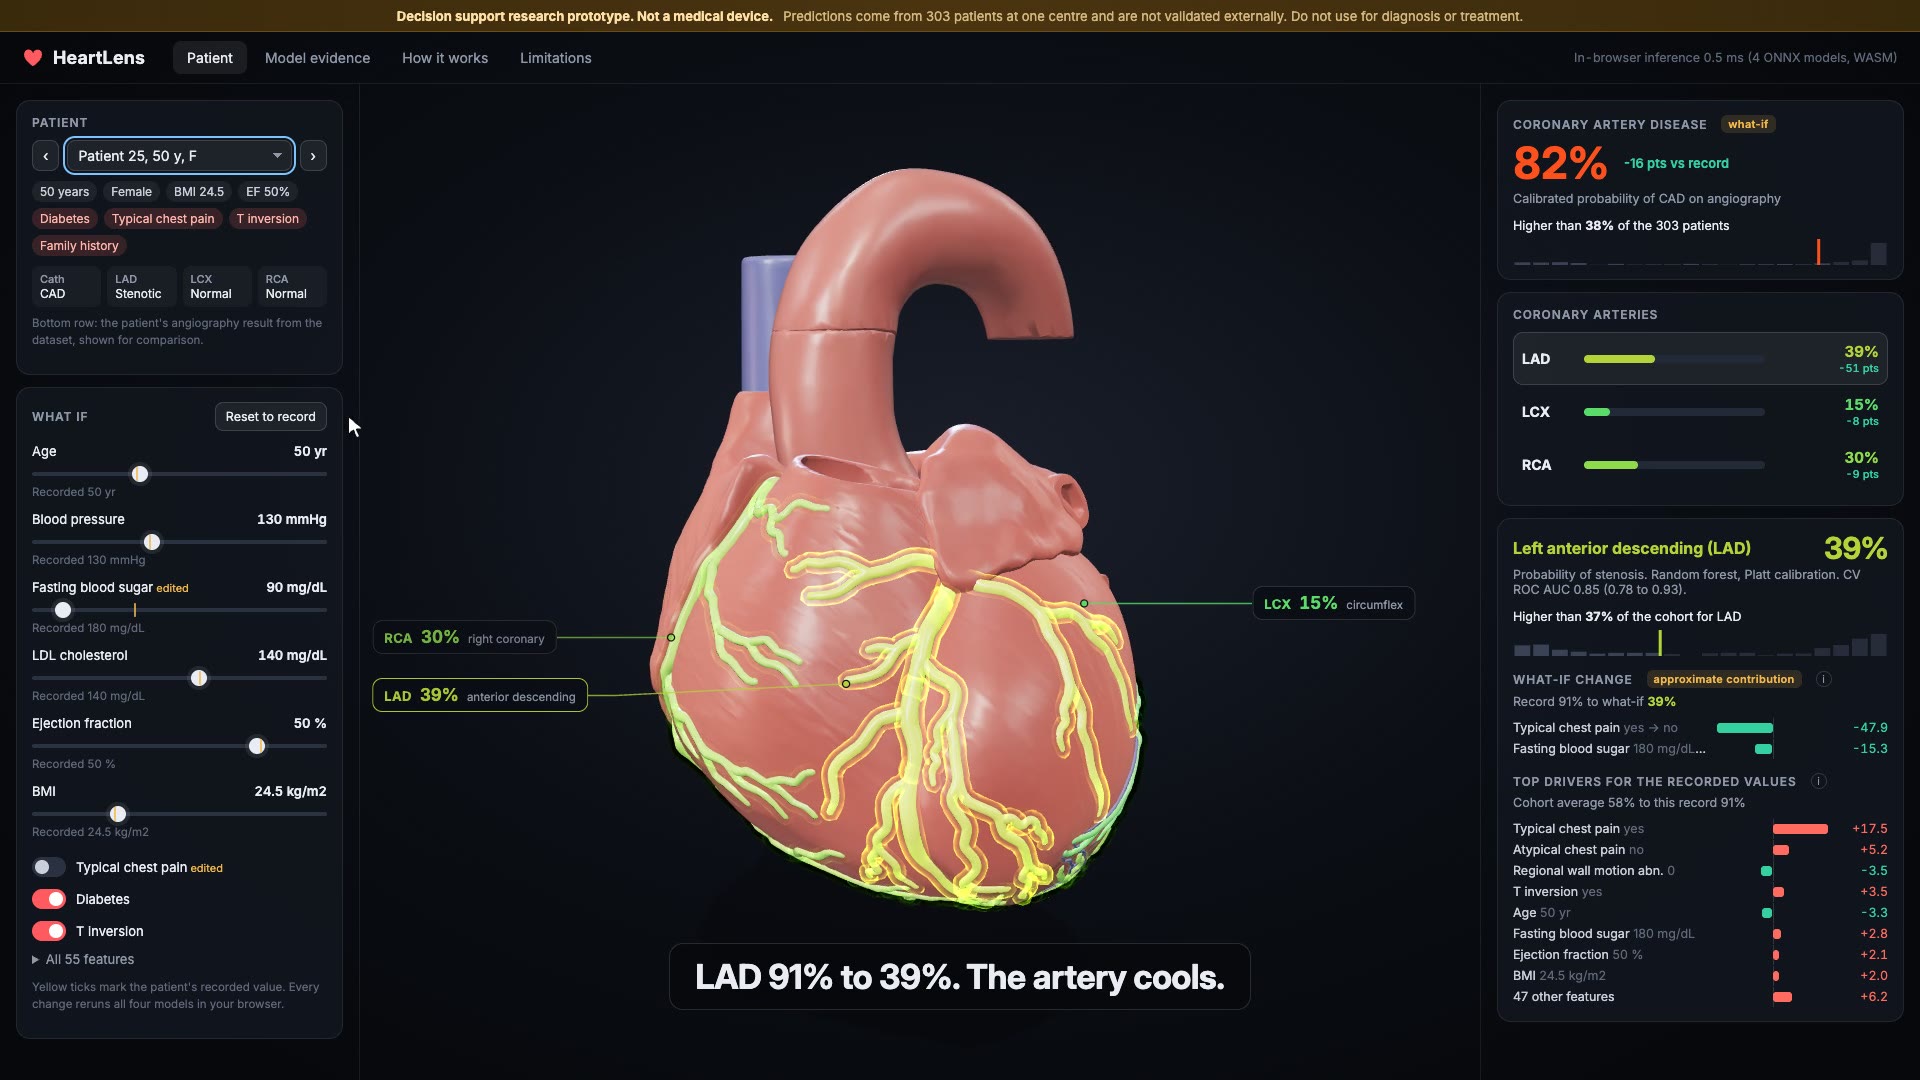
- What-if sliders and toggles (age, blood pressure, fasting blood sugar, LDL, ejection fraction, BMI, typical chest pain, diabetes, T inversion) and an editable form for all 55 features. Every change reruns four ONNX models in the browser in well under a millisecond and recolours the arteries live. Edited rows get a clearly labelled approximate contribution.
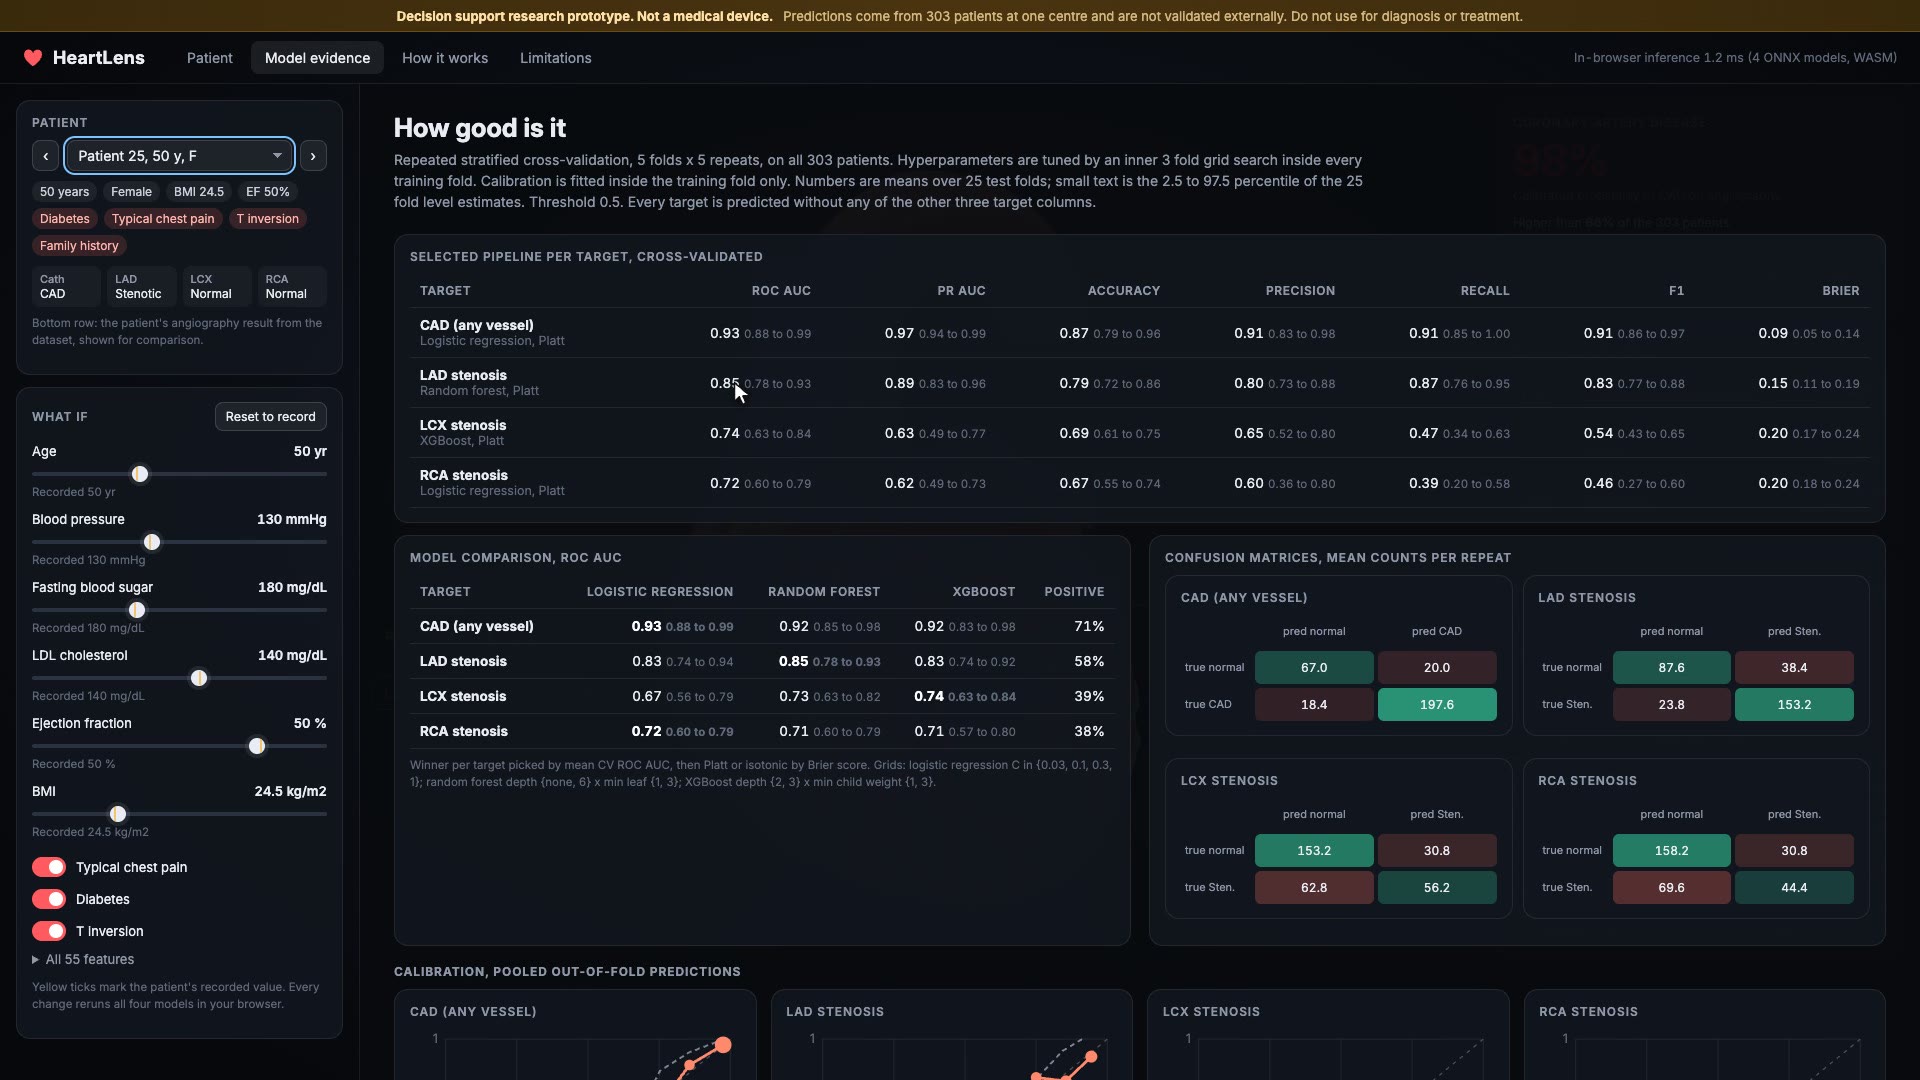
- A model evidence view with the full cross-validation table, model comparison, calibration plots and confusion matrices.
- A permanent banner: decision support research prototype, not a medical device.
How I built it
- Data: UCI extension of the Z-Alizadeh Sani dataset (303 patients, CC BY 4.0). Strict leakage rule: when one target is predicted, all four target columns are dropped. A pytest suite asserts this.
- Models: repeated stratified 5x5 cross-validation. Inside every training fold, a 3 fold grid search tunes logistic regression, random forest and XGBoost, and Platt and isotonic calibration are fitted on inner out-of-fold predictions. The best family per target is chosen by ROC AUC, the calibration by Brier score. Metrics come with 95% fold intervals.
- Explanations: permutation SHAP on the full calibrated pipeline, precomputed for all 303 patients and 4 targets, so the bars add up exactly to the displayed probability.
- Export: final models to ONNX with skl2onnx and onnxmltools. Python and ONNX agree to 3e-7; a Node test runs the same files in onnxruntime-web and checks all 303 patients.
- App: Vite and TypeScript, Three.js for the heart (BodyParts3D meshes decimated with trimesh, vertex colour risk ramp, flowing pulse and fresnel glow per artery, raycast picking, leader line labels, soft shadows, ACES tone mapping), onnxruntime-web (WASM) for inference. Static site, no backend.
- Film: a deterministic film mode and a Playwright recorder that renders every frame.
Results
Repeated stratified 5x5 CV, mean (95% fold interval), threshold 0.5:
| Target | Selected model | ROC AUC | PR AUC | Accuracy | Precision | Recall | F1 | Brier |
|---|---|---|---|---|---|---|---|---|
| CAD (any vessel) | Logistic regression, Platt | 0.93 (0.88 to 0.99) | 0.97 (0.94 to 0.99) | 0.87 (0.79 to 0.96) | 0.91 (0.83 to 0.98) | 0.91 (0.85 to 1.00) | 0.91 (0.86 to 0.97) | 0.09 (0.05 to 0.14) |
| LAD stenosis | Random forest, Platt | 0.85 (0.78 to 0.93) | 0.89 (0.83 to 0.96) | 0.79 (0.72 to 0.86) | 0.80 (0.73 to 0.88) | 0.87 (0.76 to 0.95) | 0.83 (0.77 to 0.88) | 0.15 (0.11 to 0.19) |
| LCX stenosis | XGBoost, Platt | 0.74 (0.63 to 0.84) | 0.63 (0.49 to 0.77) | 0.69 (0.61 to 0.75) | 0.65 (0.52 to 0.80) | 0.47 (0.34 to 0.62) | 0.54 (0.43 to 0.65) | 0.20 (0.17 to 0.24) |
| RCA stenosis | Logistic regression, Platt | 0.72 (0.60 to 0.79) | 0.62 (0.49 to 0.73) | 0.67 (0.55 to 0.74) | 0.60 (0.36 to 0.80) | 0.39 (0.20 to 0.58) | 0.46 (0.27 to 0.60) | 0.20 (0.18 to 0.24) |
Challenges I ran into
- Small data and weak targets. 303 patients, and LCX and RCA are hard to predict from clinical data. I kept the honest numbers (ROC AUC about 0.72 to 0.74, low recall) instead of tuning a threshold to make the table look better.
- Leakage. The four labels are tightly linked (Cath is positive when any vessel is). Predicting a vessel with Cath as a feature would look great and mean nothing. Hence the rule and the test.
- Explaining what-ifs honestly. Precomputed SHAP is exact for dataset rows but not for edited rows. Running SHAP in the browser would be slow, so edited rows show a single feature reversal, labelled "approximate contribution", with a tooltip saying what it is.
- Browser parity. A tree model disagreed with Python by up to 0.009 at first. The cause was rounding feature values to 3 decimals in the export, which moved some values across split thresholds. Exporting exact source values fixed it, and the parity test now guards it.
- Real anatomy at laptop speed. The BodyParts3D heart wall is 330k triangles. Decimated to 70k with the coronary trees kept, and no post processing, so it runs on integrated graphics.
Accomplishments that I'm proud of
- A real anatomical heart where each coronary artery carries its own calibrated prediction.
- Validation that a reviewer can trust: nested tuning, calibration inside the folds, intervals, a leakage test and a browser parity test.
- The whole thing is a static page. Patient data never leaves the browser.
What I learned
- How much the labels in a medical dataset leak into each other, and how easy it is to fool yourself.
- Calibration matters more to a clinician than a few points of AUC.
- SHAP on the calibrated pipeline in probability units is much easier to explain than log-odds.
What's next
- External validation on a second cohort.
- Imaging inputs: CT angiography or echo video alongside the tabular data.
- A usability study with cardiologists, and patient-friendly wording.
Limitations
- 303 patients from one centre in Tehran, Iran; a referral population with 71% CAD. No external validation.
- LCX and RCA predictions are weak.
- The colour marks the artery, not the location of a narrowing.
- What-if sliders show model behaviour, not causal effects.
- Dataset patients' live probabilities are in-sample; the app also shows the out-of-fold estimate.
- Generic anatomy, not patient specific.
- Not a medical device. The film is scripted (cursor, camera, clicks), but every number on screen comes from the models running in the page.
Attribution
- R. Alizadehsani, M. Roshanzamir, Z. Sani, Extension of Z-Alizadeh Sani dataset, UCI Machine Learning Repository, DOI 10.24432/C5461K, CC BY 4.0.
- BodyParts3D, Copyright 2008 Life Science Integrated Database Center, CC BY-SA 2.1 Japan.
Built With
- ffmpeg
- matplotlib
- numpy
- onnx
- onnxmltools
- onnxruntime
- onnxruntime-web
- pandas
- playwright
- python
- scikit-learn
- shap
- skl2onnx
- three.js
- trimesh
- typescript
- vite
- webassembly
- xgboost

Log in or sign up for Devpost to join the conversation.