-
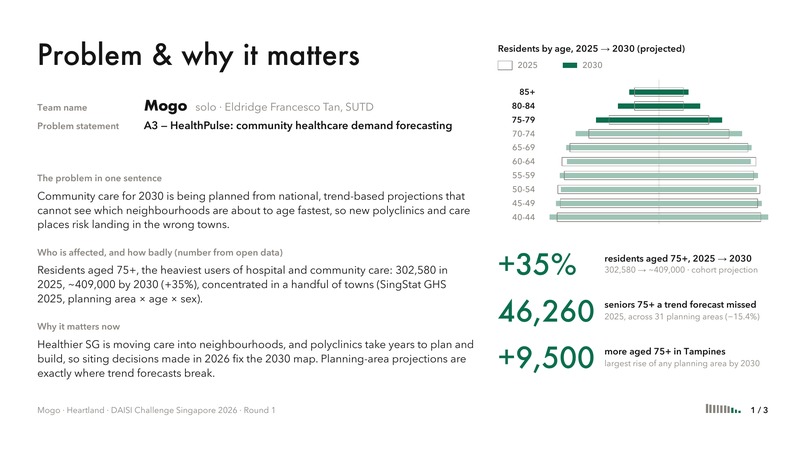
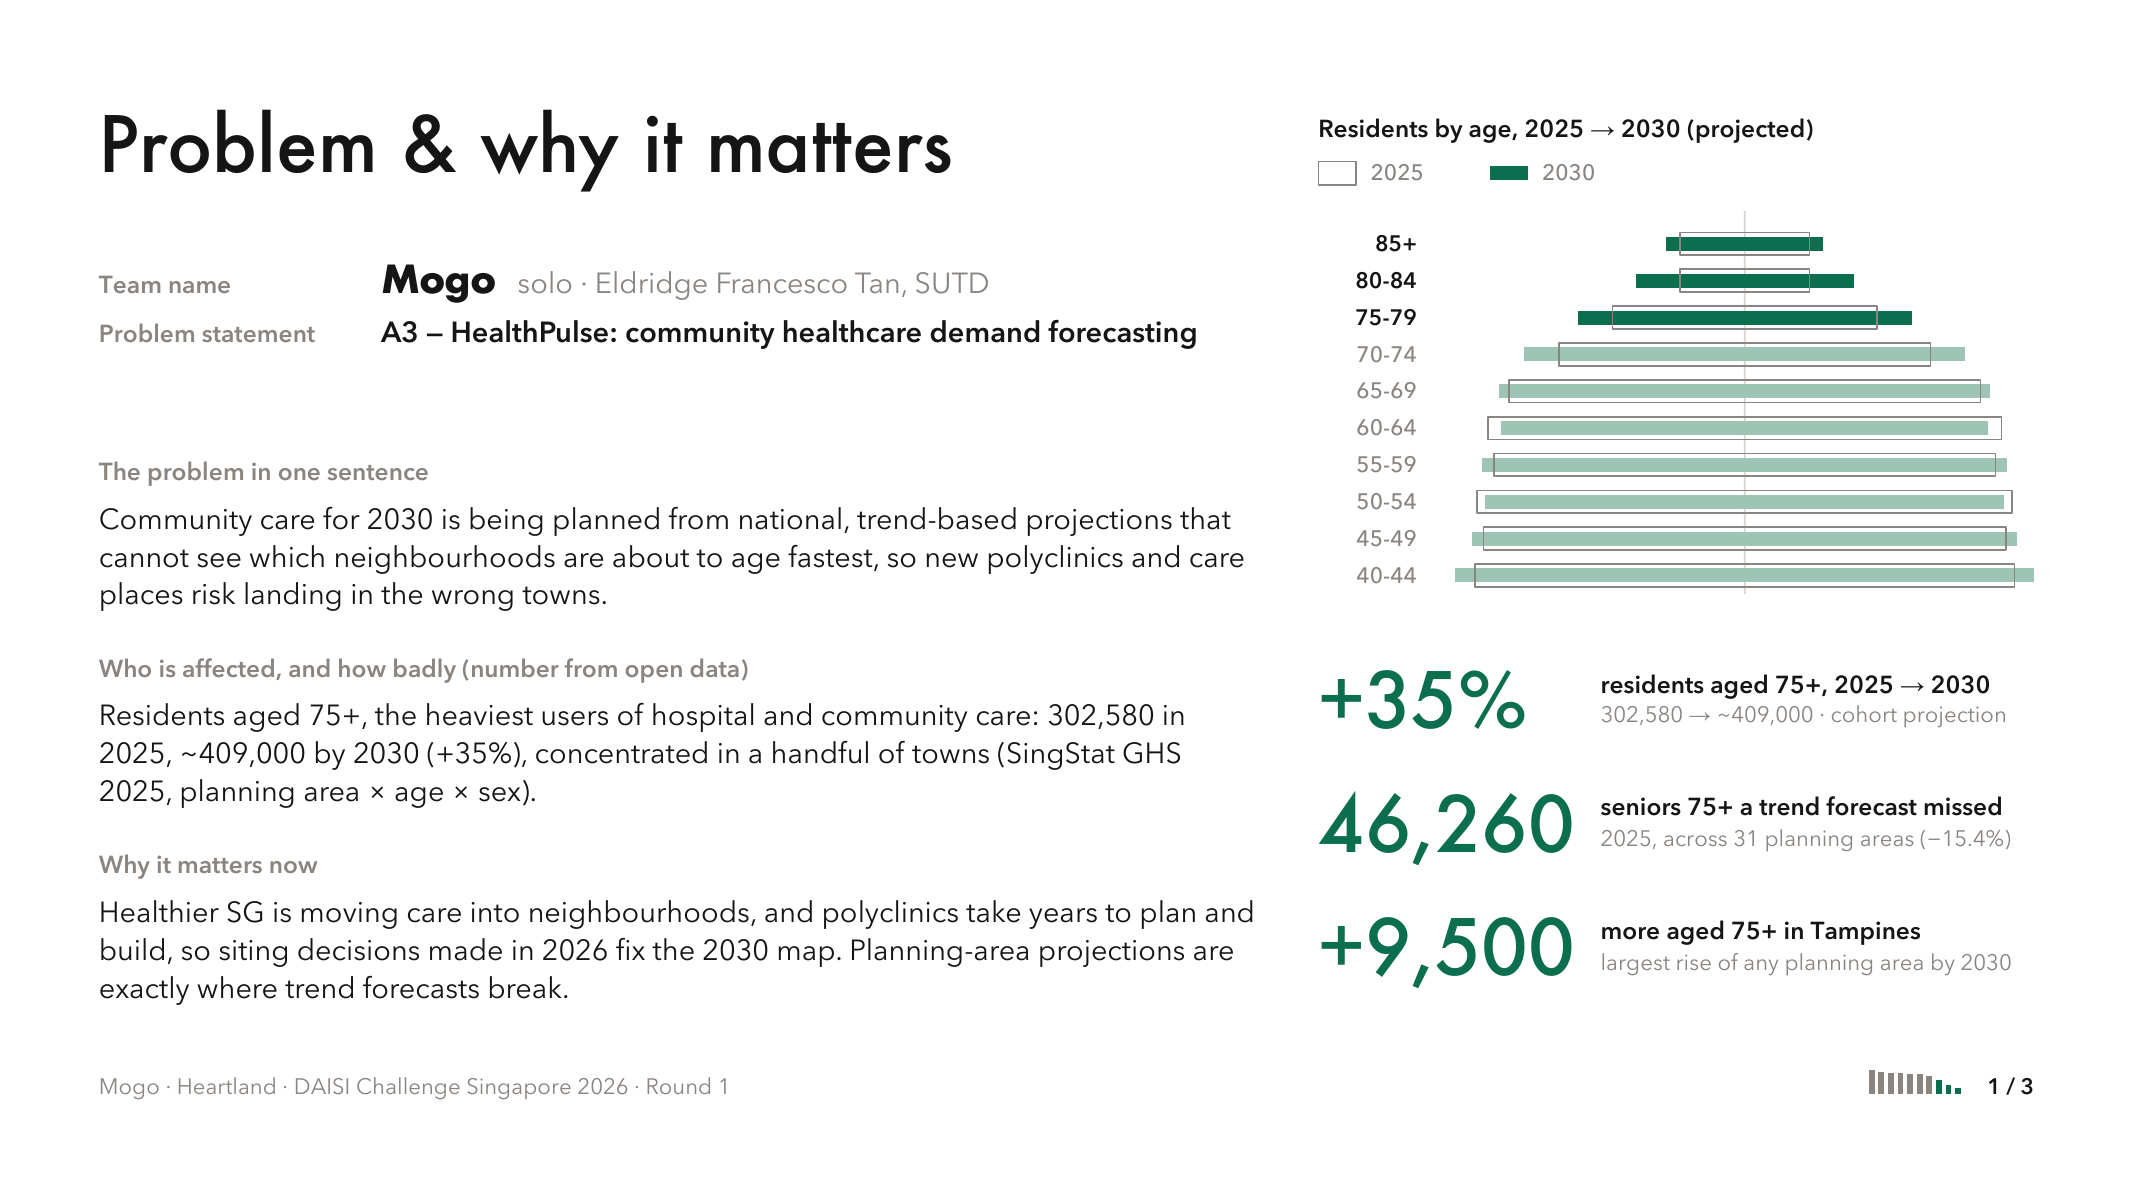
Slide 1 · Problem & why it matters: residents aged 75+ grow 35% by 2030
-
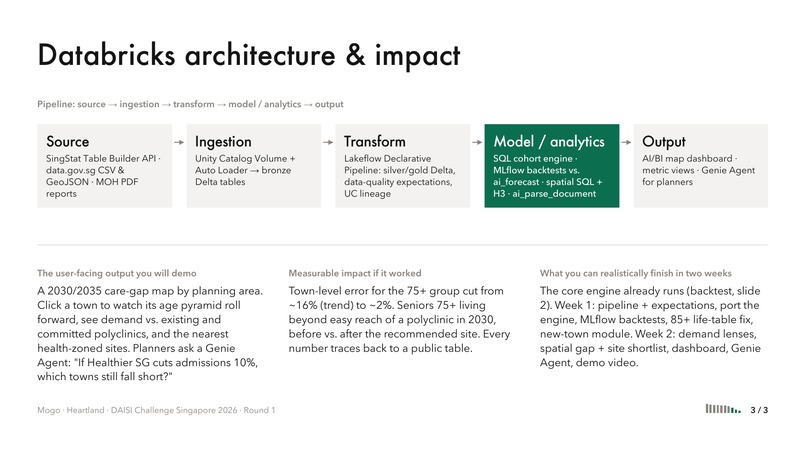
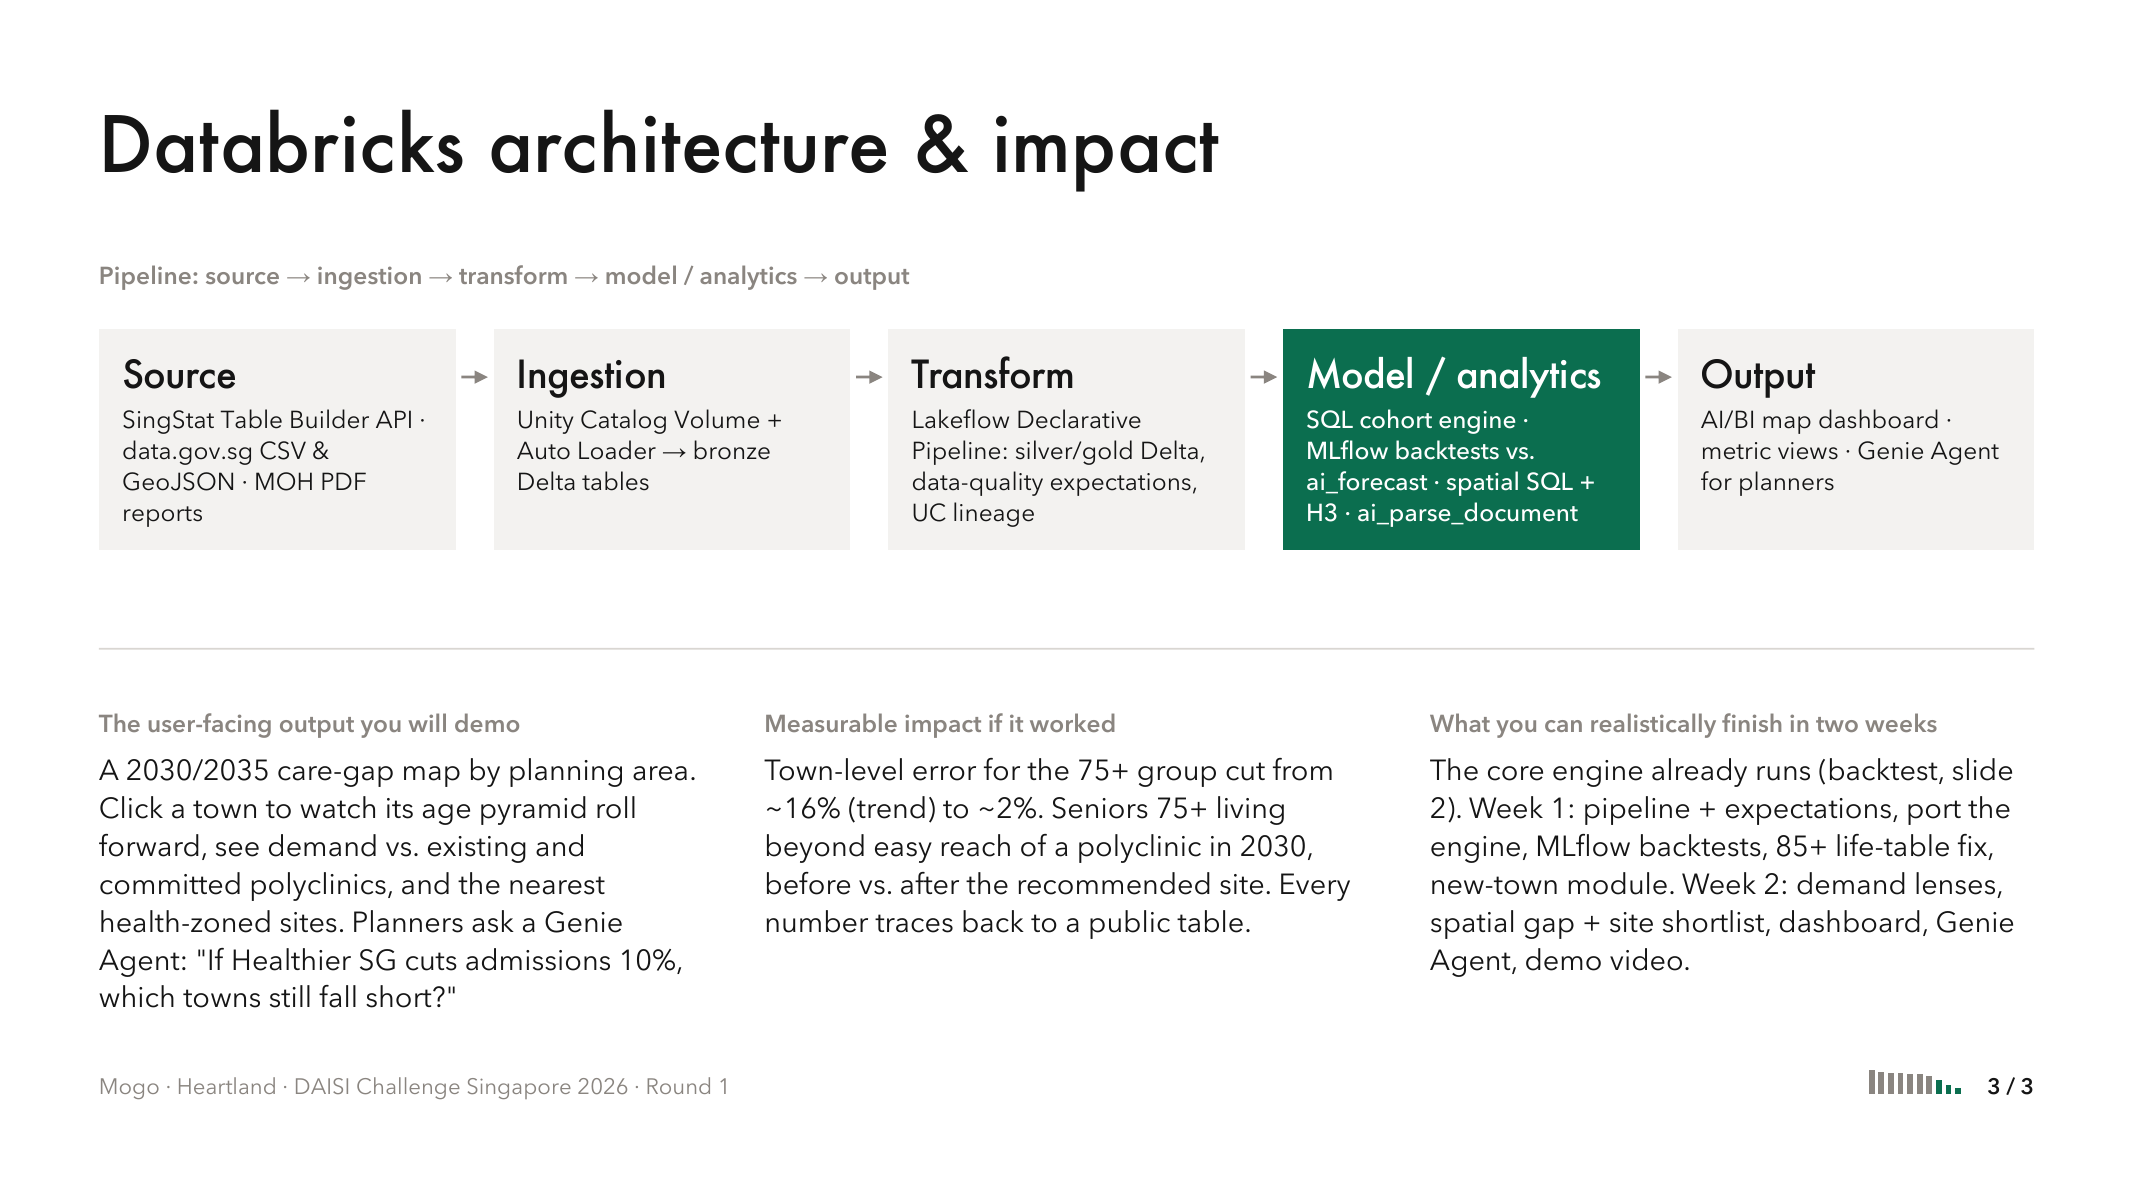
Slide 3 · Databricks architecture & impact: pipeline, demo output, two-week plan
-
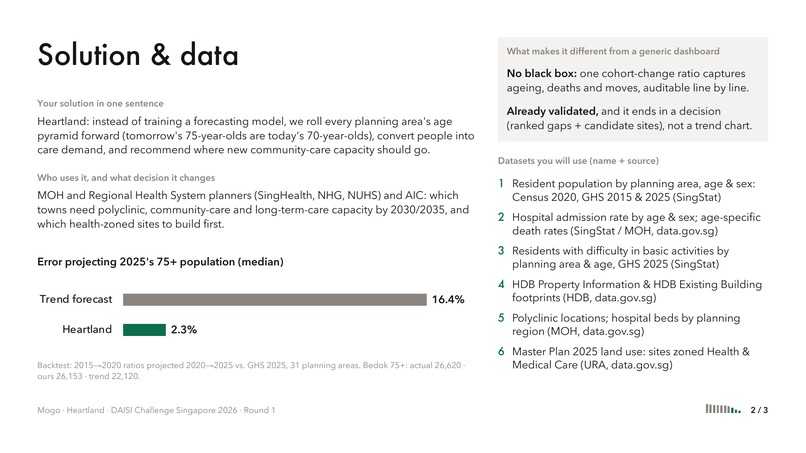
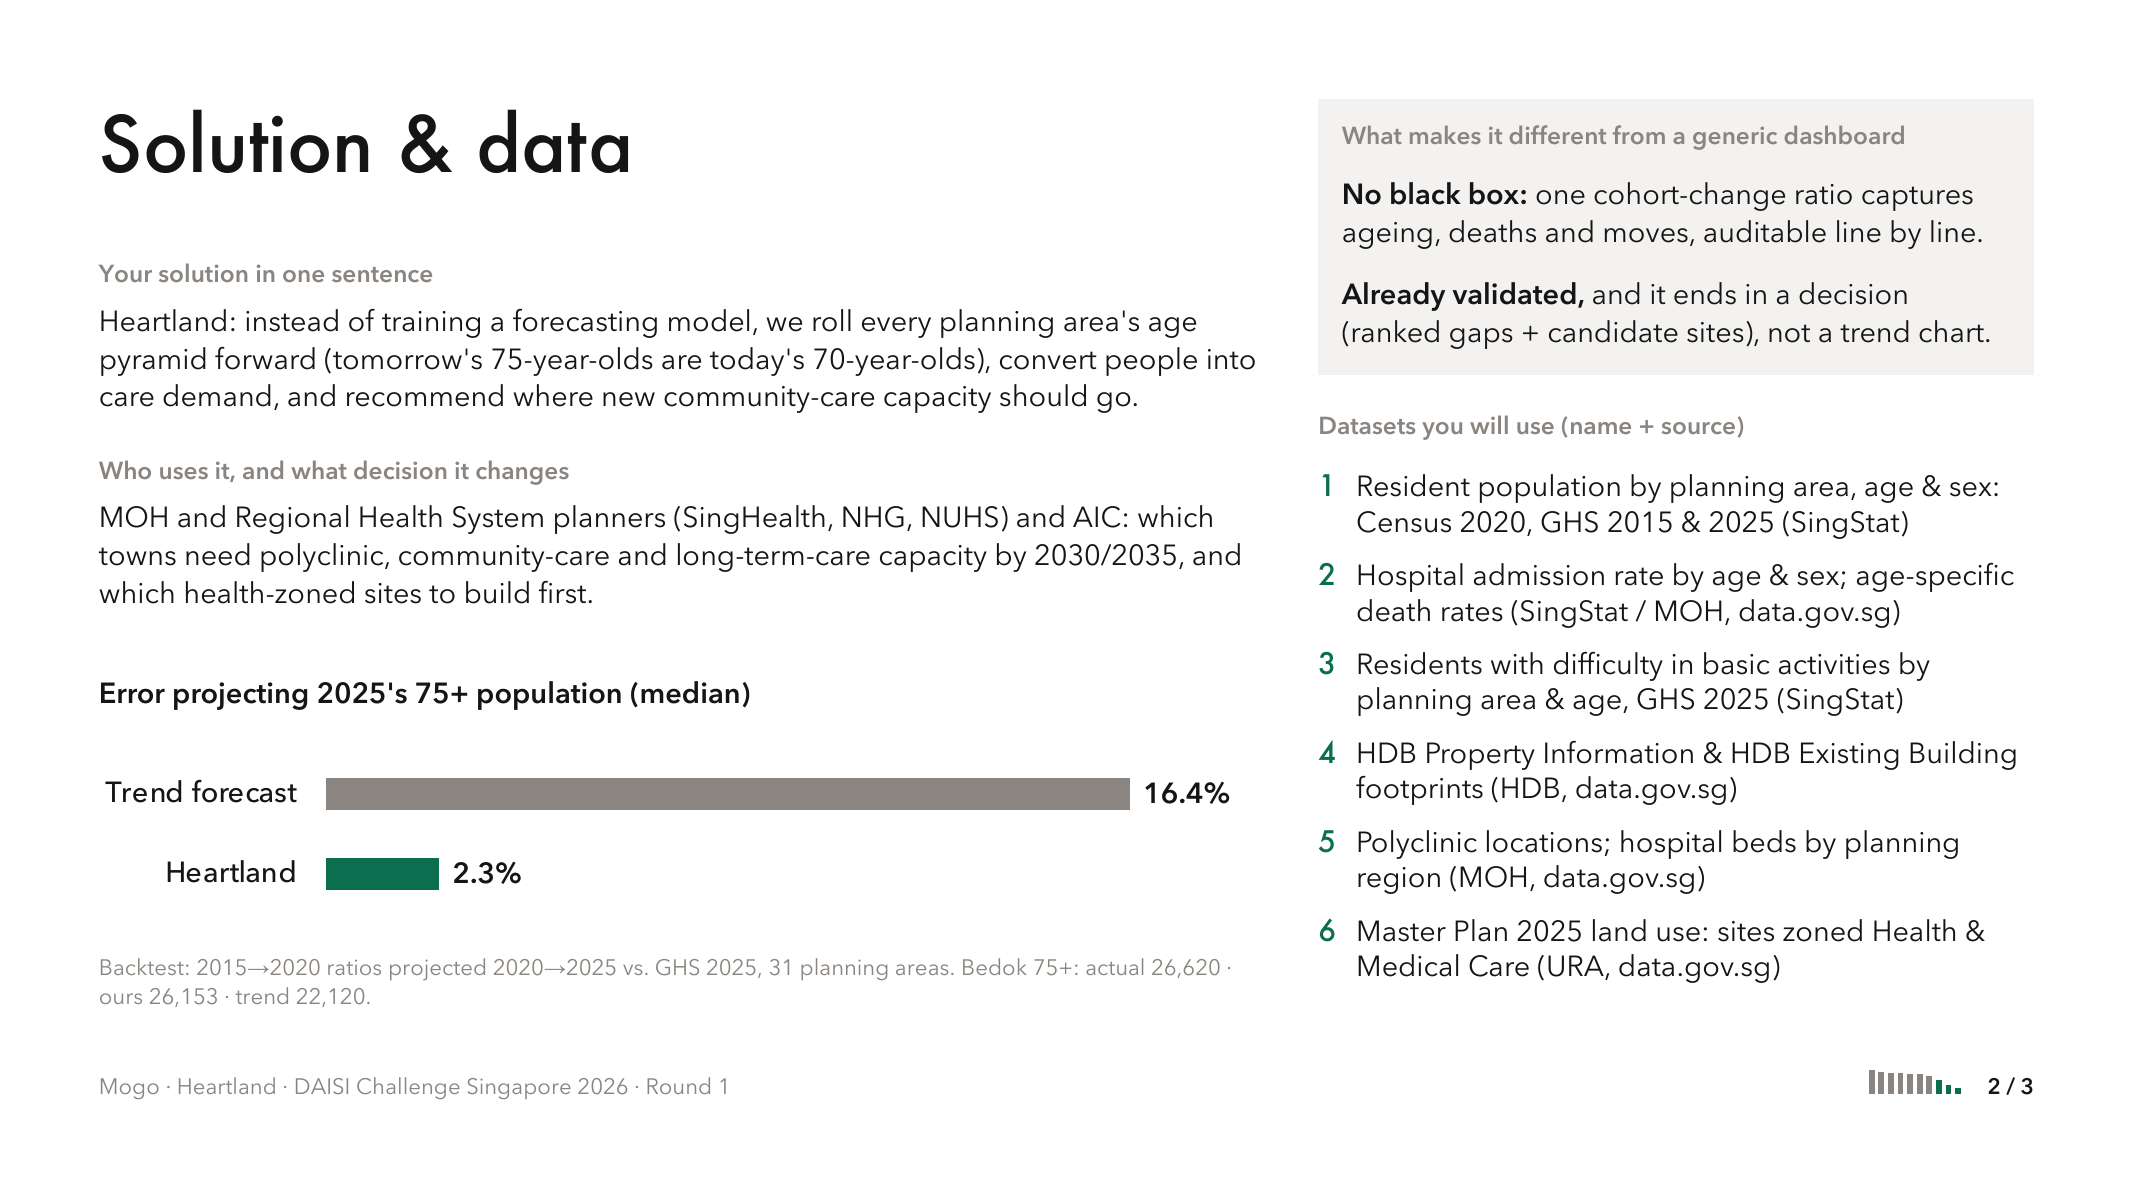
Slide 2 · Solution & data: cohort method vs trend forecast (2.3% vs 16.4% error)
Inspiration
Singapore becomes officially super-aged in 2026, and Healthier SG is moving care out of hospitals and into neighbourhoods. But community-care capacity is still planned mostly from national, trend-based projections that can't see which towns are about to age fastest. Polyclinics and care places take years to plan and build, so siting decisions made now fix the 2030 map, and planning-area projections are exactly where trend forecasts break.
What it does
Heartland projects every planning area's population by age and sex to 2030 and 2035. It doesn't train a forecasting model. It uses cohort-change ratios (the Hamilton–Perry method): tomorrow's 75-year-olds are today's 70-year-olds, and SingStat already counts them by planning area. One ratio per area and age group captures ageing, deaths and moves together, so every number can be audited line by line.
It then:
- converts people into care demand (acute admissions, chronic primary care and long-term care need) using published age-specific rates;
- compares that demand with existing and committed supply (polyclinics, hospital beds by region);
- recommends health-zoned sites (URA Master Plan 2025) where new community-care capacity would close the biggest gaps.
Planners from MOH, the Regional Health Systems (SingHealth, NHG, NUHS) and AIC explore the results on a 2030/2035 care-gap map, and through a Genie Agent they can ask questions such as "If Healthier SG cuts admissions 10%, which towns still fall short?"
Early evidence: a prototype backtest
We used 2015→2020 cohort ratios to project 2020→2025, then checked the result against the General Household Survey 2025 across 31 established planning areas:
| Residents aged 75+ (2025) | Median error |
|---|---|
| Heartland (cohort method) | 2.3% |
| Trend extrapolation | 16.4% |
- The cohort method beat the trend in 29 of 31 planning areas.
- Summed across those areas, a trend forecast would have missed 46,260 seniors aged 75+ (−15.4%). The cohort method was off by +0.5%.
- Bedok's 75+ population was 26,620. The cohort method projected 26,153; the trend projected 22,120.
- Honest limitation: for the open-ended 85+ group, the simple trend does better (2.6% vs 5.6%). We'll switch that group to life-table survival.
Projected forward from 2025, Singapore's residents aged 75+ grow from 302,580 to about 409,000 by 2030 (+35%). Tampines alone adds about 9,500.
How we'll build it (Databricks Free Edition)
- Source: SingStat Table Builder API, data.gov.sg CSV and GeoJSON, MOH PDF reports
- Ingestion: Unity Catalog Volume and Auto Loader → bronze Delta tables
- Transform: Lakeflow Declarative Pipeline into silver/gold Delta tables, with data-quality expectations and Unity Catalog lineage
- Model / analytics:
- SQL cohort engine
- MLflow-tracked backtests against
ai_forecast - spatial SQL with H3
ai_parse_documentto turn MOH tables into data
- Output: AI/BI map dashboard, metric views, and a Genie Agent for planners
Datasets
- Resident population by planning area, age & sex: Census 2020, GHS 2015 & 2025 (SingStat)
- Hospital admission rate by age & sex; age-specific death rates (SingStat / MOH, data.gov.sg)
- Residents with difficulty in basic activities by planning area & age, GHS 2025 (SingStat)
- HDB Property Information & HDB Existing Building footprints (HDB, data.gov.sg)
- Polyclinic locations; hospital beds by planning region (MOH, data.gov.sg)
- Master Plan 2025 land use: sites zoned Health & Medical Care (URA, data.gov.sg)
What's next: the two-week sprint
The core engine already runs.
- Week 1: pipeline and expectations, port the engine to Databricks, MLflow backtests, the 85+ life-table fix, and a module for new towns with no age history (e.g. Tengah).
- Week 2: demand lenses, spatial gap analysis and site shortlist, the dashboard, the Genie Agent, and the demo video.
Built With
- data.gov.sg
- databricks
- databricks-genie
- delta-lake
- h3
- lakeflow
- mlflow
- python
- singstat
- sql
- unity-catalog

Log in or sign up for Devpost to join the conversation.