Inspiration Cardiovascular diseases (CVDs) are the leading cause of death globally, taking an estimated 17.9 million lives each year. While Machine Learning has huge potential in healthcare, there is a major trust gap: doctors are hesitant to use "Black Box" AI models that give a prediction without an explanation.
We were inspired to bridge this gap. We didn't just want to build a model that says "High Risk" or "Low Risk"; we wanted to build a digital assistant that tells a doctor why a patient is at risk. Our goal was to democratize access to computational health tools by creating a transparent, interpretable model using real-world clinical data.
What it does Our project is an Interpretable Heart Failure Risk Predictor.
Prediction: It analyzes clinical records (like age, blood pressure, sodium levels, etc.) to predict the likelihood of a patient surviving.
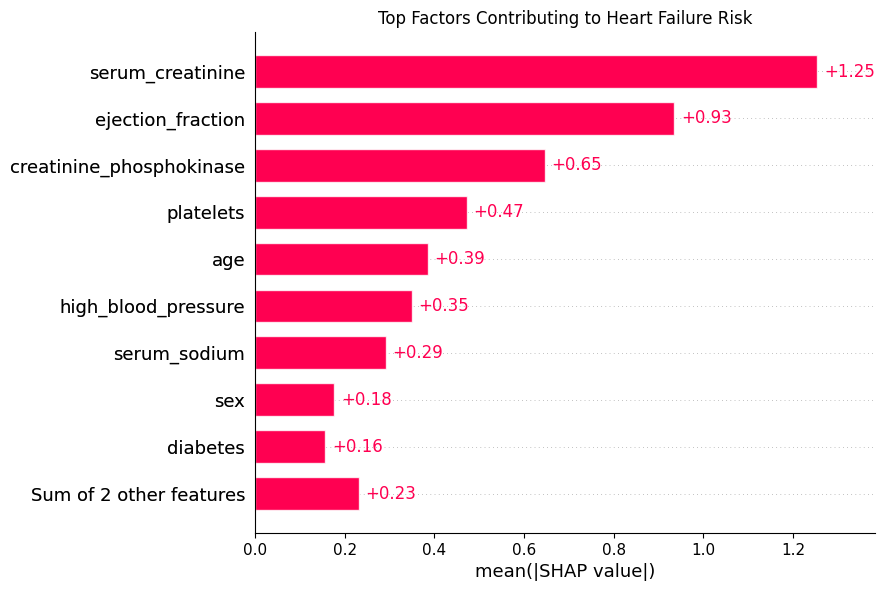
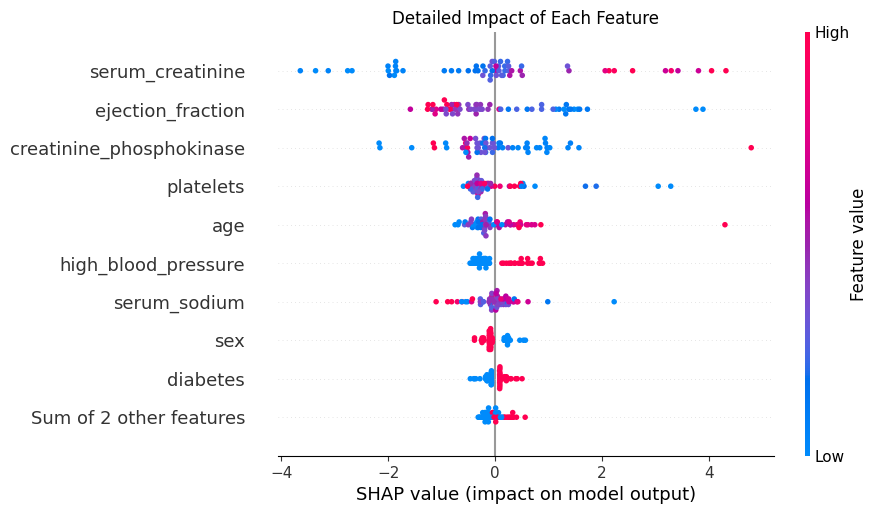
Explainability: Unlike standard models, our solution visualizes the decision-making process. It generates dynamic graphs to show exactly which health markers are contributing to the risk.
For example, it can highlight that a specific patient is at high risk specifically due to high Serum Creatinine levels combined with a low Ejection Fraction.
This transparency empowers medical professionals to validate the AI's findings against their medical knowledge, leading to faster and more confident interventions.
How we built it We focused on a "Unique Dataset" approach to ensure real-world impact.
Data Sourcing: Instead of the default dataset, we sourced the Heart Failure Clinical Records Dataset from the UCI Machine Learning Repository. This dataset contains records of 299 patients with 13 clinical features.
Tech Stack: We used Python within a reproducible Google Colab environment.
The Brain (Model): We implemented a Gradient Boosting Classifier using Scikit-Learn. We chose this over simpler models because of its superior performance on tabular biomedical data.
The "Wow" Factor: We integrated SHAP (SHapley Additive exPlanations) to generate the interpretability layer. This allowed us to create beeswarm plots and feature importance bar charts.
Challenges we ran into Library Conflicts: As we implemented the SHAP visualization, we encountered significant version mismatch errors (AssertionError) that broke our visualization pipeline. We had to debug the plotting functions and adjust our code to ensure compatibility with the Gradient Boosting model.
Medical Context: Understanding the medical significance of features like "Creatinine Phosphokinase" vs. "Serum Creatinine" was challenging. We had to research these terms to ensure our model's findings made medical sense.
Time Constraints: Building, training, and documenting a full ML pipeline in just a few hours was intense!
Accomplishments that we're proud of Medical Alignment: We are incredibly proud that our model independently identified Serum Creatinine and Ejection Fraction as the top two risk factors. This perfectly aligns with established medical literature, proving that our AI is learning actual biological patterns, not just noise.
Interpretability: We successfully moved beyond accuracy metrics. Generating the SHAP Beeswarm plot that visually separates high-risk and low-risk clusters based on feature values was a major milestone for our team.
Reproducibility: We created a clean, executable Google Colab notebook that anyone can run to reproduce our results instantly.
What we learned Explainability is King: In healthcare, a model with 99% accuracy is useless if a doctor can't understand it. We learned how to prioritize trust over raw metrics.
Data Science Pipeline: We learned the end-to-end process of data cleaning, model selection (shifting from Random Forest to Gradient Boosting), and evaluation.
Resilience: We learned how to debug complex library errors under pressure.
What's next for Heart Failure Survival Prediction Web Application: We plan to deploy this model using Streamlit to create a user-friendly frontend where doctors can input patient data and get an instant risk report.
Larger Datasets: We aim to retrain the model on a larger, multi-hospital dataset to improve accuracy beyond 85%.
Personalized Reports: Automated generation of PDF reports for patients explaining their specific risk factors in simple language.
Built With
- google-colab
- matplotlib
- numpy
- pandas
- python
- scikit-learn
- shap

