-
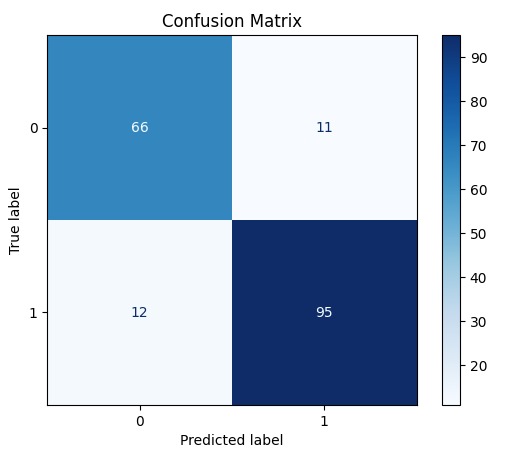
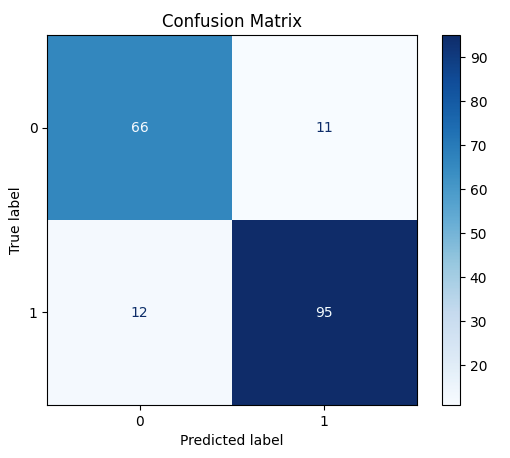
confusion matrix
-

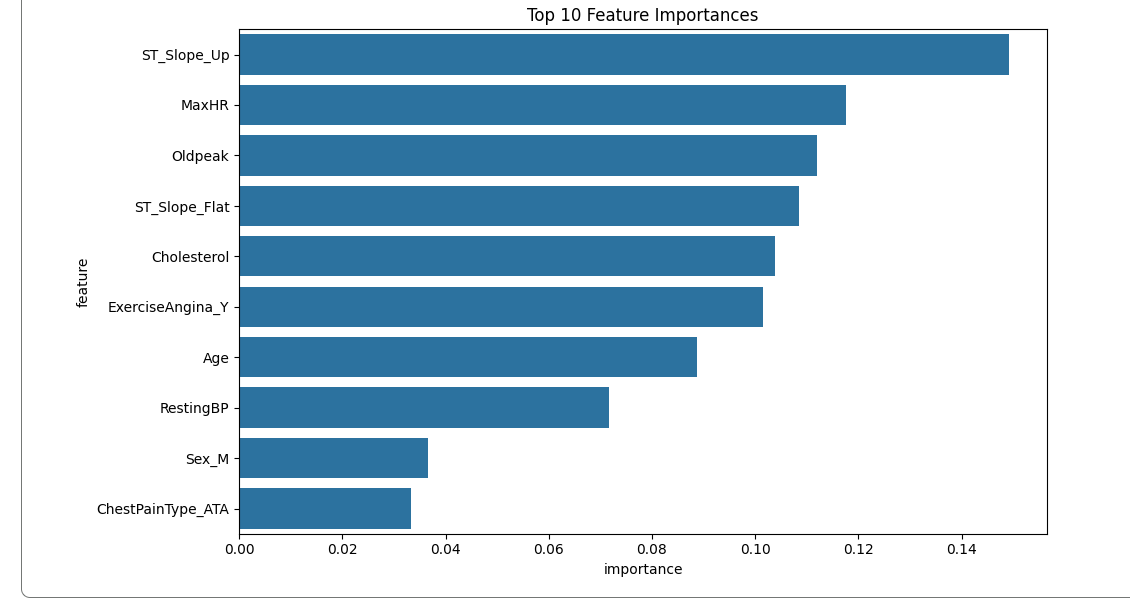
feature importance bar chart
Heart Disease Prediction – Byte 2 Beat Hackathon
Project Overview
This project uses a Random Forest classifier to predict cardiovascular disease risk based on the provided de-identified biomedical dataset. The model achieves 88% accuracy in predicting the presence of heart disease, with key insights into the most important clinical features.
Files
Heart_Disease_Prediction.ipynb– Jupyter/Colab notebook containing all code, from data loading to model evaluation and visualization.README.md– This file, describing the project and how to reproduce it.
Dataset
The dataset (heart_processed.csv) was obtained from the official hackathon Google Drive and contains 918 patient records with the following features:
Numeric Features:
Age– Patient age (years)RestingBP– Resting blood pressure (mm Hg)Cholesterol– Serum cholesterol (mg/dl)FastingBS– Fasting blood sugar (>120 mg/dl, 1 = true, 0 = false)MaxHR– Maximum heart rate achievedOldpeak– ST depression induced by exercise relative to rest
Target Variable:
HeartDisease– Presence of heart disease (1 = yes, 0 = no)
Categorical Features (one-hot encoded as boolean):
Sex_M– Gender (male = True, female = False)ChestPainType_ATA,ChestPainType_NAP,ChestPainType_TA– Types of chest painRestingECG_Normal,RestingECG_ST– Resting electrocardiogram resultsExerciseAngina_Y– Exercise-induced angina (yes = True)ST_Slope_Flat,ST_Slope_Up– Slope of the peak exercise ST segment
Approach
- Data Loading & Exploration – Loaded the CSV, inspected structure, checked for missing values (none found), and computed basic statistics.
- Preprocessing – Separated features (
X) and target (y). No missing value imputation needed as dataset was clean. - Model Training – Split data into training (80%) and test (20%) sets. Trained a Random Forest classifier with 100 trees.
- Evaluation – Calculated accuracy on test set and produced a classification report.
- Interpretation – Visualized feature importance to understand which factors most influence predictions.
Results
- Accuracy: 0.88 on the test set (184 samples)
Classification Report: precision recall f1-score support 0 0.85 0.86 0.85 77 1 0.90 0.89 0.89 107 accuracy 0.88 184
- Top 5 Most Important Features:
ST_Slope_Up– importance: 0.149MaxHR(Maximum Heart Rate) – importance: 0.118Oldpeak(ST depression) – importance: 0.112ST_Slope_Flat– importance: 0.108Cholesterol– importance: 0.104
The model shows strong performance with balanced precision and recall for both classes, indicating reliable prediction capability. ST segment slope features and maximum heart rate emerge as the strongest predictors of heart disease.
How to Run
- Open the notebook in Google Colab.
- Run the first cell and upload
heart_processed.csvwhen prompted. - Run all remaining cells sequentially (Runtime → Run all).
- View the outputs, including accuracy, classification report, and feature importance plot.
Dependencies
- Python 3.x
- pandas
- numpy
- matplotlib
- seaborn
- scikit-learn
All libraries are pre-installed in Google Colab; no additional setup required.
Submission Details
- Participant: Usman Ahmad
- Date:26 February 2026
- Hackathon: Byte 2 Beat by Hack4Health
- Eligibility: Verified student (age 13+), joined Discord, and invited one participant as per prize requirements.
This project was created for the Byte 2 Beat hackathon to promote accessible computational health innovation among students.
Built With
- google-colab
- matplotlib
- numpy
- pandas
- python
- scikit-learn
- seaborn


Log in or sign up for Devpost to join the conversation.