-
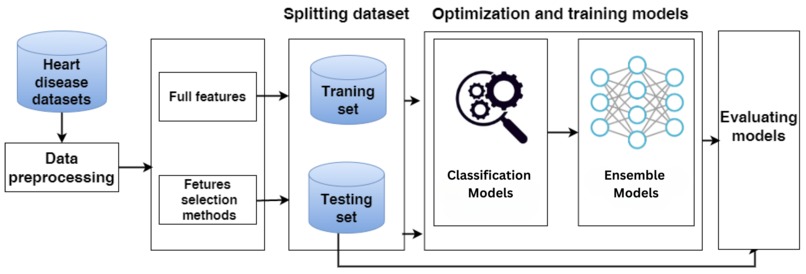
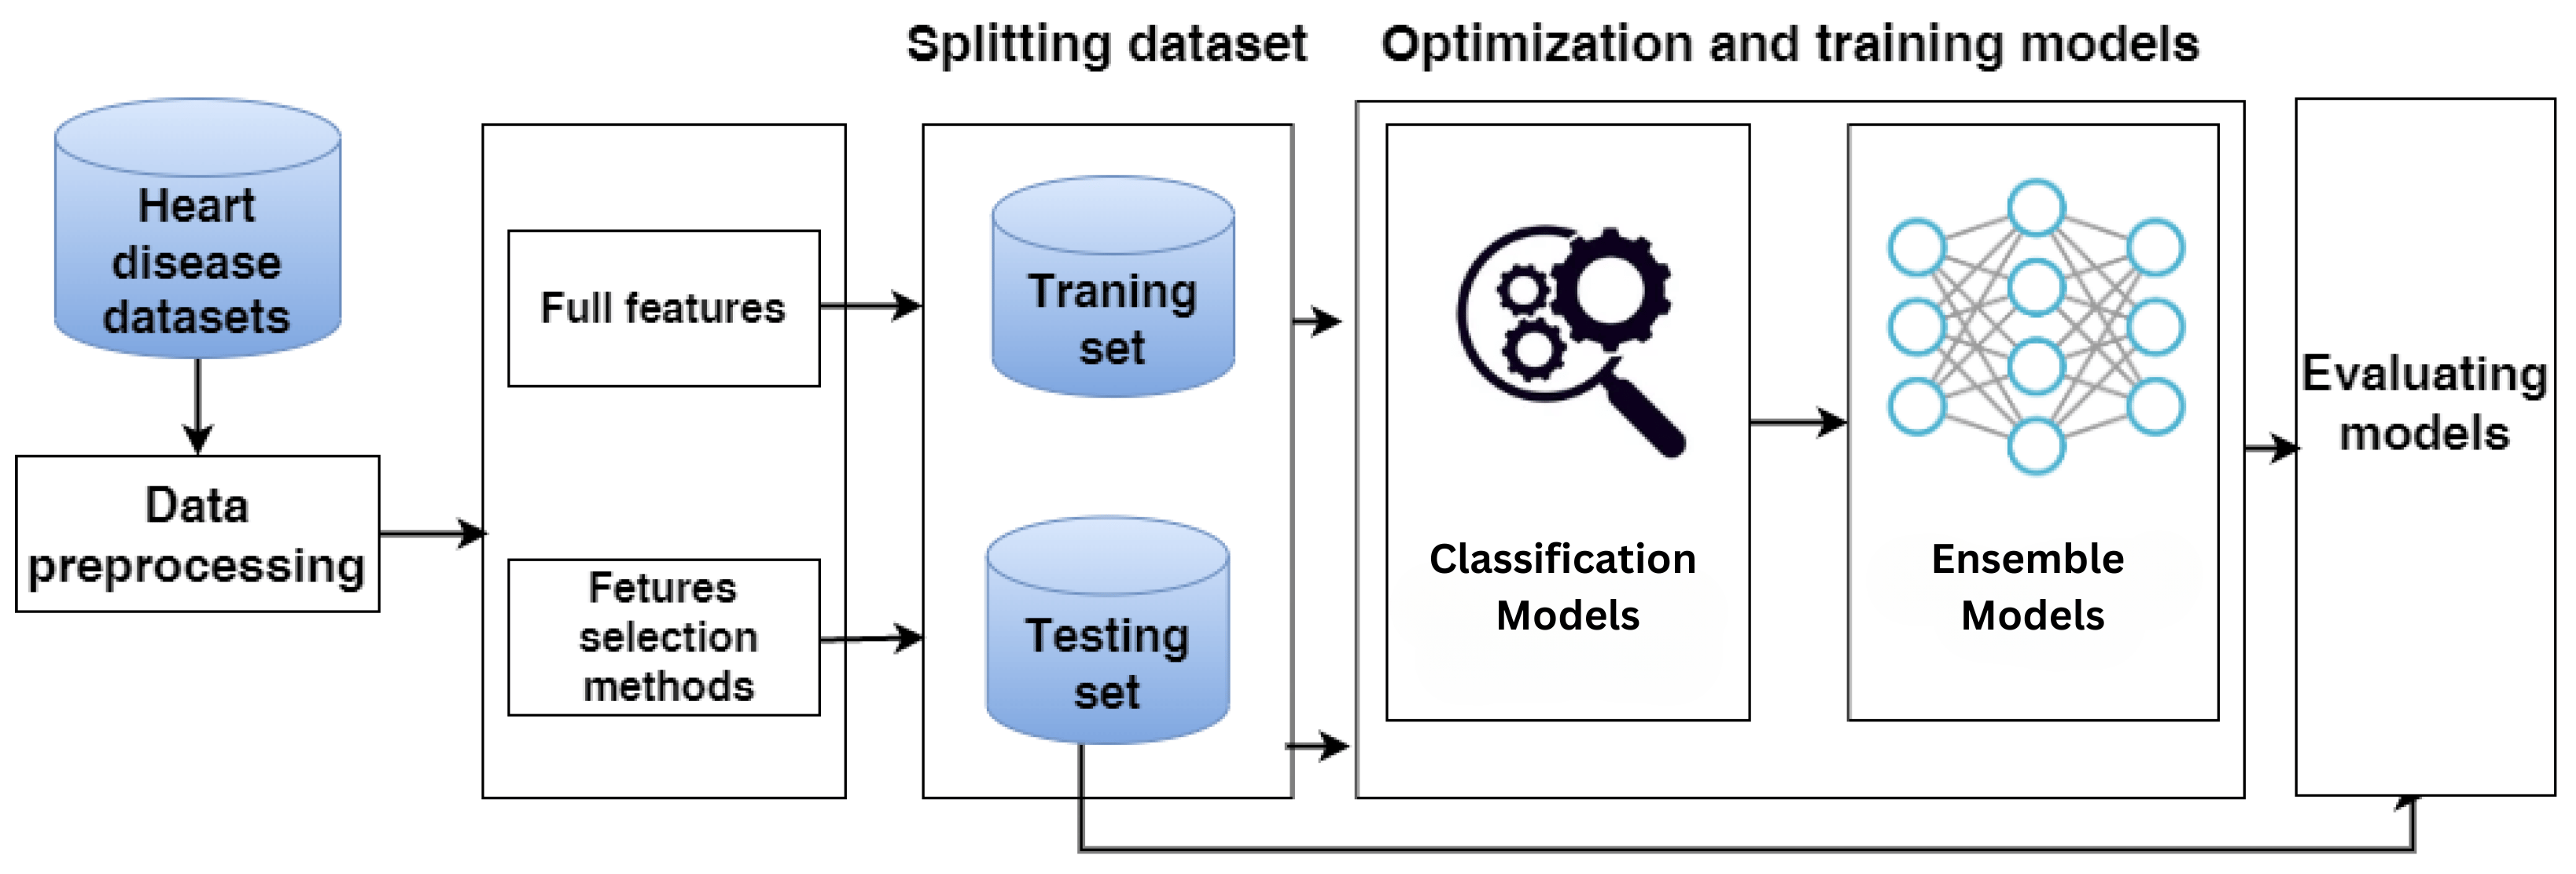
Heart Disease Prediction architecture diagram
-
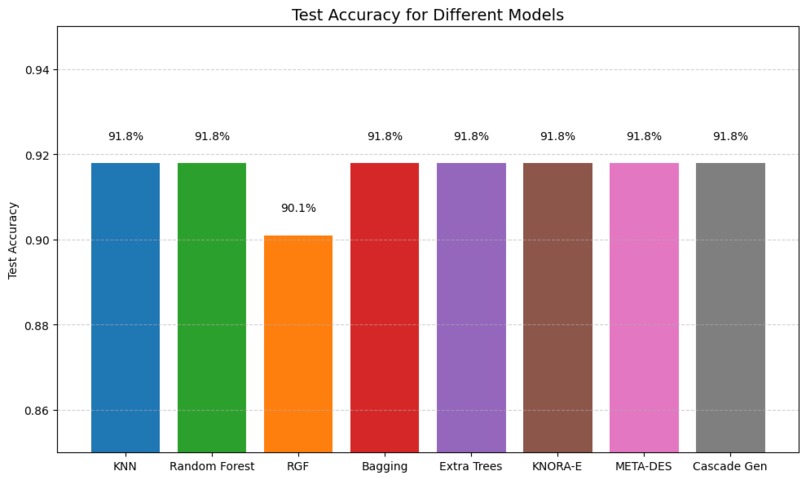
Accuracy scores of different base and ensemble models
-

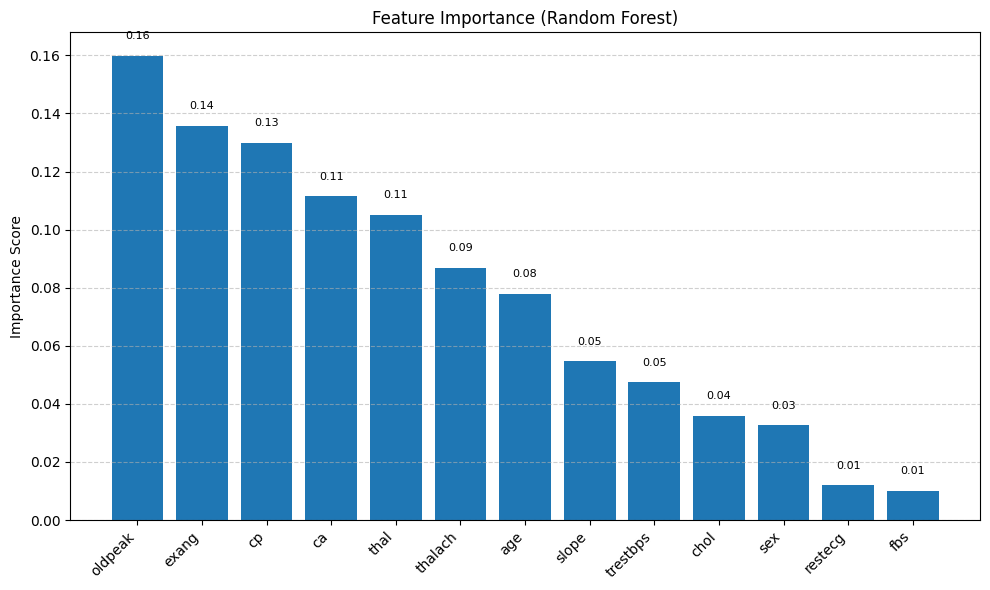
Feature Importance scores of Random Forest
-
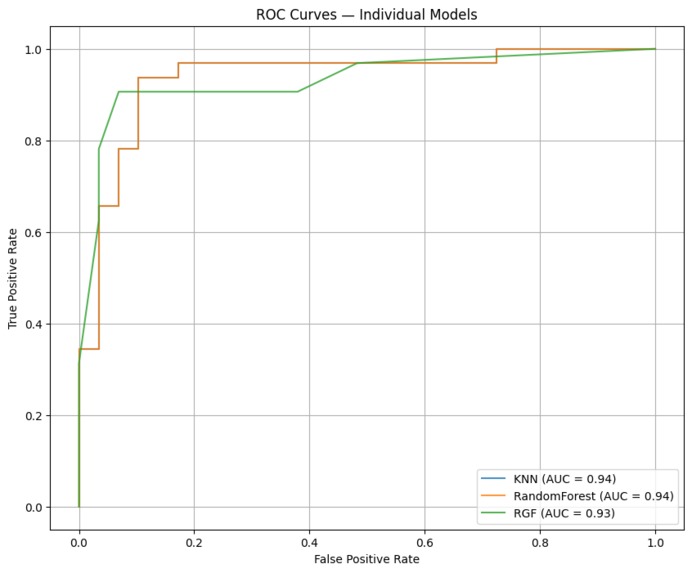
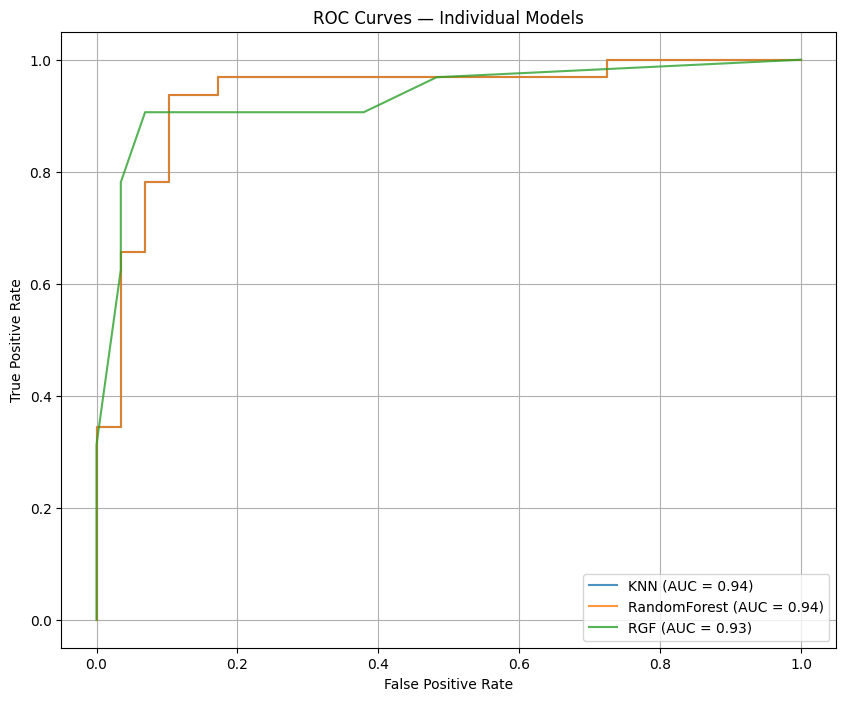
ROC curves of base models
-
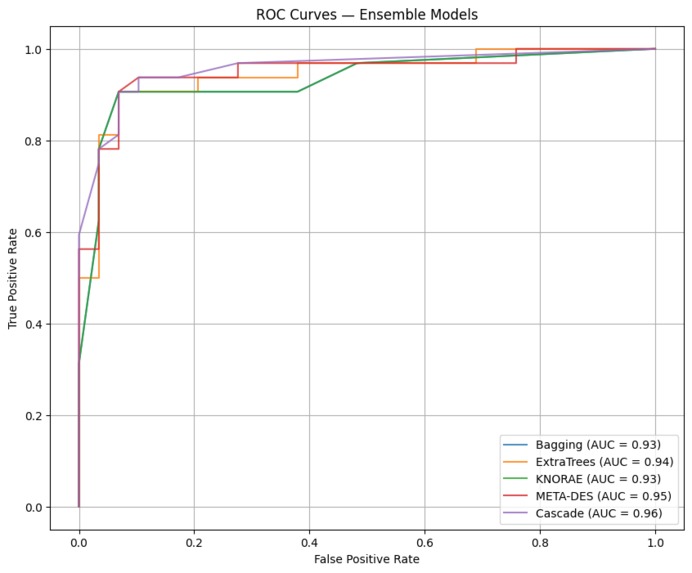
ROC curves of ensemble models


Inspiration
Cardiovascular disease is a leading cause of mortality worldwide. Early detection using routinely collected clinical measurements could substantially reduce morbidity and mortality by enabling timely clinical intervention. We were motivated to build a practical, data-driven screening aid that leverages the strengths of multiple machine learning methods to improve prediction reliability while remaining interpretable for clinicians.
What it does
This project ingests standard clinical features from patient records (age, sex, chest pain type, resting blood pressure, cholesterol, fasting blood sugar, ECG results, max heart rate, exercise-induced angina, ST depression, slope, number of major vessels, and thalassemia) and returns a binary prediction of heart disease presence. The system evaluates multiple base classifiers and several ensemble strategies; the stacked (cascade) ensemble produced the best discrimination on the test split (accuracy ~91.8%, ROC-AUC = 0.96).
How I built it
Data and preprocessing: We used the UCI Cleveland Heart Disease dataset (commonly used 14-attribute subset). Preprocessing included shifted ordinal encoding for ordinal categorical fields, explicit missing-value indicators for ca and thal, binarization of the target, and z-score standardization for continuous variables. We used an 80/20 train/test split for evaluation.
Base models: K-Nearest Neighbors (KNN), Random Forest (with GridSearchCV tuning), and Regularized Greedy Forest (RGF).
Ensembles: Bagging, Extra Trees, dynamic selection (KNORA-E), META-DES (meta-learning for dynamic selection), and Cascade Generalization (stacking with RGF as a meta-learner).
Evaluation and visualization: Models were compared using confusion matrices, accuracy, precision, recall, F1, and ROC-AUC. We produced ROC curves, feature-importance charts, and confusion-matrix visualizations to communicate results.
Challenges I ran into
Limited dataset size and class balance: The Cleveland dataset is relatively small, which increases the risk of overfitting and limits confidence in generalization without external validation.
Missing and inconsistent coding: ca and thal contained missing/inconsistent values that required explicit handling to avoid misleading imputation.
Hyperparameter search cost: Tuning multiple models and ensembles required careful experimental design to avoid excessive compute while still achieving robust results.
Accomplishments that I'm proud of
Built a full end-to-end pipeline from preprocessing to evaluation with reproducible scripts and notebooks.
Demonstrated that ensemble strategies consistently outperformed individual classifiers on this dataset, with Cascade Generalization achieving the best overall discrimination (ROC-AUC = 0.96 and test accuracy ≈ 91.8%).
Identified clinically meaningful predictors: ST depression (oldpeak), exercise-induced angina (exang), and chest pain type (cp), which align with established medical understanding.
Implemented dynamic selection methods (KNORA-E, META-DES) to adaptively select competent classifiers per instance, improving local decision robustness.
What I learned
Diverse base learners and stacking/stacked ensembles can provide tangible improvements in discrimination on tabular clinical datasets.
Explicit treatment of missingness (as an informative signal) and preserving ordinal encodings improves downstream model performance and stability.
Dynamic ensemble selection and meta-learning approaches are effective when cases vary in local difficulty, but they require validation and careful calibration.
What's next for Heart Disease Prediction using Ensemble Learning
External validation: Evaluate the pipeline on larger, multi-institutional cohorts to test generalization and robustness.
Explainability integration: Add SHAP/LIME explanations and per-prediction audit logs to support clinician decision making.
Hyperparameter optimization: Use Bayesian optimization or metaheuristic methods (e.g., PSO) to further refine model performance.
Deployment: Package the model into a lightweight web service with an API and clinician UI that displays prediction, confidence, and interpretable feature explanations.
Built With
- deslib
- jupyter-notebook
- kaggle
- matplotlib
- numpy
- pandas
- python
- rgf-python
- scikit-learn


Log in or sign up for Devpost to join the conversation.