-
-

Analysis report
Inspiration
Cardiovascular diseases (CVDs), also known as heart and blood vessel diseases have become the number one cause of death in the world. This disease has claimed about 17.9 million lives in a year, which means it accounts for 31% of deaths worldwide. 4 out of 5 CVDs are caused by heart disease and stroke, and people under the age of 70 accounts for a third of deaths from heart disease and stroke.
What it does
our project is an exploratory data analysis type project. That means, our project shows a report on the correlation of several attributes with heart disease.
How we built it
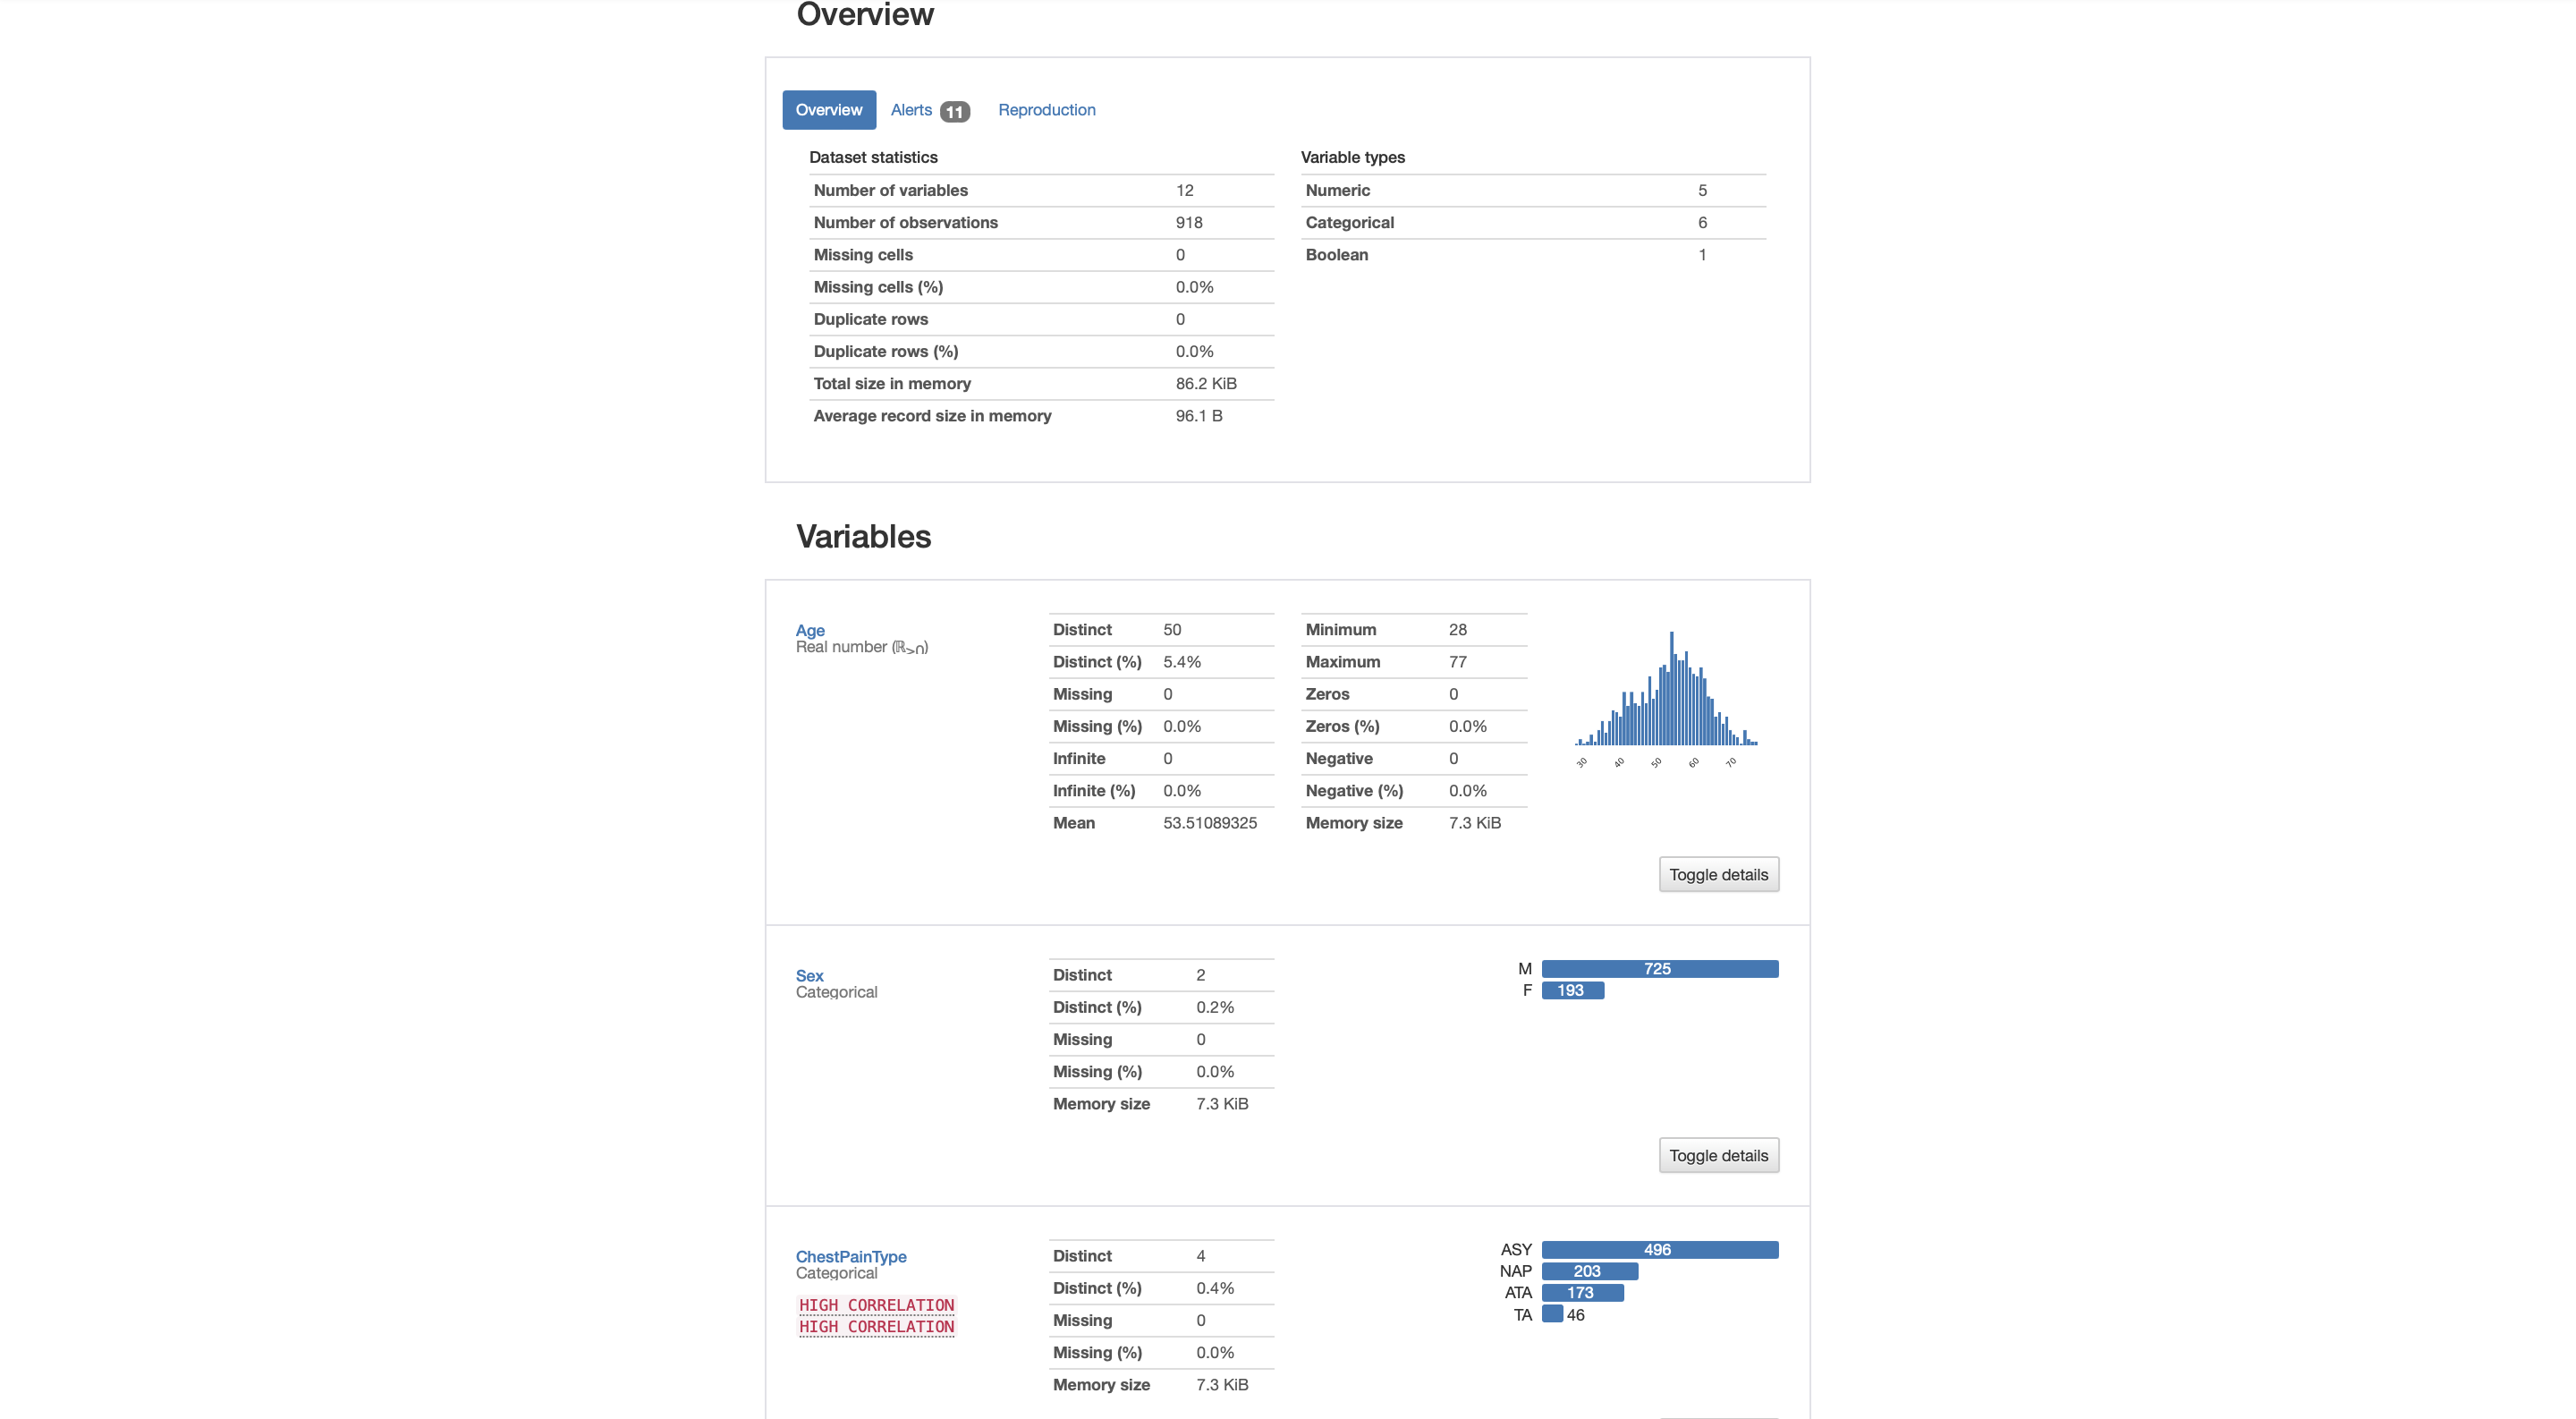
We built this project using the python language with the pandas library to read the .csv file and pandas_profiling to show the analysis result report.
The dataset we use is a set of heart failure data. The dataset consists of attributes such as age, sex, chest pain type, resting blood pressure, serum cholesterol, fasting blood sugar, resting electrocardiogram results, maximum heart rate achieved, exercise-induced angina, old peak, the slope of the peak exercise ST segment, and the output class (whether the subject has heart disease or not) of 918 distinct observations.
Fedesoriano. (September 2021). Heart Failure Prediction Dataset. Retrieved on 27/08/2022 from https://www.kaggle.com/fedesoriano/heart-failure-prediction
Challenges we ran into
As this is our first data analytics project, we have so many things to learn. Starting from how to gather a suitable dataset for the analysis, how to import the Kaggle datasets to Google Colaboratory, and how to read the analysis report to find a solution to the problem we want to solve.
Accomplishments that we're proud of
Since this is our first hackathon on data analysis, we are quite proud to be able to learn the basics of data analysis using programming in a fairly short time.
What we learned
From this project, we learned how to find suitable data for a case, process data, and analyze it based on our purpose. We also learned how to implement the python pandas library to analyze the data and how to visualize it in a form of a neat report.
What's next for Heart Disease EDA
As our projects are still incomplete, our next task would be applying predictive analytics using the Logistic Regression (LR) model. Besides that, we also plan to gather more datasets for the model training to get more accurate results.


Log in or sign up for Devpost to join the conversation.