Description
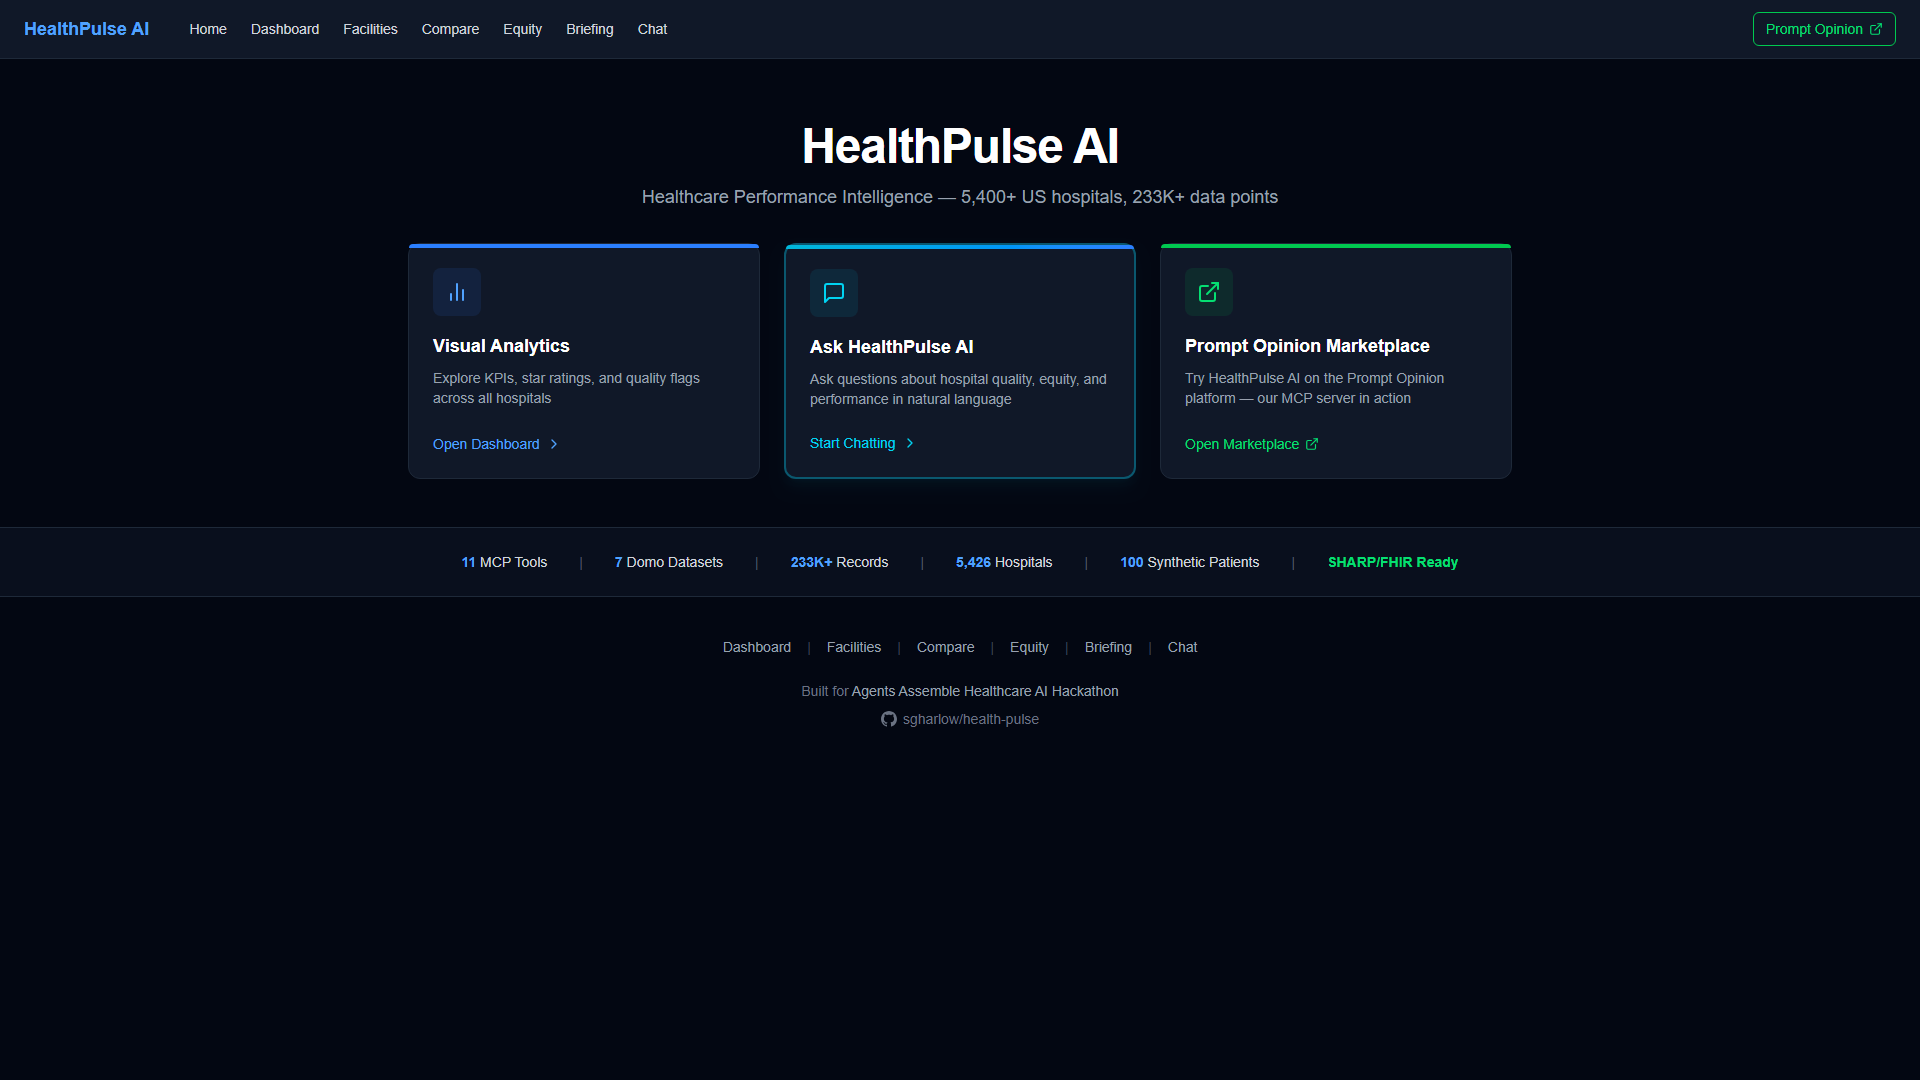
HealthPulse AI is a production-deployed MCP server and interactive dashboard that gives AI agents eleven healthcare analytics tools backed by 233,000+ rows of real CMS hospital quality data across 5,400+ US facilities and 100 synthetic FHIR patients. It spans six analytical dimensions — quality anomaly detection, care gap identification, health equity analysis, patient experience scoring, cost efficiency correlation, and patient-level FHIR drill-down — connected through a conversational chat interface, AI narrative briefings with PDF export, and the Prompt Opinion marketplace.
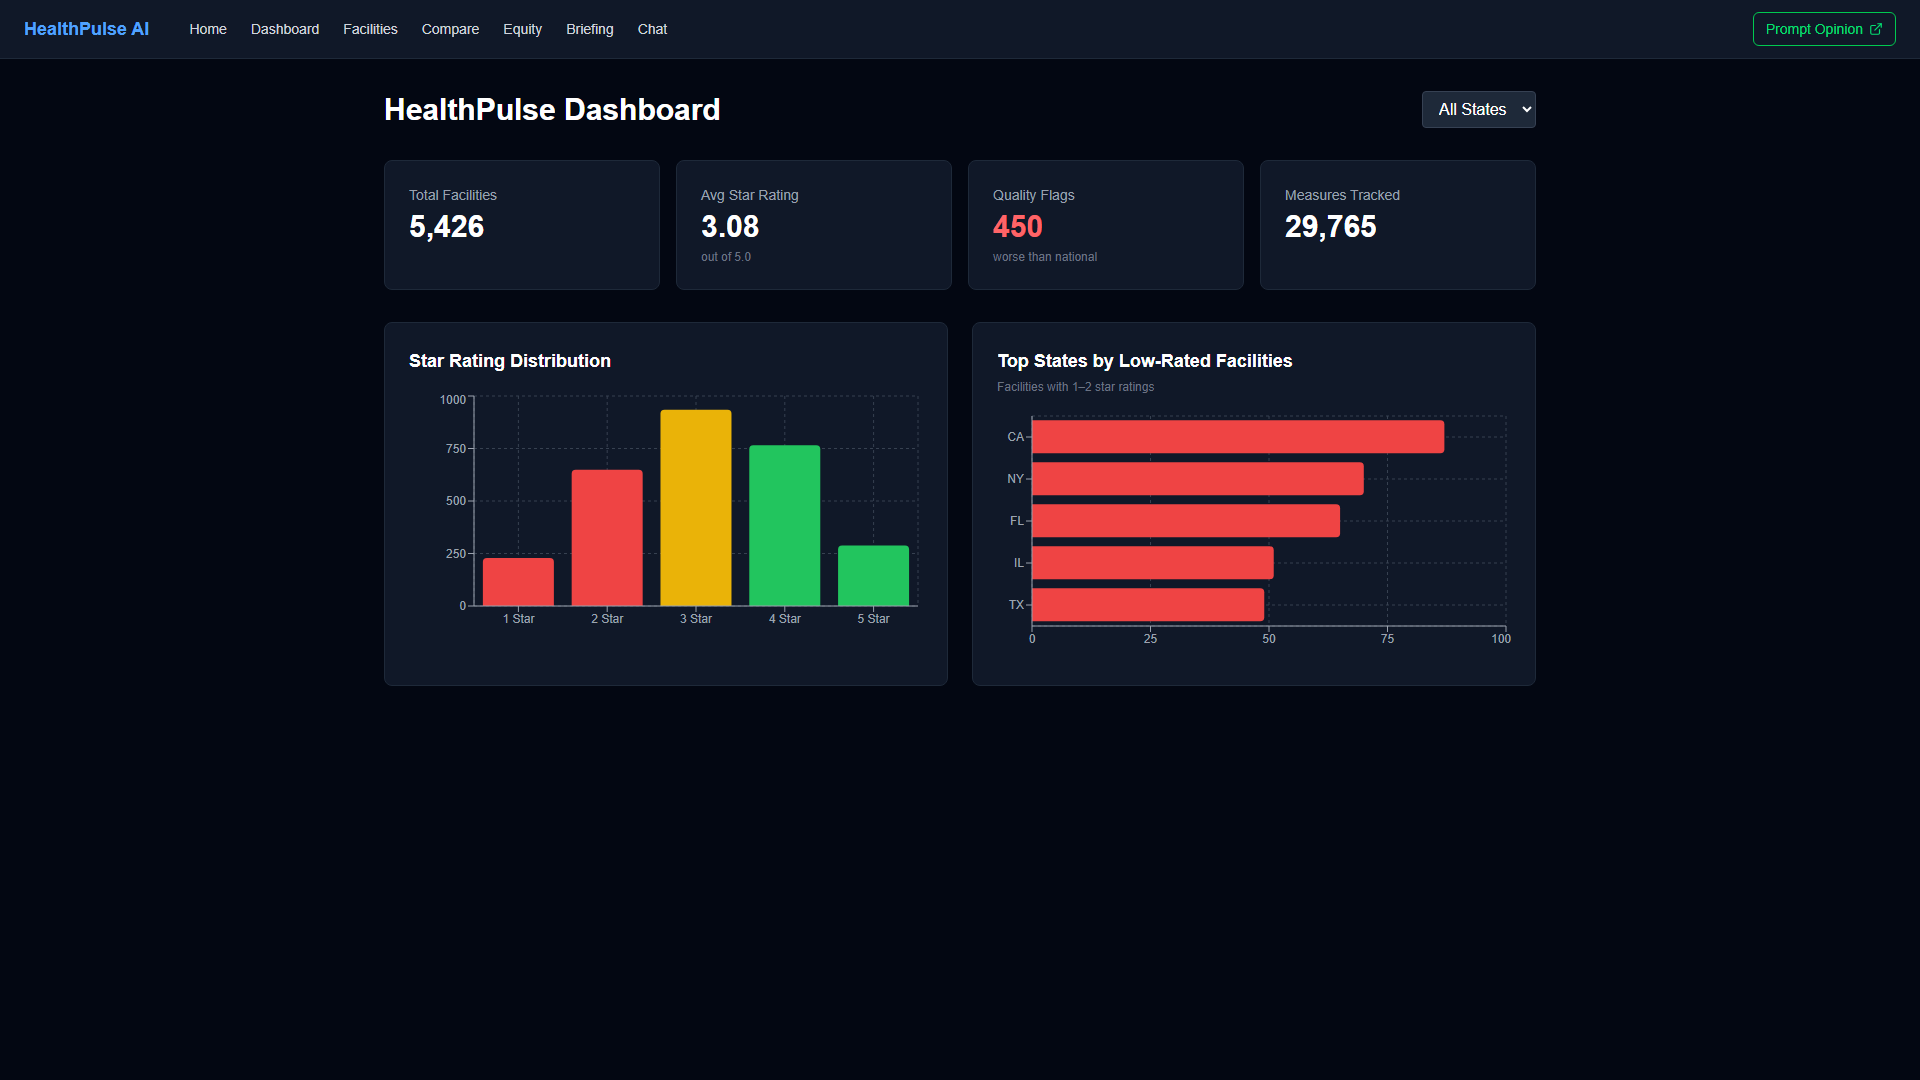
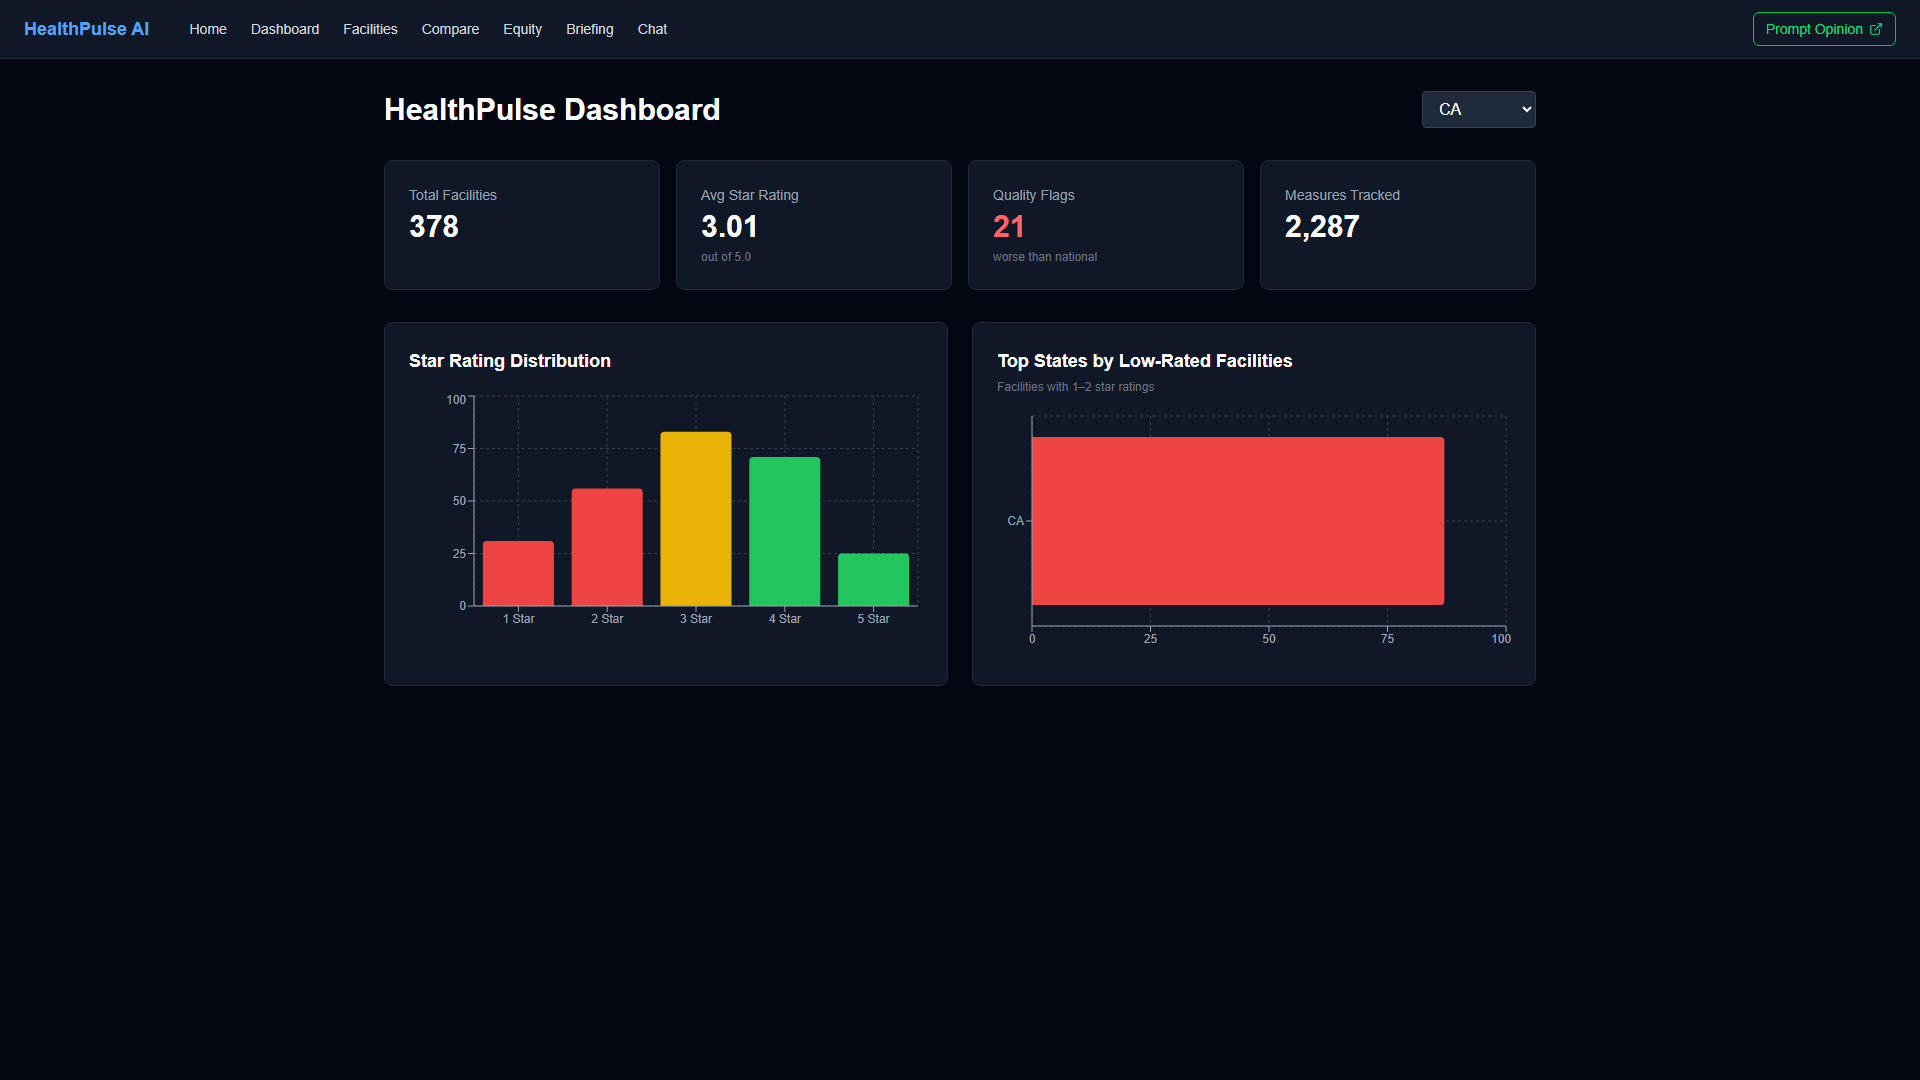
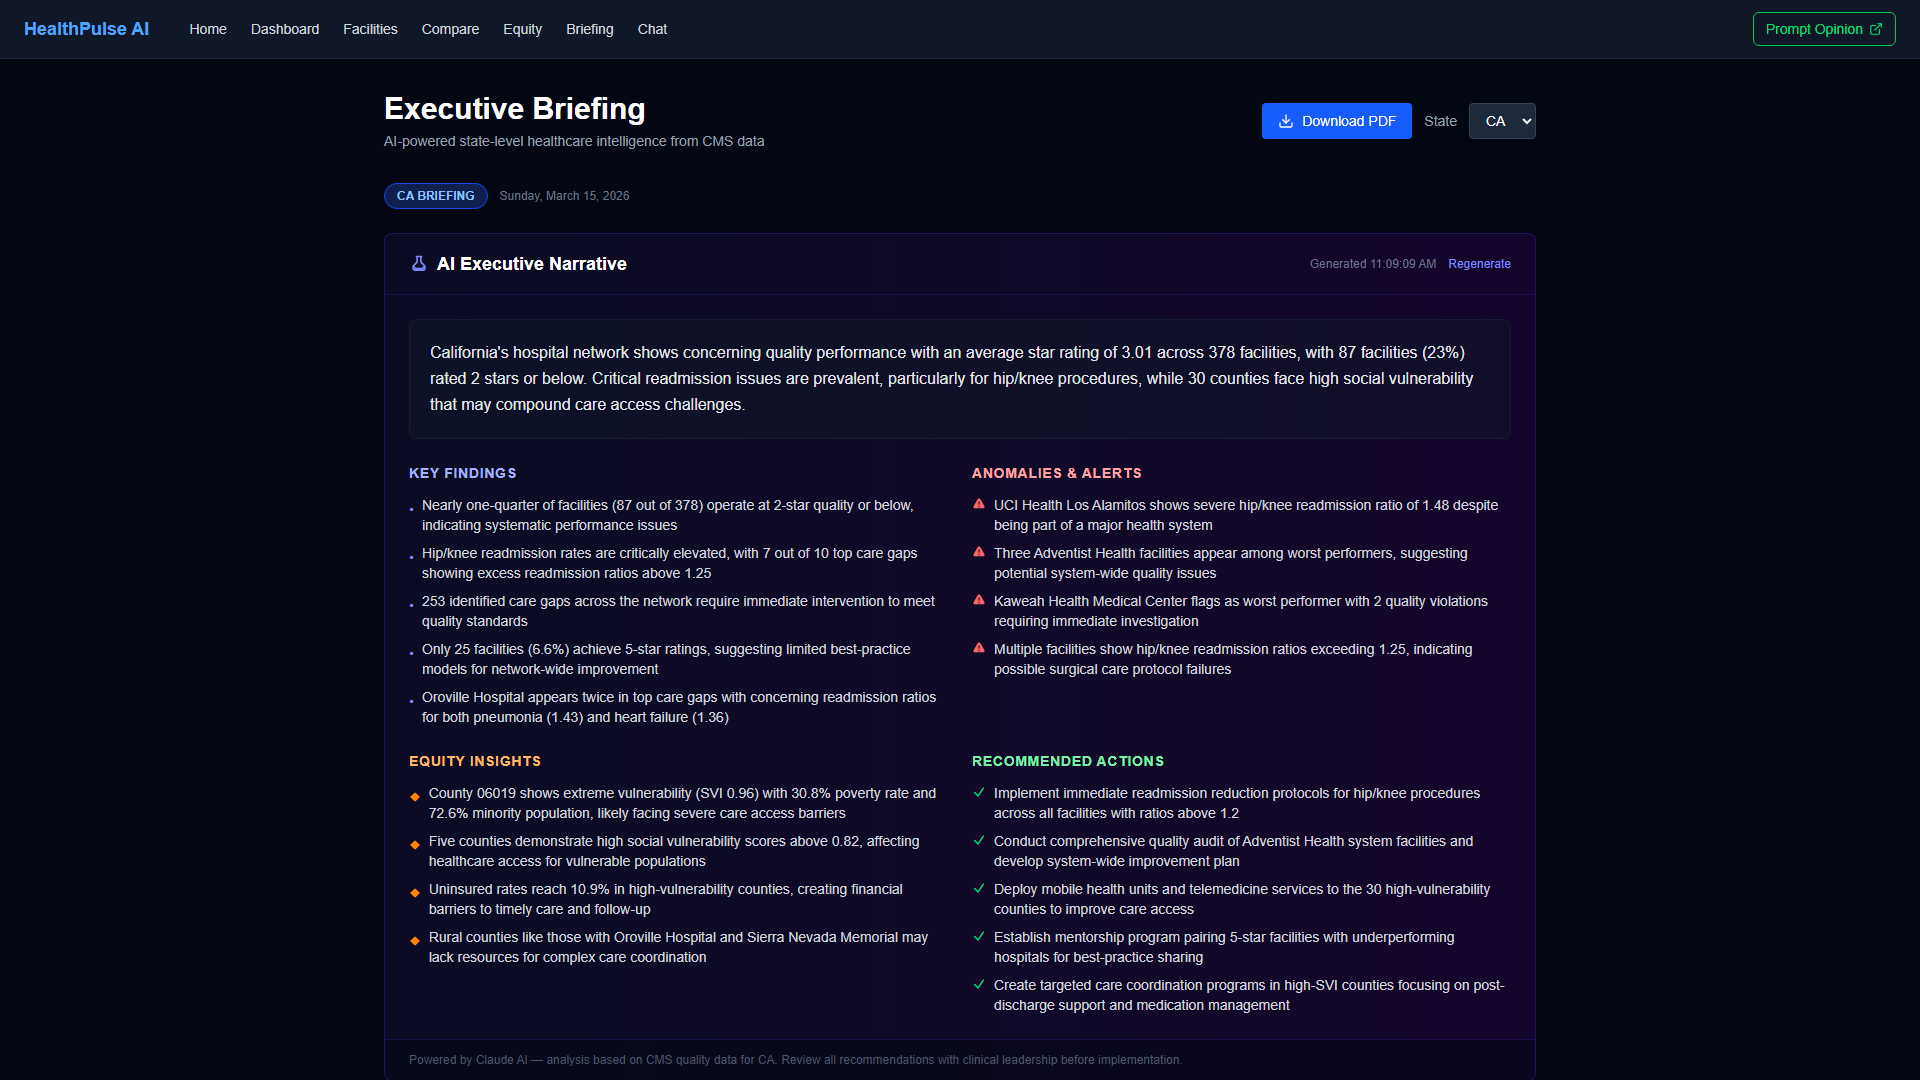
Traditional hospital quality dashboards display data. HealthPulse AI reasons about it. The quality_monitor tool computes Z-scores across every hospital in a state and surfaces statistical outliers that threshold-based alerts would miss — 110 critical anomalies found in California alone. The cross_cutting_analysis tool evaluates facilities across all six dimensions simultaneously: in Florida, 94 of 222 hospitals (42%) have two or more compounding risk factors, a pattern invisible to siloed reporting. The cost_efficiency tool correlates Medicare Spending Per Beneficiary with CMS star ratings, revealing facilities that prove quality and efficiency coexist — and those where they diverge.
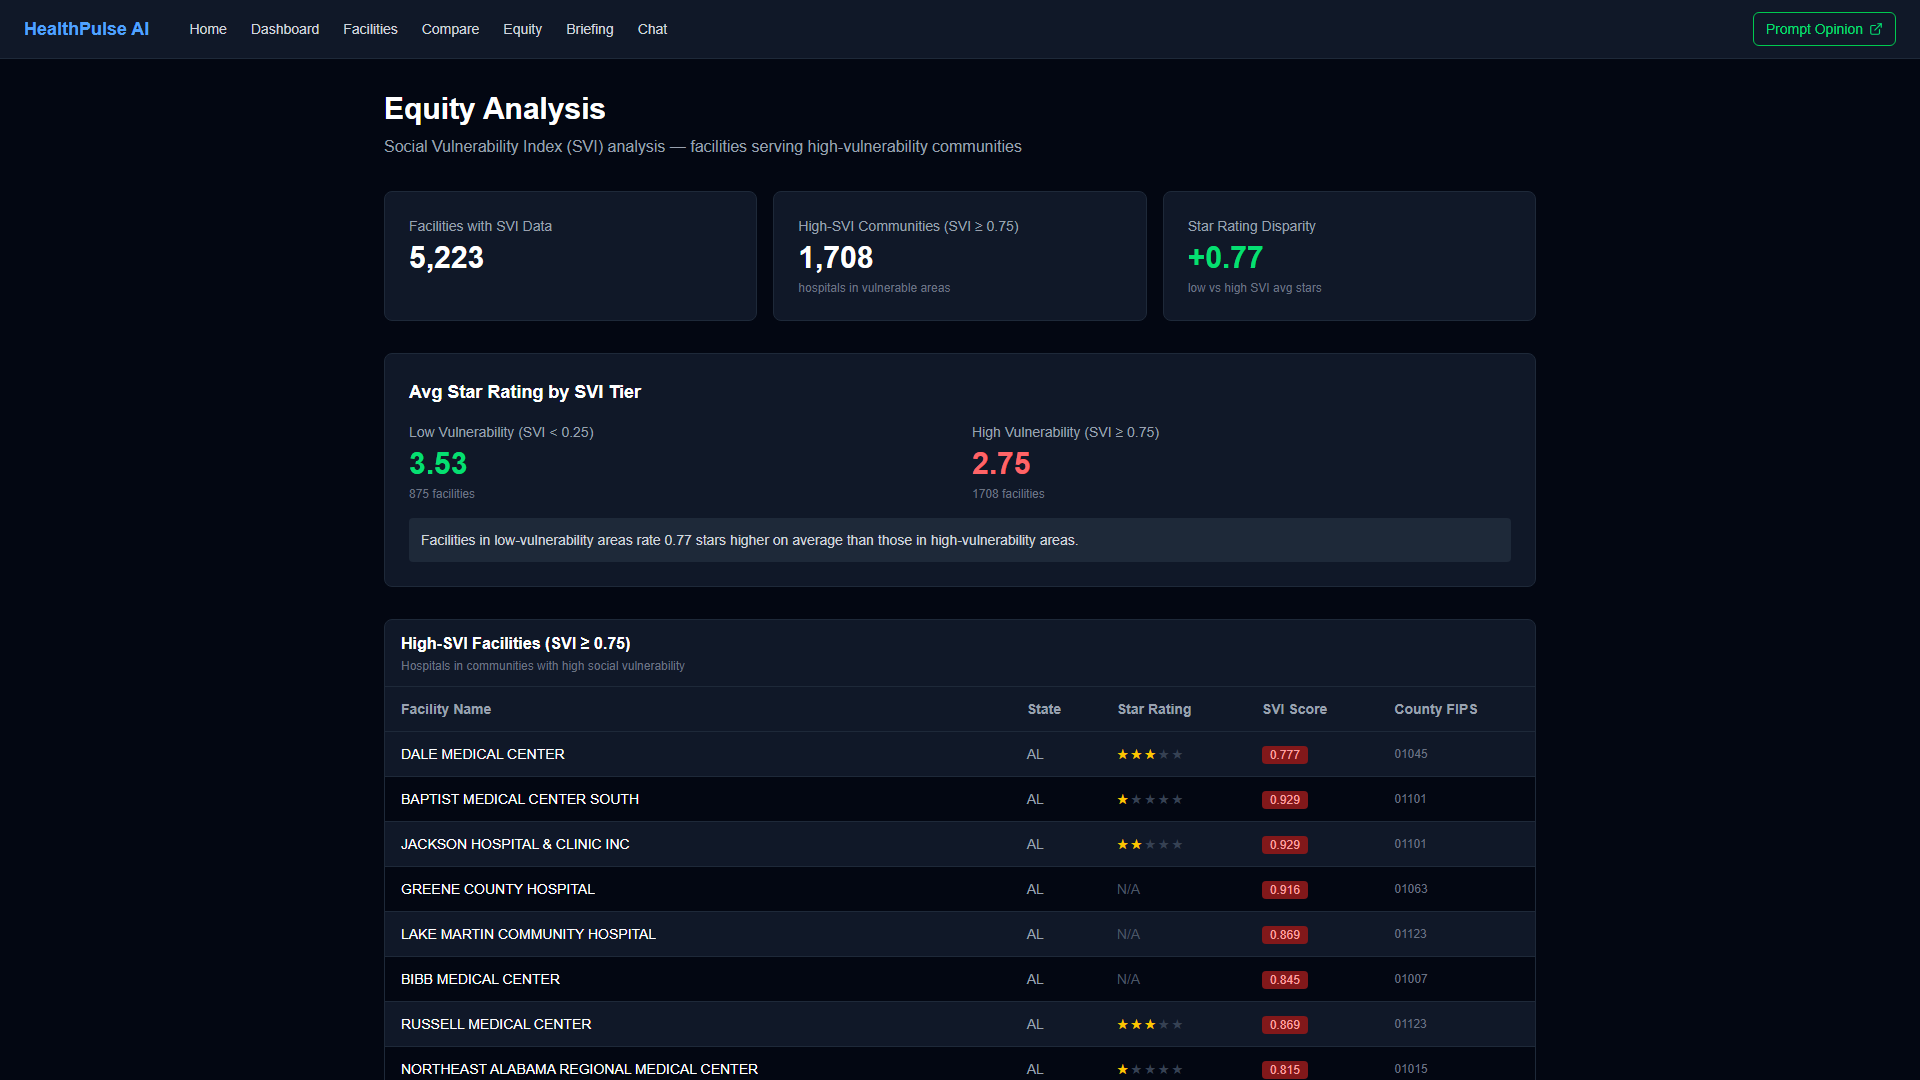
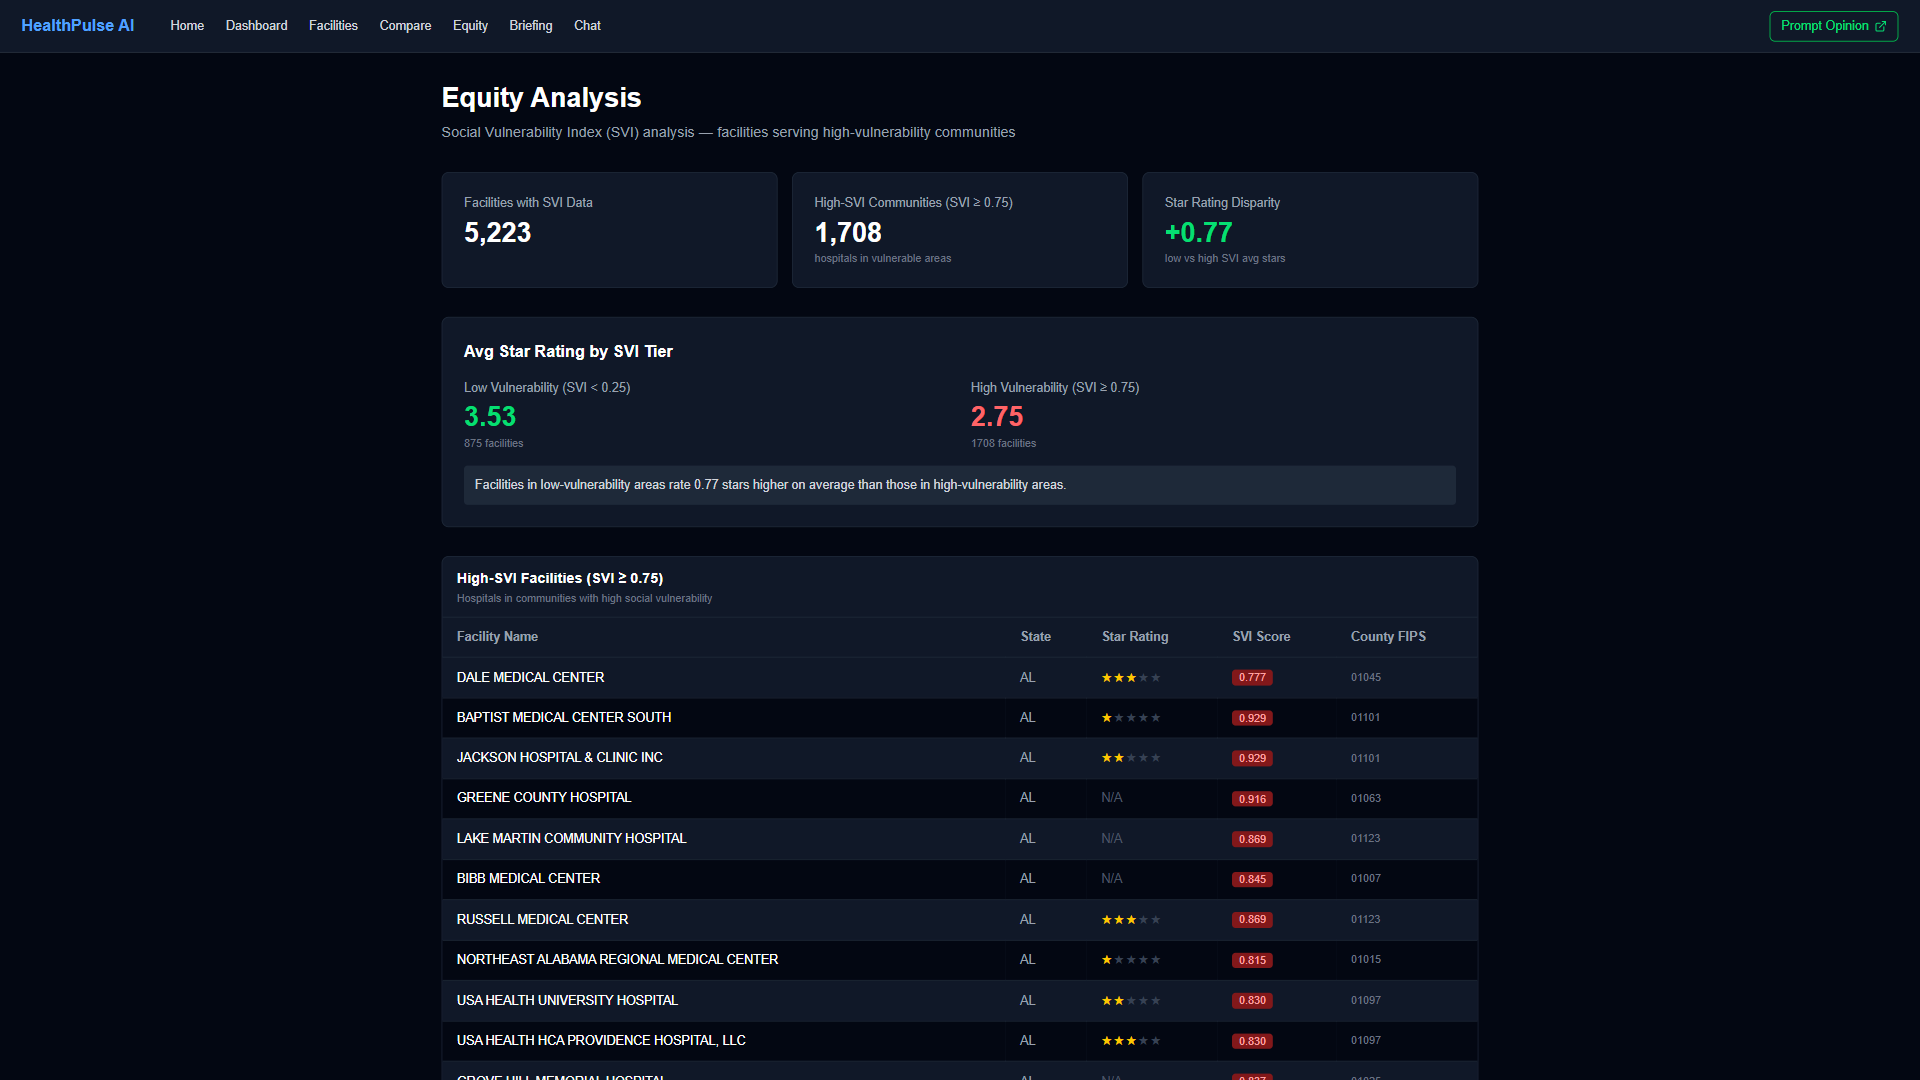
This matters because Medicare readmission penalties cost US hospitals over $500M annually, CMS quality penalties affect nearly every facility, and the CDC estimates 100,000+ preventable deaths each year from patient safety events. Health equity mandates are expanding, yet most systems lack tools to systematically measure outcome disparities between high- and low-vulnerability communities. HealthPulse AI puts this analysis in front of AI agents — through MCP tool calls on Prompt Opinion, visual analytics on the dashboard, or natural language in the chat interface — so that health system leaders, quality officers, equity directors, and value-based care teams can act on intelligence, not just data.
How We Built It
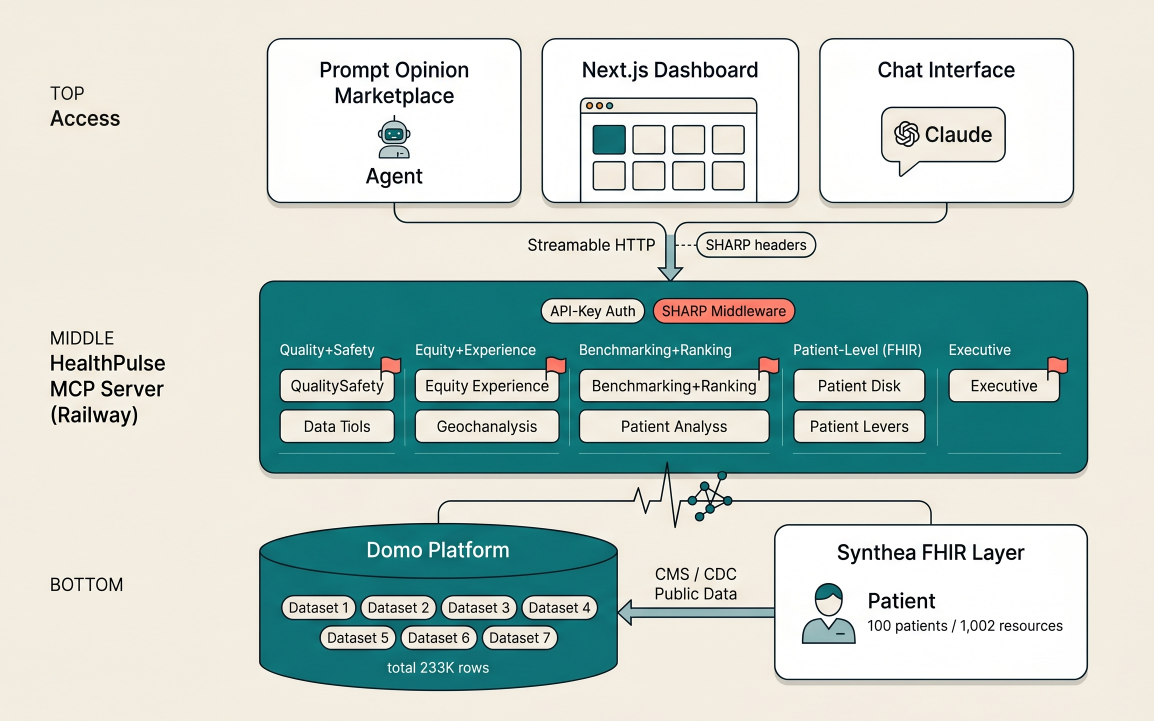
MCP Server (Python): 11 tools registered via FastMCP with Streamable HTTP transport, deployed as a Docker container on Railway. Each tool queries Domo datasets through an OAuth-authenticated client, runs analytics (Z-score computation, cross-cutting aggregation, cohort analysis), and returns structured JSON for the platform LLM to reason over. The server never calls an LLM itself — it provides data and lets the host model generate narrative. SHARP middleware extracts FHIR context headers (X-FHIR-Server-URL, X-Patient-ID, X-FHIR-Access-Token) on every request for patient-level drill-down. API key authentication protects the endpoint.
Data Layer (Domo + Synthea): A Python ETL pipeline downloads CMS CSV exports (Hospital General Information, Quality Measures, Readmissions, HCAHPS, Medicare Spending, Complications), resolves county FIPS codes via Census crosswalk, and uploads to 7 curated Domo datasets totaling 233,605 rows. CDC Social Vulnerability Index data provides county-level poverty, uninsured, and minority population metrics. 100 synthetic FHIR patients (1,002 resources) generated by Synthea provide patient-level data with conditions, medications, encounters, and observations — no real PHI anywhere.
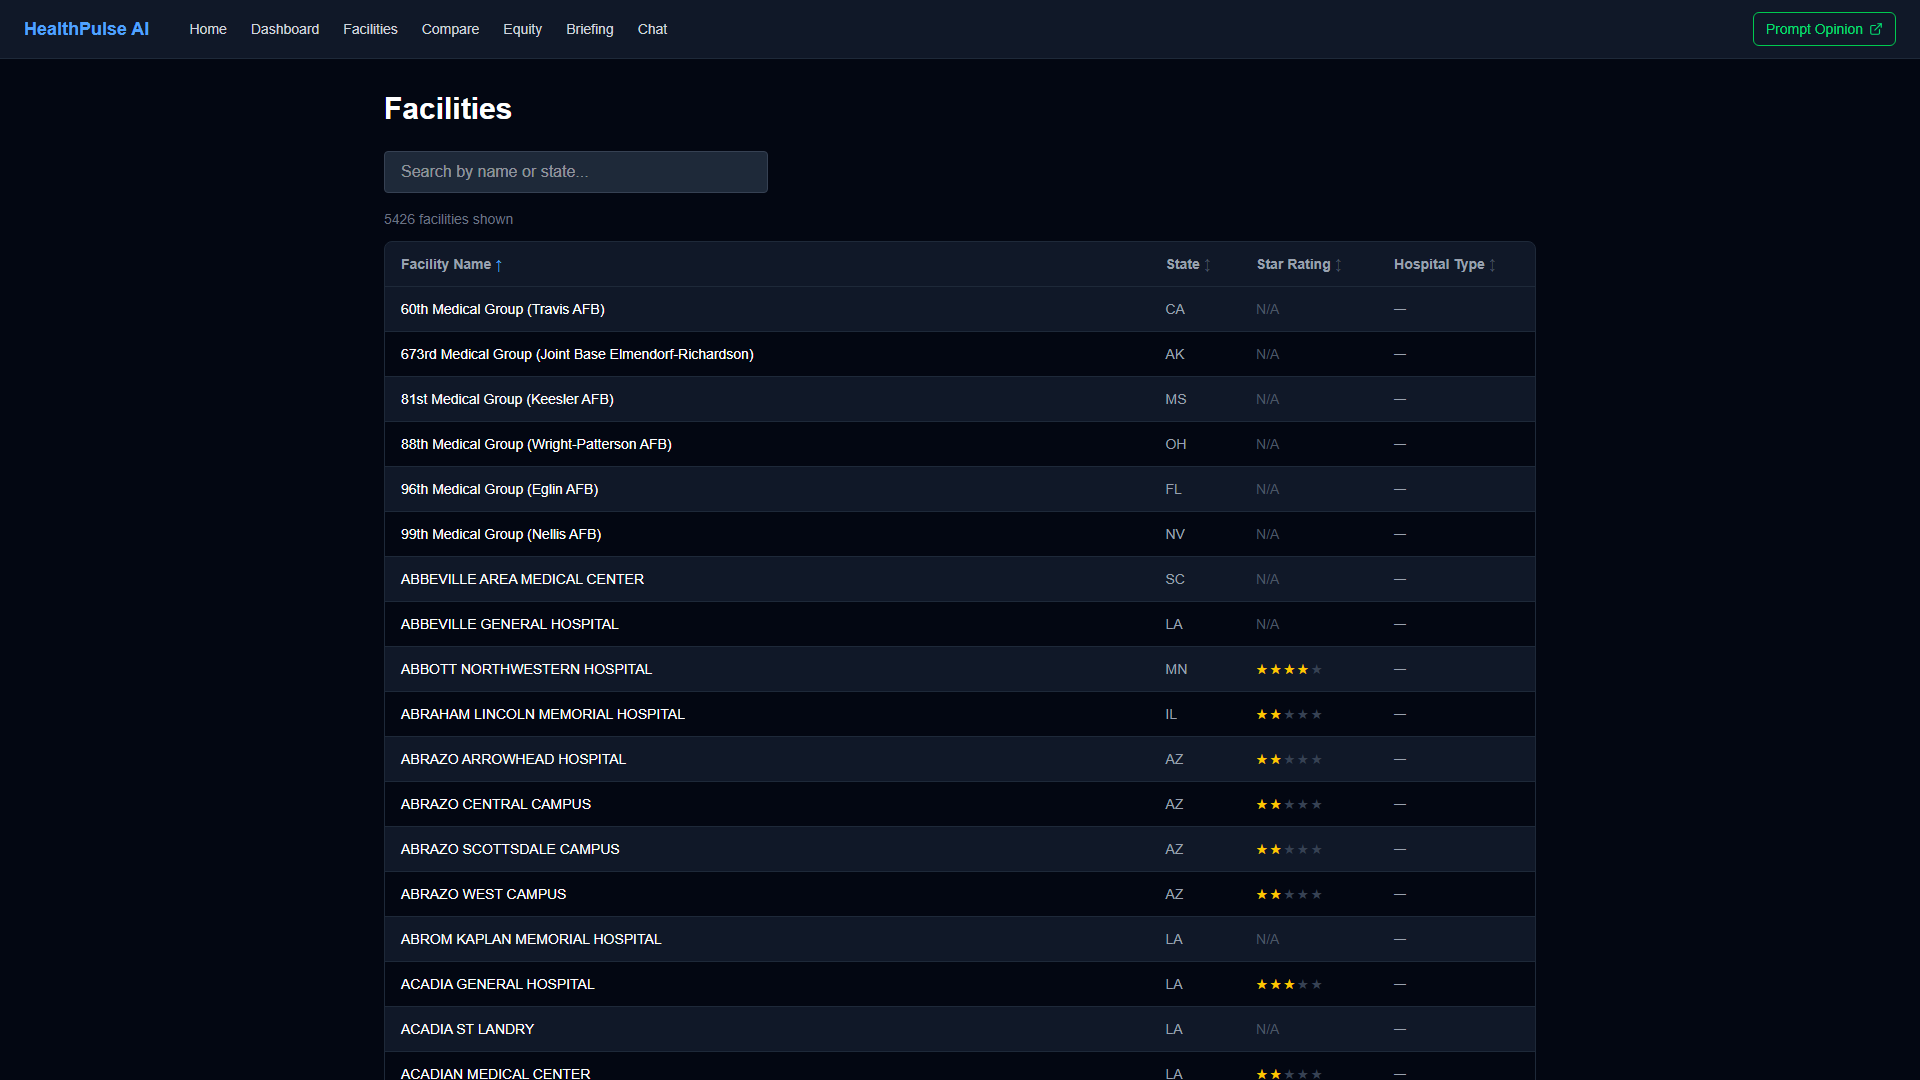
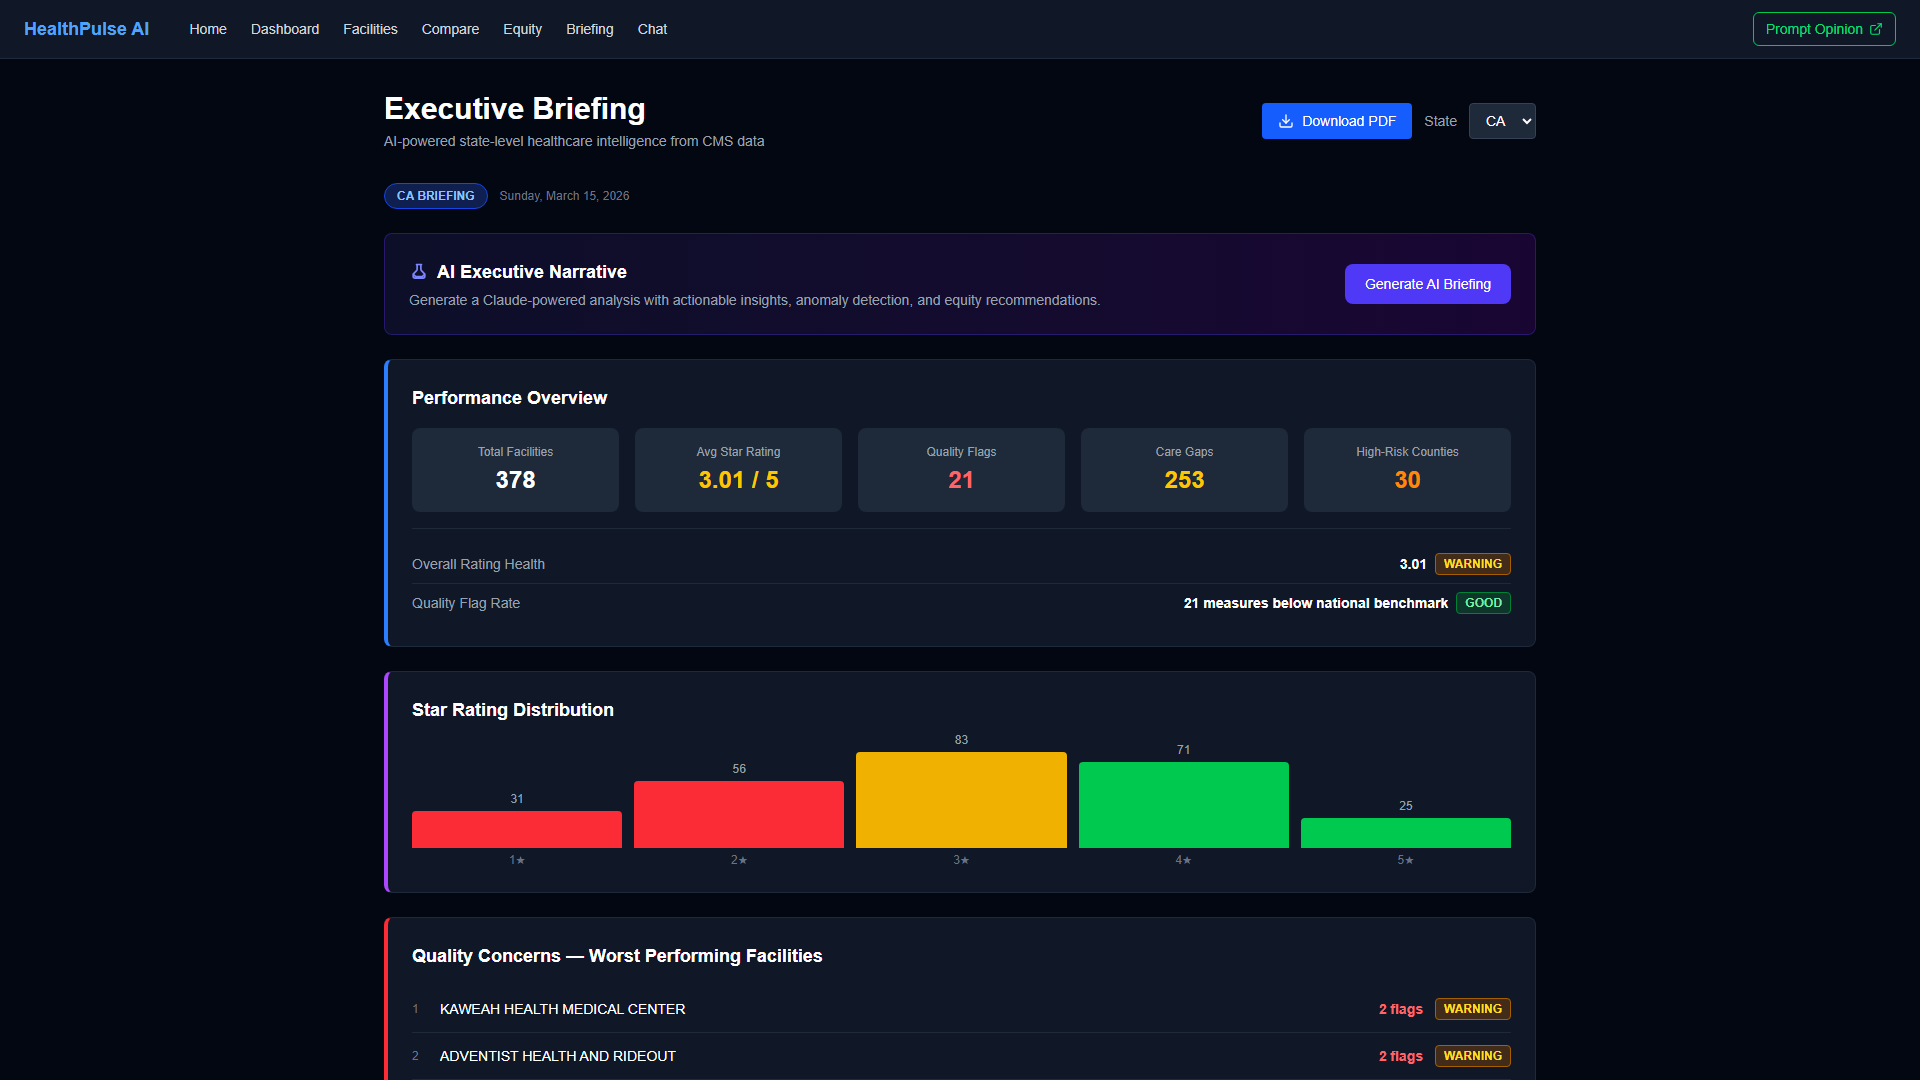
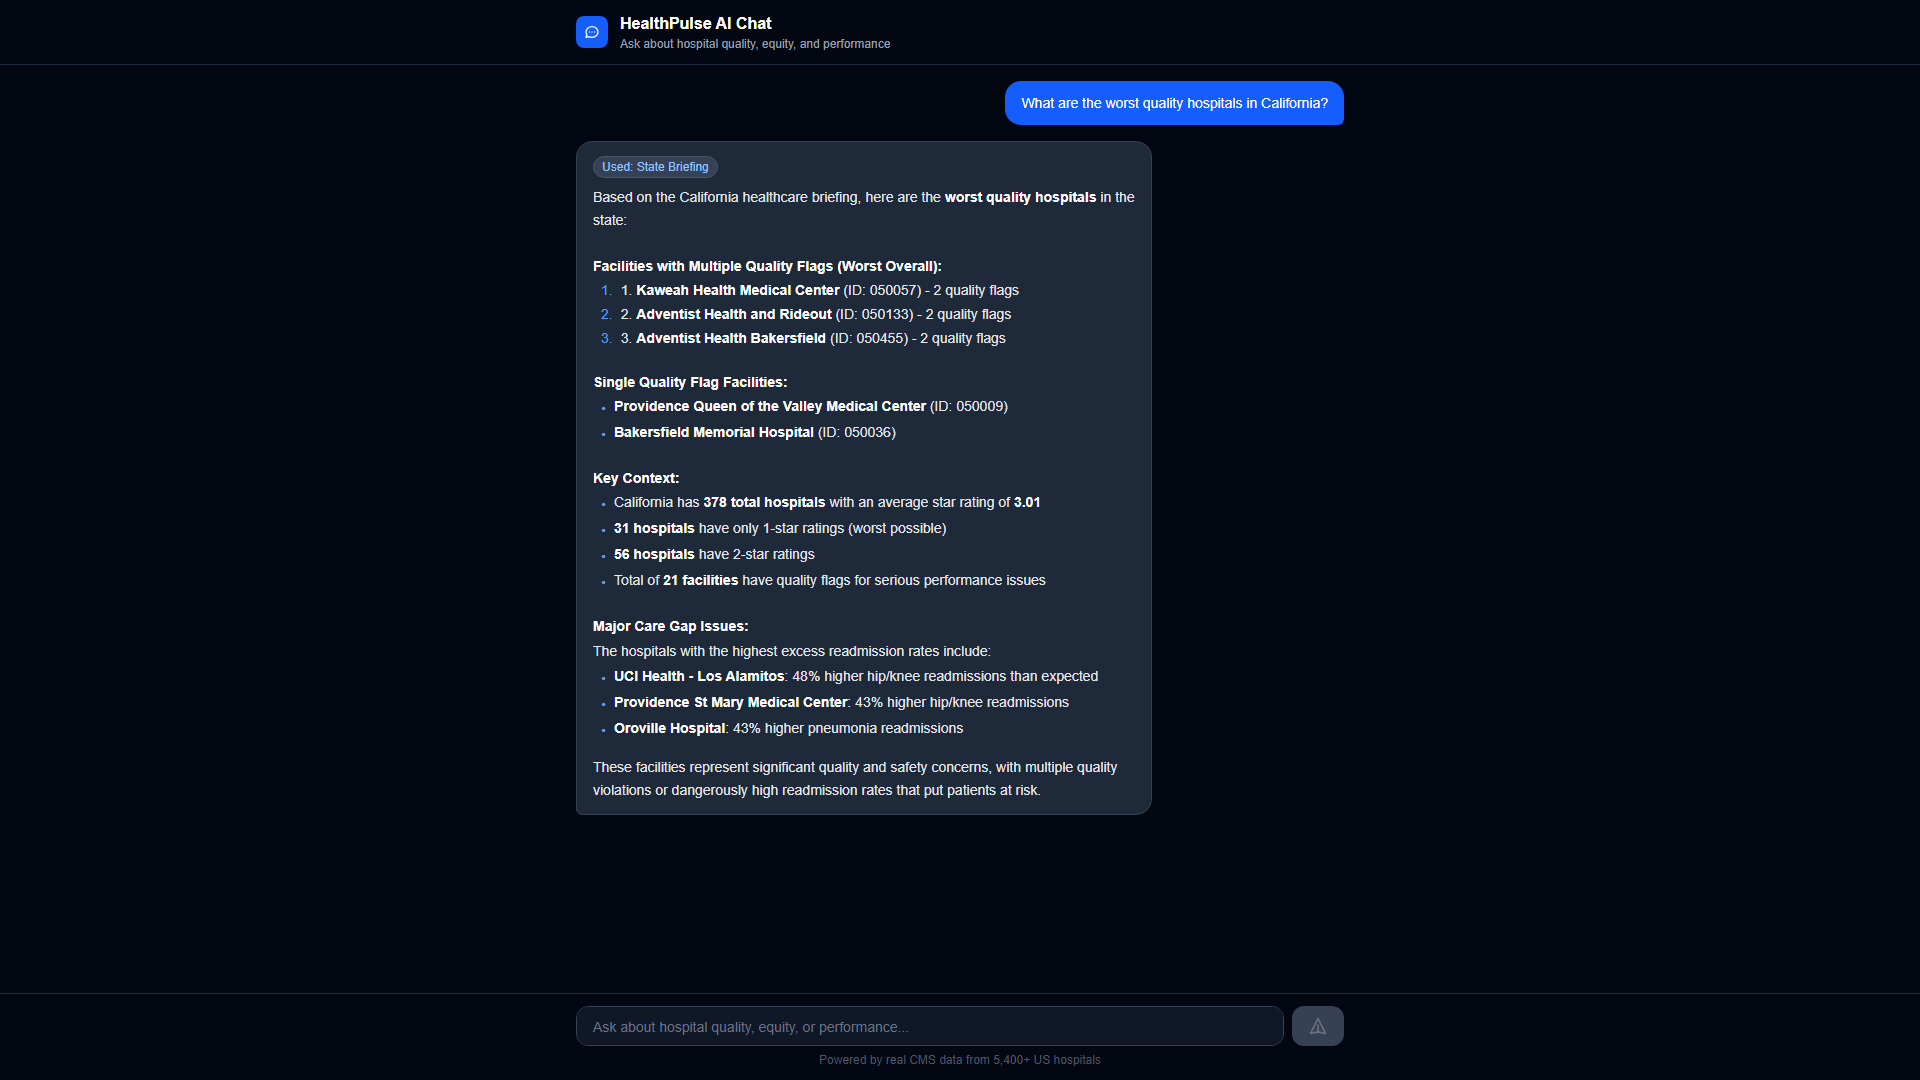
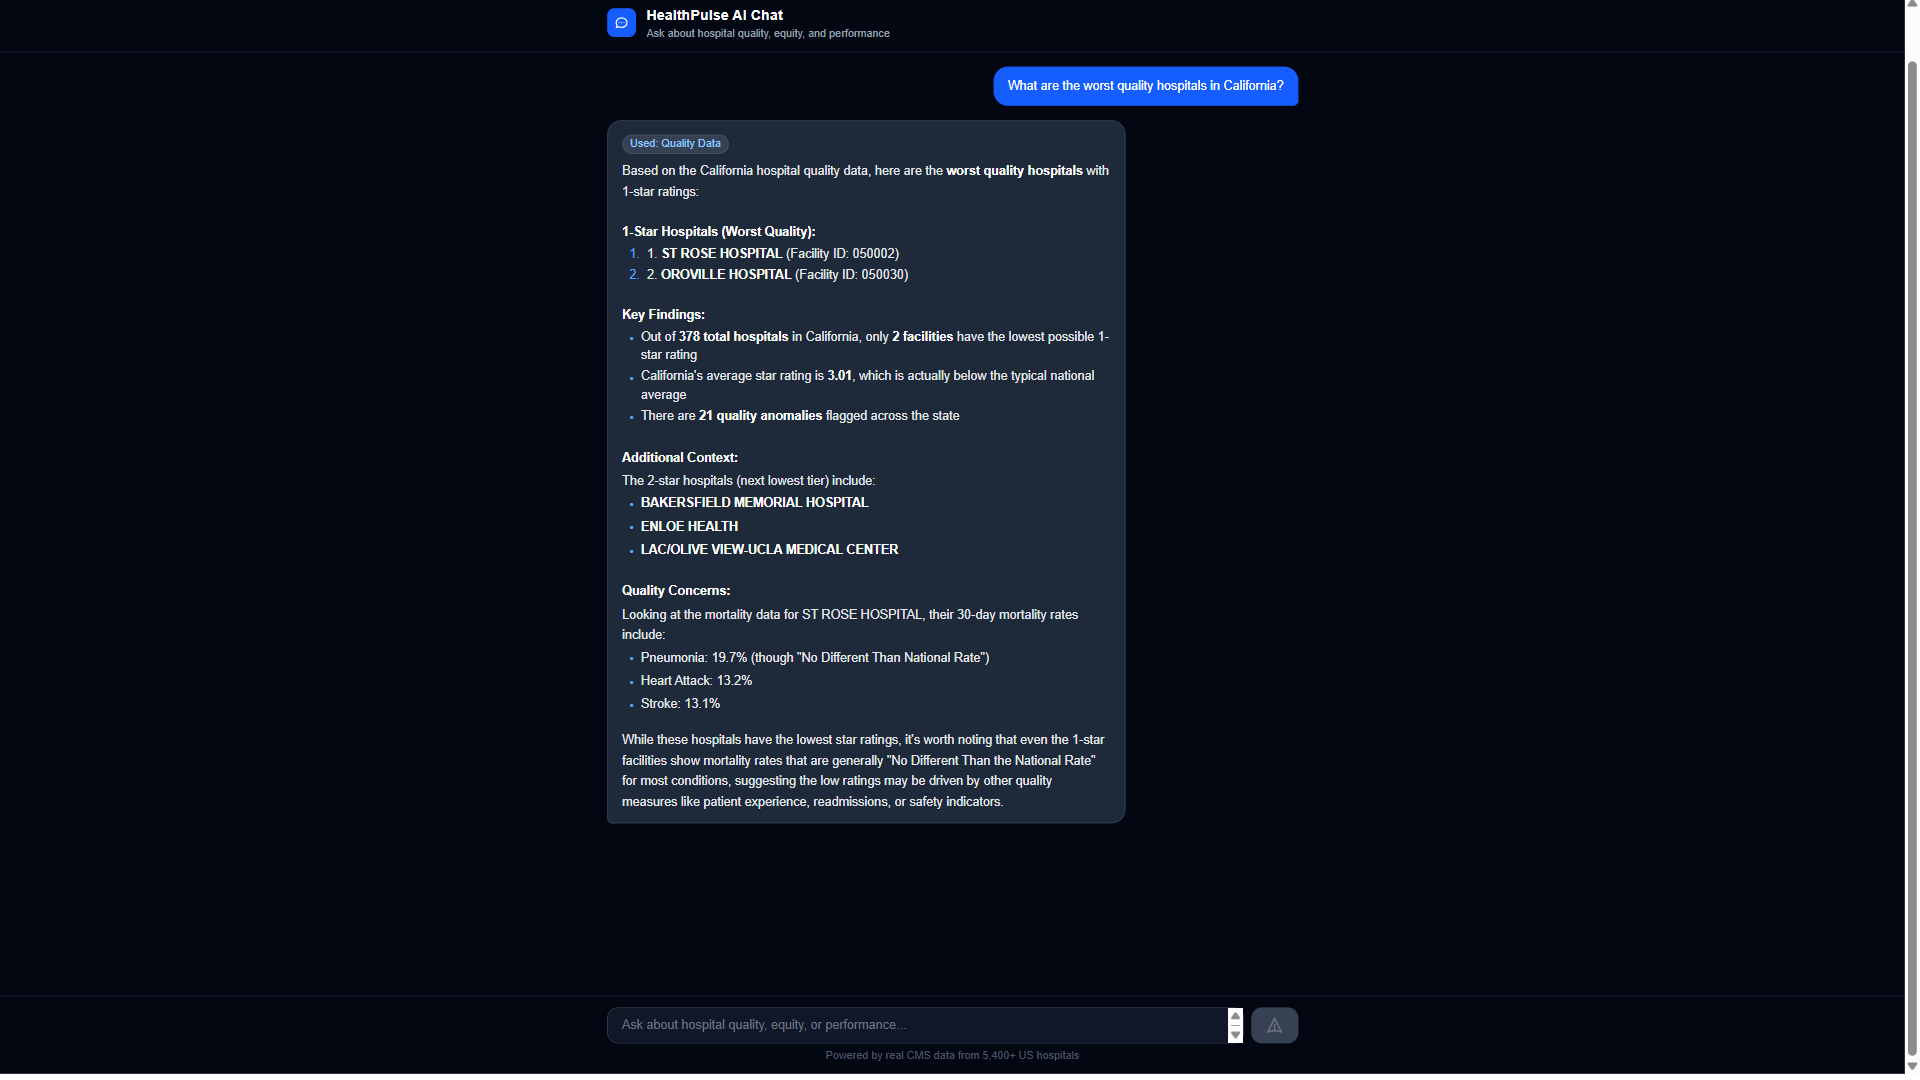
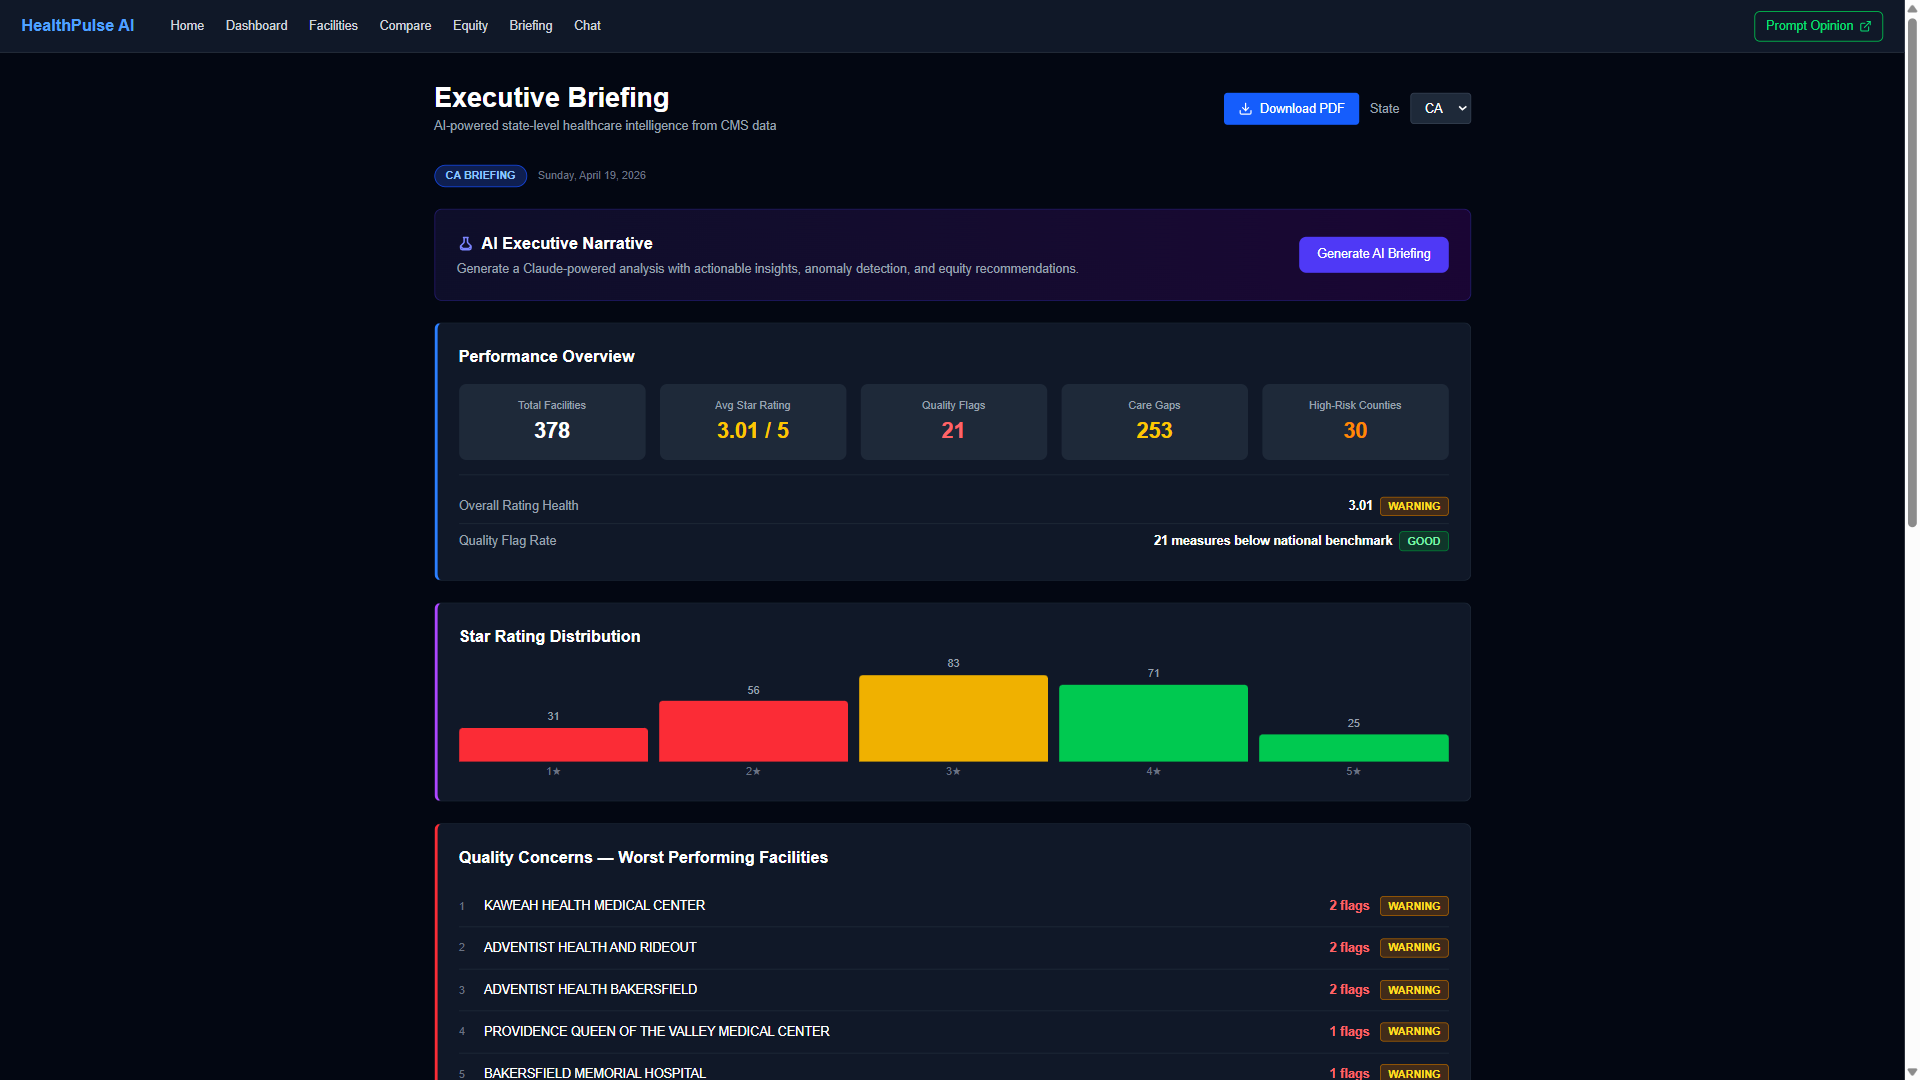
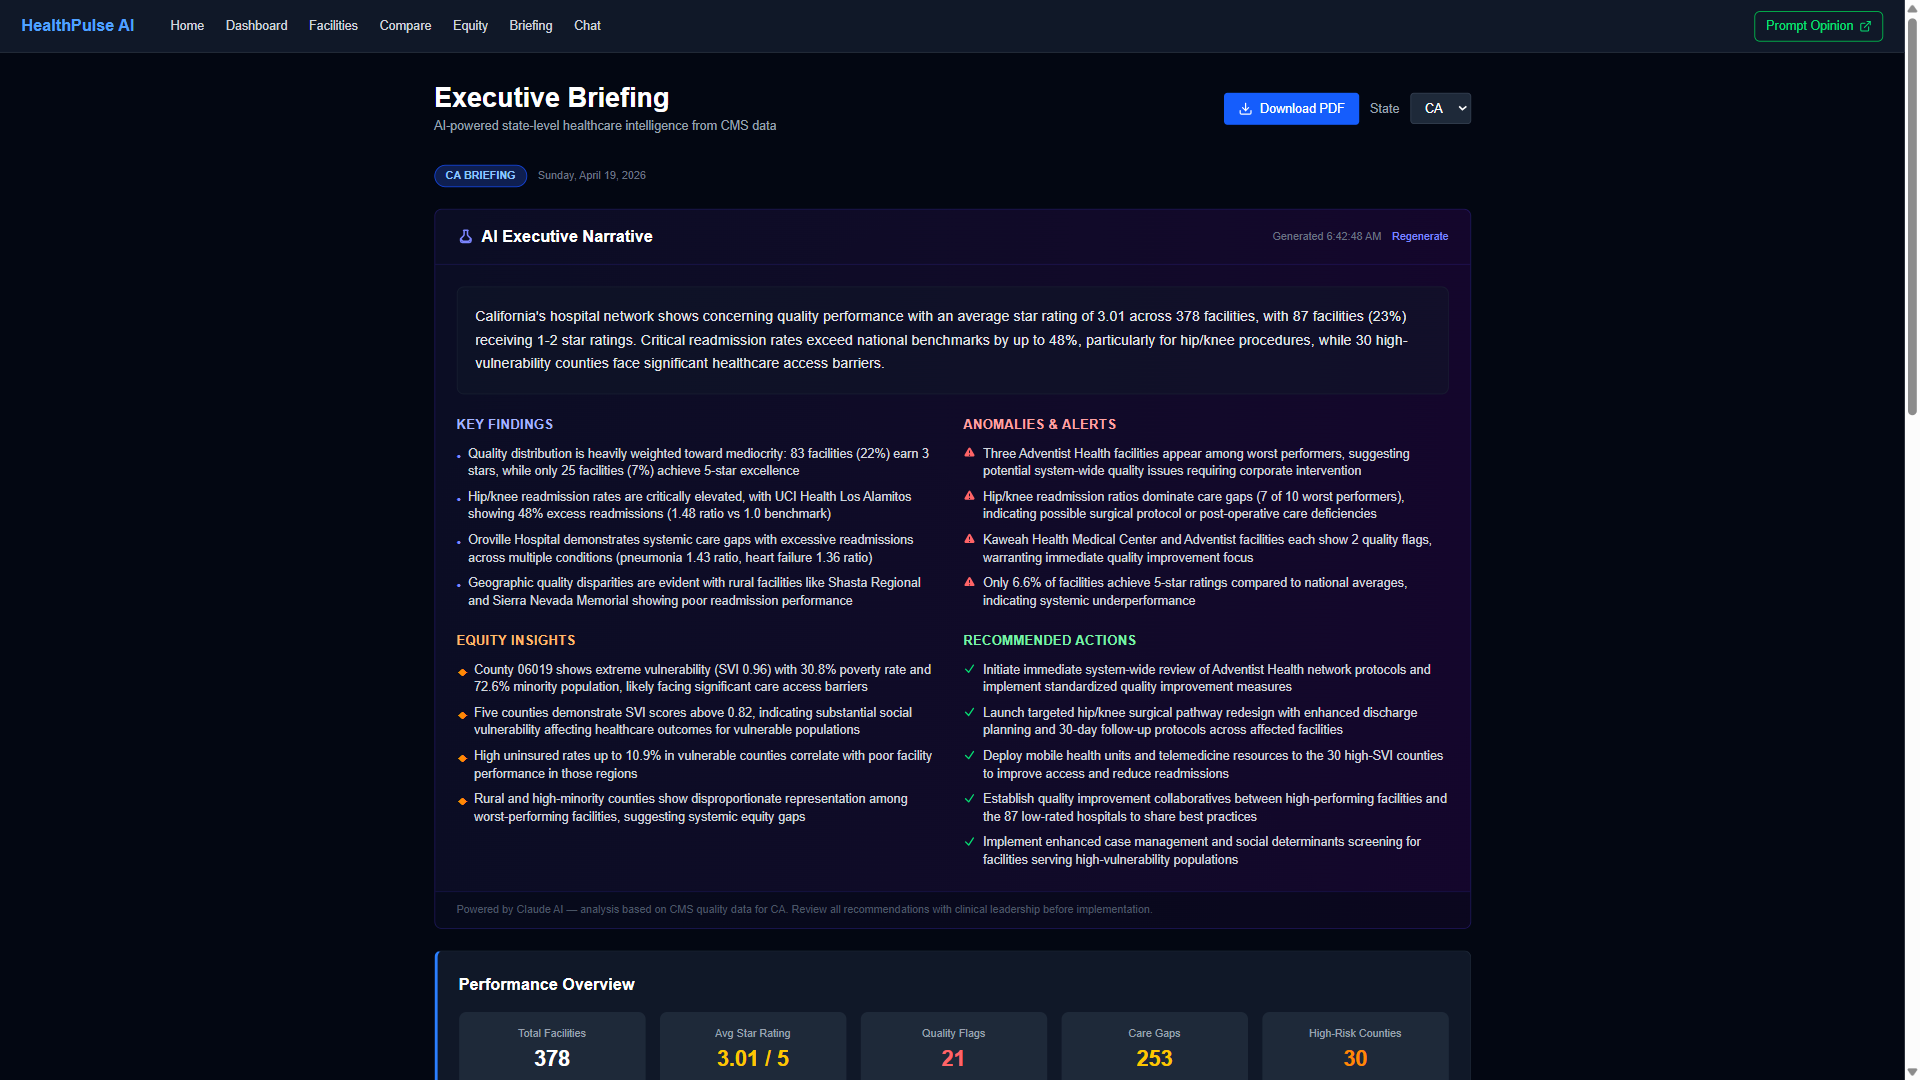
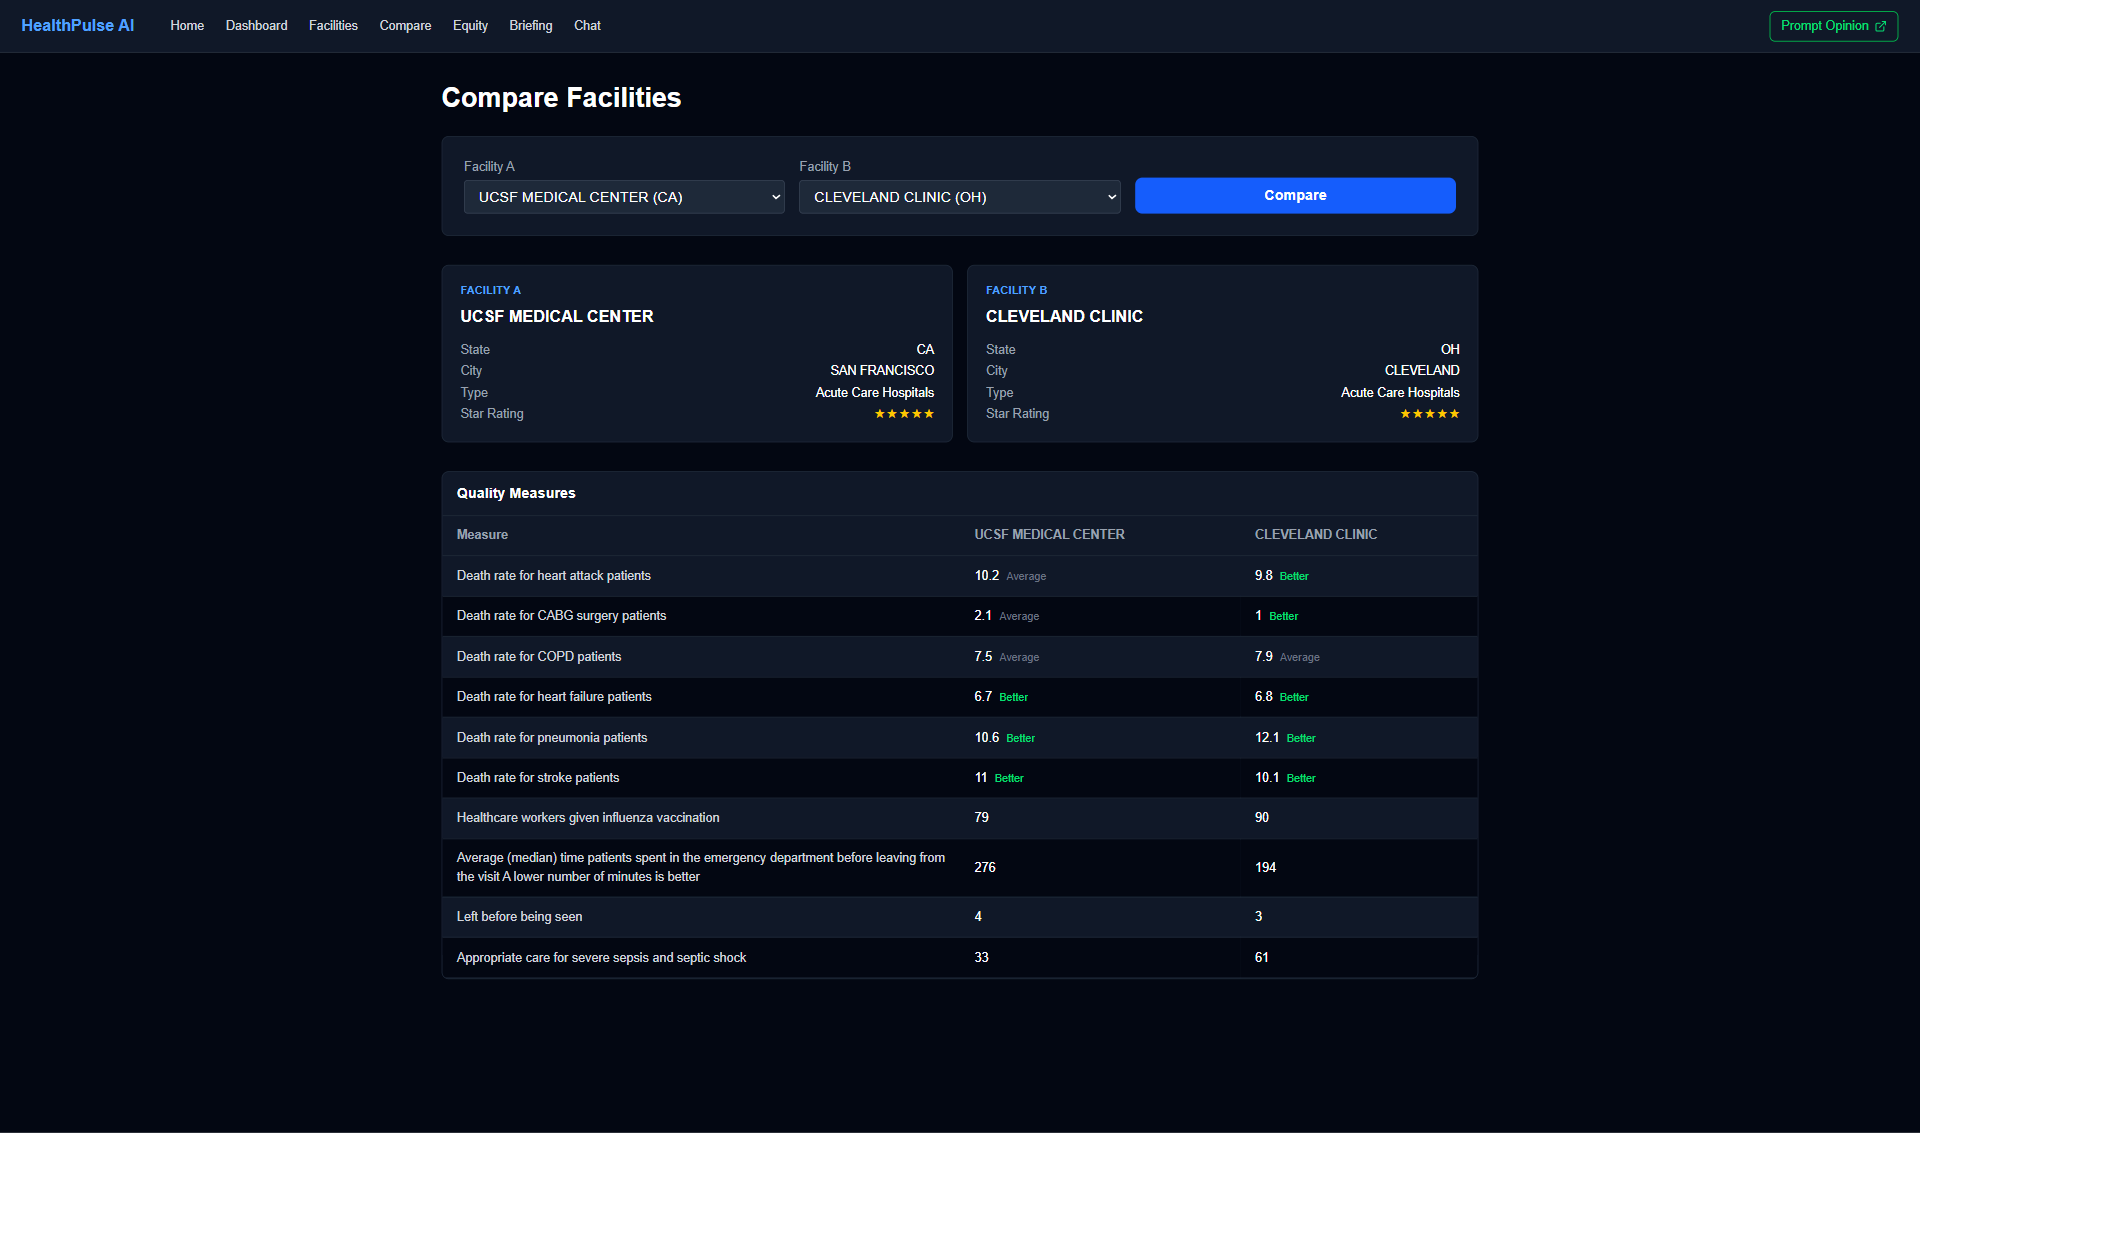
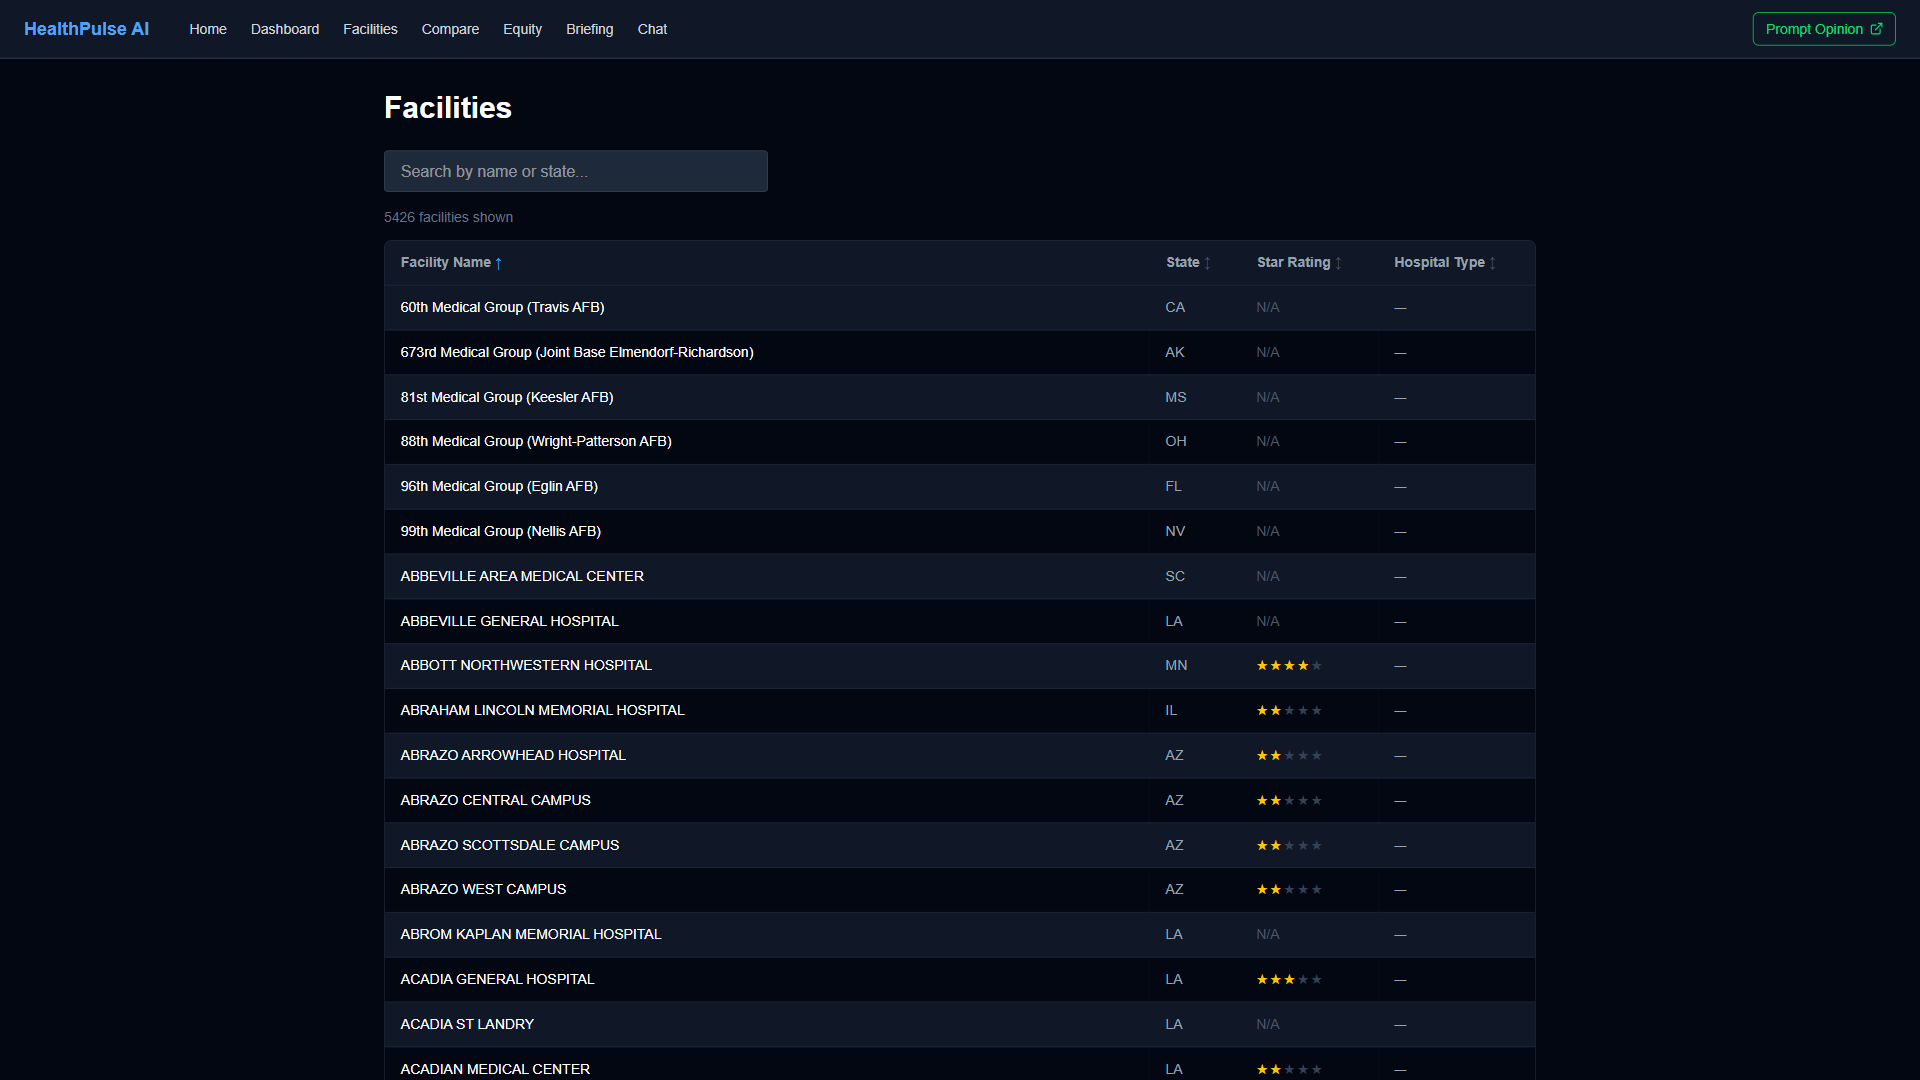
Dashboard (Next.js 16 + React 19): 7 pages — Hub, Quality Overview, Facilities, Compare, Equity Analysis, Executive Briefing, and Chat — built with TypeScript, Tailwind CSS, and Recharts. The chat interface uses the Anthropic SDK to route natural language questions to the correct MCP tool. The executive briefing page aggregates multi-tool data and generates AI narratives with PDF export via @react-pdf/renderer. All pages call 6 API routes that proxy to the MCP server.
Key design decisions: (1) Tools return structured data, never prose — the platform LLM controls narrative quality. (2) Stateless HTTP transport for horizontal scalability. (3) All data is public CMS or synthetic FHIR — zero HIPAA barriers. (4) Domo as the data layer means health systems already using Domo can adopt HealthPulse by pointing at their own datasets. (5) SHARP header propagation means the same tools work with real EHR FHIR endpoints by swapping the server URL.
Challenges We Ran Into
Domo SQL dialect constraints. Domo's query API does not support JOINs, subqueries, or standard SQL operators like !=. Every tool that correlates data across datasets (cross-cutting analysis spans 4 separate Domo datasets) had to implement the join logic in Python. This forced an architecture where each tool fetches raw rows from multiple datasets and performs in-memory correlation — more code, but it works reliably within Domo's constraints.
Cross-cutting analysis across six dimensions. The original cross-cutting tool checked three dimensions. Adding patient experience (HCAHPS) and cost efficiency (MSPB) required integrating two additional datasets with different schemas, ID formats, and missing-data patterns. Each dimension has its own threshold logic and the tool must handle facilities that appear in some datasets but not others. Getting the "concern count" aggregation correct across all six dimensions — without double-counting or missing edge cases — took multiple iterations with careful test coverage.
SHARP/FHIR context propagation in stateless transport. MCP's Streamable HTTP mode is stateless — there is no session to carry patient context between tool calls. We implemented SHARP header extraction as Starlette middleware using Python contextvars, so each request's FHIR context is available to any tool without threading it through function signatures. This works, but it means the platform (Prompt Opinion) must send SHARP headers on every request, not just the first one.
Accomplishments We're Proud Of
- 11 MCP tools spanning 6 analytical dimensions — quality, readmissions, equity, patient experience, cost efficiency, and patient-level FHIR — all backed by real CMS data, not mocked responses
- Cross-cutting multi-factor analysis that found 42% of Florida hospitals have compounding risk factors — the kind of systemic pattern that no single-metric dashboard surfaces
- 313 tests (250 MCP server pytest + 63 web dashboard Vitest) covering every tool, the analytics engine, SHARP context handling, Domo client, API routes, and UI components
- Three access modalities from one codebase — Prompt Opinion marketplace, visual dashboard with 7 pages, and conversational chat with Claude tool routing — all consuming the same 11 MCP tools
- Zero PHI architecture using only public CMS data and Synthea synthetic patients, making the entire system deployable without HIPAA compliance barriers
What We Learned
Public healthcare data is remarkably rich but requires significant engineering to make AI-actionable. CMS publishes quality, readmission, HCAHPS, spending, and safety data for every US hospital — but it lives in separate CSV files with inconsistent schemas, missing values represented as "Not Available," and no standard facility-to-county mapping. The ETL pipeline, FIPS crosswalk, and per-tool data cleaning represent most of the unglamorous work that makes the 11 tools possible.
Cross-dimensional correlation is where AI adds the most value over traditional BI. Individual quality metrics are already available on Medicare.gov. The insight that a specific hospital has high readmissions AND low patient experience AND serves a high-poverty community AND overspends on Medicare — that combination requires connecting four data sources in a way that static dashboards cannot. The cross-cutting analysis tool is the most powerful tool in the set precisely because it synthesizes across boundaries.
MCP's stateless transport model changes how you think about healthcare context. In a traditional EHR integration, session state carries patient context. In MCP Streamable HTTP, every request is independent. This forced us to adopt SHARP headers as explicit context propagation — which turned out to be a cleaner, more auditable pattern than session-based context. Each tool call is self-contained and traceable.
What's Next
- Real EHR FHIR integration — replace Synthea synthetic data with live patient data from FHIR-enabled EHR endpoints, using the SHARP headers already implemented
- Predictive risk scoring — add forward-looking analytics that combine historical quality trends with patient cohort data to predict readmission risk before it materializes
- Geographic visualization — add map-based views showing facility performance and equity indicators at the county and state level
- Expanded cost analysis — integrate additional CMS Value-Based Purchasing and Hospital Acquired Condition Reduction Program penalty data for comprehensive financial impact modeling
Built With
- docker
- domo
- fastmcp
- fhir
- mcp
- next.js-16
- pytest
- python
- railway
- react-19
- recharts
- sharp
- starlette
- synthea
- tailwind-css
- typescript
- uvicorn
- vercel
- vitest
Log in or sign up for Devpost to join the conversation.