Inspiration
Bank apps tell you what you spent last month. Nothing tells someone on a tight budget what will happen next month, even though most of the shocks that push people into overdraft are already on the calendar:
- Universal Credit drops when a weekly-paid worker's assessment period contains five paydays. This happens four times a year.
- Council tax comes back every April after two free months, with the yearly rise added.
- The energy price cap changes every quarter, and broadband and mobile prices go up every April.
- Benefits are paid early before bank holidays, which leaves a longer gap until the next payment.
- Christmas, birthdays and school uniforms come round on the same dates every year.
24% of UK adults (13.1 million) have low financial resilience (FCA Financial Lives 2024), and £24.1bn of benefits and social tariffs go unclaimed every year. The FCA found that alerts sent before money leaves an account cut overdraft charges by about 25%.
So the warning signs exist weeks in advance. People just aren't told. We built two connected tools:
- Headroom is for the customer. It shows your money 90 days ahead, explains every dip and gives you a plan to fix it.
- Undertow is for the community. It forecasts where hardship will hit across all 346 neighbourhoods in Greater Manchester, so councils and food banks can act before demand peaks.
What it does
Our demo persona is Aisha, 34, a care worker from Levenshulme. She is on a zero-hours contract, paid weekly, gets Universal Credit and has a six-year-old daughter.
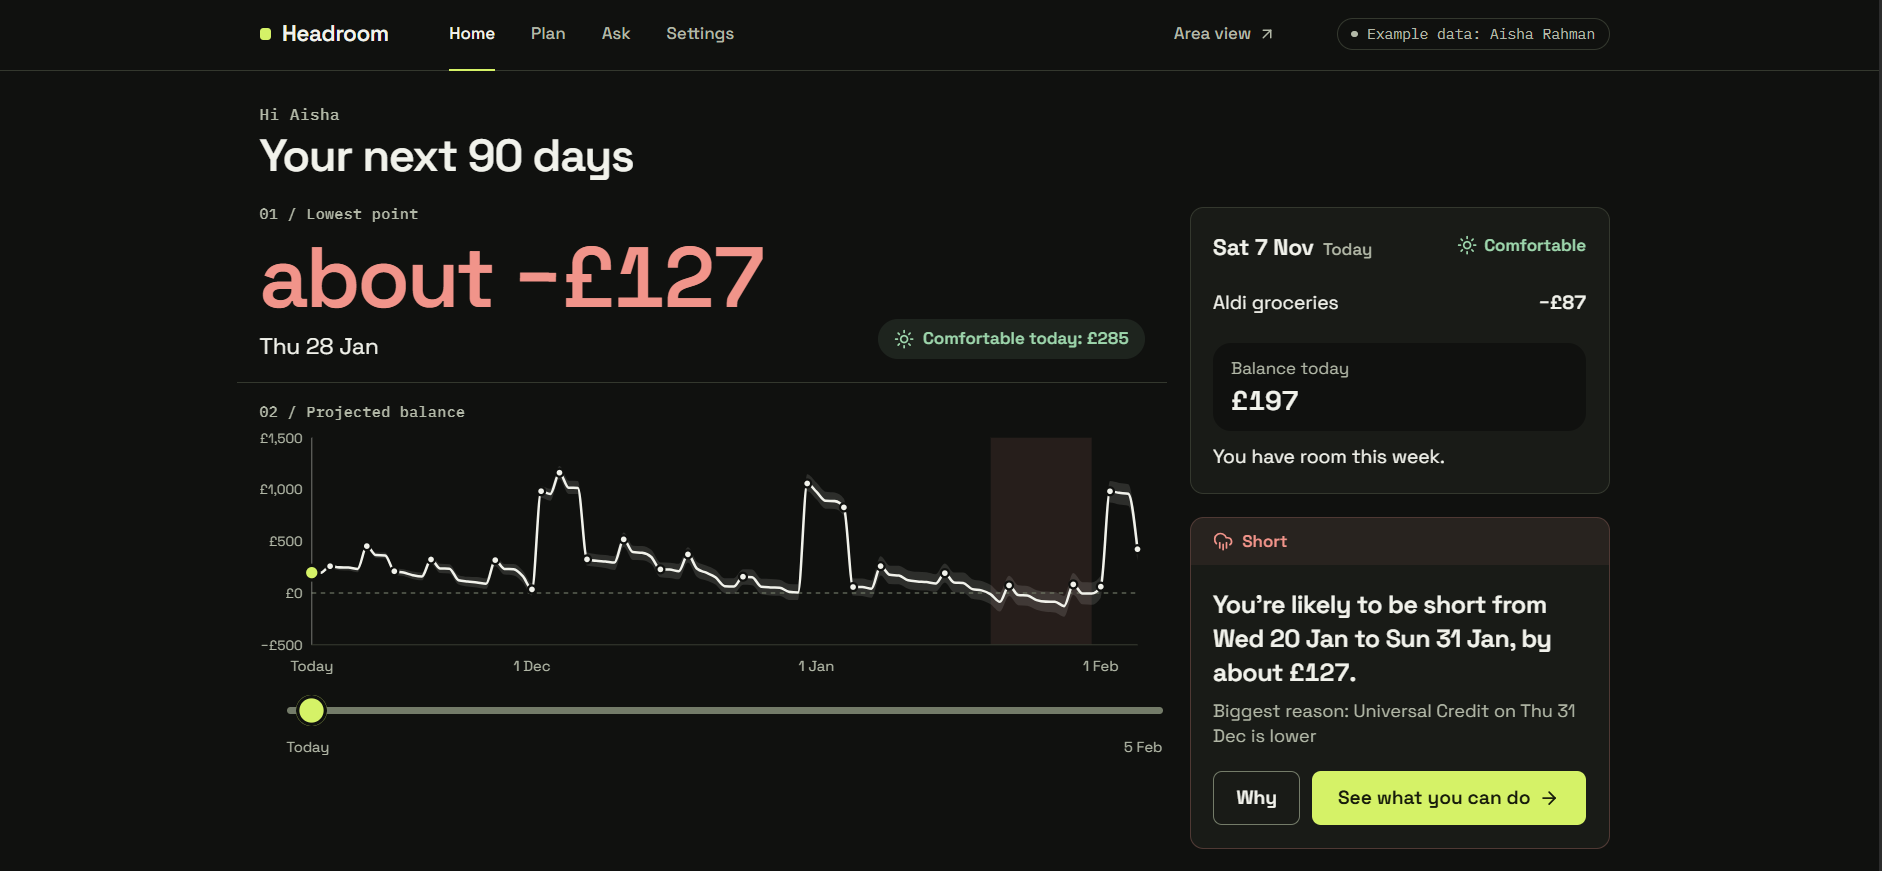
- See ahead: a 90-day balance forecast with an honest P20–P80 range, and a weekly "weather strip" rating each week Comfortable, Tight or Short.
- Time travel scrubber: drag to any day to see what happens and why. "Thu 31 Dec. UC lands early because 2 Jan is a Saturday: about £799, which is £154 less than usual."
- One calm warning: the first shortfall, with its named causes, biggest first, and a "How we worked this out" panel that traces every number back to a transaction or a public rule.
- A ranked plan: social tariffs, free school meals, Council Tax Support, spreading council tax over 12 months, saving on the extra payday. Turning an option on re-runs the forecast live. Aisha's lowest point goes from about −£140 to about +£70.
- AI coach, typed and spoken: "What if my hours drop to 16 a week?" becomes a scenario that re-runs the real engine. The voice coach (ElevenLabs) calls the same tools.
- Inclusion: English, Urdu (right-to-left) and Polish, a reading age of about 9–11, WhatsApp delivery, and a handover to Citizens Advice, StepChange or MoneyHelper when the problem is structural.
- Undertow: a hardship map with a +2 to +8 week time slider, the decisive drivers for each area, a policy shock simulator, a crisis fund allocator and AI briefings that can be read aloud.
How we built it
Headroom: a deterministic, auditable engine
The forecasting maths is pure TypeScript. The same inputs always give the same forecast.
1. Recurring detection. We scan 12 months of transactions to find wages, benefits, rent, direct debits and weekly spending, along with their cadence and typical amounts.
2. UK calendar rules. Universal Credit is recalculated for each assessment period using the 55% taper:
$$ \text{UC} = \max\Big(0,\; S - 0.55 \cdot \max\big(0,\; E - W\big)\Big) $$
where $S$ is the maximum entitlement, $E$ is earnings in the assessment period and $W$ is the work allowance. If a period contains five weekly paydays instead of four, $E$ jumps and UC falls. We also model early payment before weekends and bank holidays, the quarterly energy cap, council tax in 10 instalments, April price rises and annual repeats from last year.
3. 200 bootstrap futures. For each path $k$, every event's amount $a_e^{(k)}$ is re-sampled from that series' history. UC is recomputed from that path's wages:
$$ B_t^{(k)} = B_0 + \sum_{e \,:\, d_e \le t} a_e^{(k)}, \qquad k = 1, \dots, 200 $$
For each day $t$ we report the $P_{20}$, $P_{50}$ and $P_{80}$ of $B_t$. The band widens further ahead because everyday spending drifts.
4. Causes by ablation. For each cause $c$, we re-run the forecast without it and measure how much it moves the lowest point:
$$ \Delta_c = \min_t B_t^{\,\setminus c} \;-\; \min_t B_t $$
Causes are then ranked by $\Delta_c$. Actions are scored the same way: each one is simulated against the same engine, and we report the pound gain at the shortfall date.
Undertow: the same idea for a whole city
We simulate 36,000 synthetic households × 200 Monte Carlo futures × 56 days across 346 real ONS neighbourhoods (MSOAs), using the English Indices of Deprivation 2019 to set each area's household mix.
- Pay follows a Markov model that switches between normal, reduced and lost hours. Shocks are shared within an area and within a sector, so risk is correlated.
- Surprise costs follow a compound-Poisson process, and UC is recomputed on every path.
- A driver $d$ is decisive for a household if removing that one shock would have avoided the shortfall.
- We deliberately under-sampled deprived areas, then corrected with census post-stratification and shrinkage, so the forecast is fair to people NatWest doesn't see.
Privacy: each area rate gets Laplace noise with $\varepsilon = 1$:
$$ \tilde{r}_a = r_a + \text{Lap}!\left(\frac{1}{\varepsilon \, n_a}\right) $$
Areas with $n_a < 50$ customers are hidden, drivers are rounded to the nearest 5%, and only area totals ever leave the "bank". A small export script bridges these released totals into Headroom's "You're not alone" card for Aisha's neighbourhood.
AI: language, not arithmetic
Our rule is that deterministic engines do the maths, and AI does the language, the tool use and the voice.
- Claude gets a
Factsobject with every number already worked out, and writes words around those numbers. - A number checker checks every £ amount, percentage and date in the output against the facts. If any don't match, Claude retries, and a template is used if it fails again. Words like "loan", "borrow" and "credit card" are banned.
- The chat coach uses five tools (
get_forecast,simulate_scenario,list_actions,accept_actions,request_human_help) with zod-validated scenarios. The ElevenLabs voice agent calls the same tools, so spoken answers use the same verified numbers. - n8n and Twilio send the plan and payday reminders over WhatsApp. If n8n doesn't reply within 5 seconds, the server sends directly through Twilio.
Results
- Undertow's forecast map agrees with independent ONS Claimant Count data across 344 neighbourhoods at Spearman $\rho = 0.84$, and the model never saw that data. To be upfront, deprivation alone scores $\rho = 0.92$. What Undertow adds is timing, causes, scenarios and targeting.
- On a 6-week held-out backtest, area error was 1.6 points vs 3.6 for the baselines. Household AUC was 0.98 and the Brier score was 0.043.
- With a £500k crisis fund, Undertow's targeting protects about 860 households, against about 370 for most-deprived-first (2.3×).
Challenges we ran into
- Stopping the AI from inventing numbers. Fluent text with one wrong figure is worse than no text at all. The number checker, retry and template fallback took several iterations to get right.
- Getting Universal Credit timing exactly right. Five-payday assessment periods, wages moved early by bank holidays, and UC paid early before New Year all had to line up to the day.
- Merging shortfalls. A single wage can lift the balance above zero for one day, which split one real problem into three warnings. We merge short runs separated by brief recoveries.
- Unbiased privacy noise. Our first version inflated small areas until we added shrinkage.
- A fair allocator comparison. We restricted every strategy to decisions made at area level, so the comparison with deprivation targeting is like for like.
- Demo resilience. Every external service (Claude, ElevenLabs, n8n, Twilio) has a fallback, so every step still works offline.
What we learned
Most financial shocks aren't surprises. They're on the calendar. The hard part isn't predicting them. It's explaining them clearly and kindly, pairing every warning with a fix worth real pounds, and reaching people in their own language before the money leaves the account.
We also learned to be honest about our numbers. Showing a range instead of a single line, stating what is synthetic, and admitting that a deprivation index alone ranks areas well all made the product more trustworthy, not less.
Forecasts are used for support only, never for credit, pricing or enforcement.
