-
-
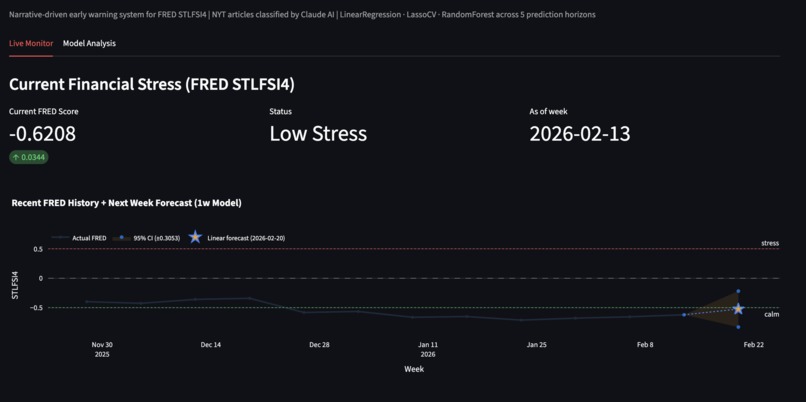
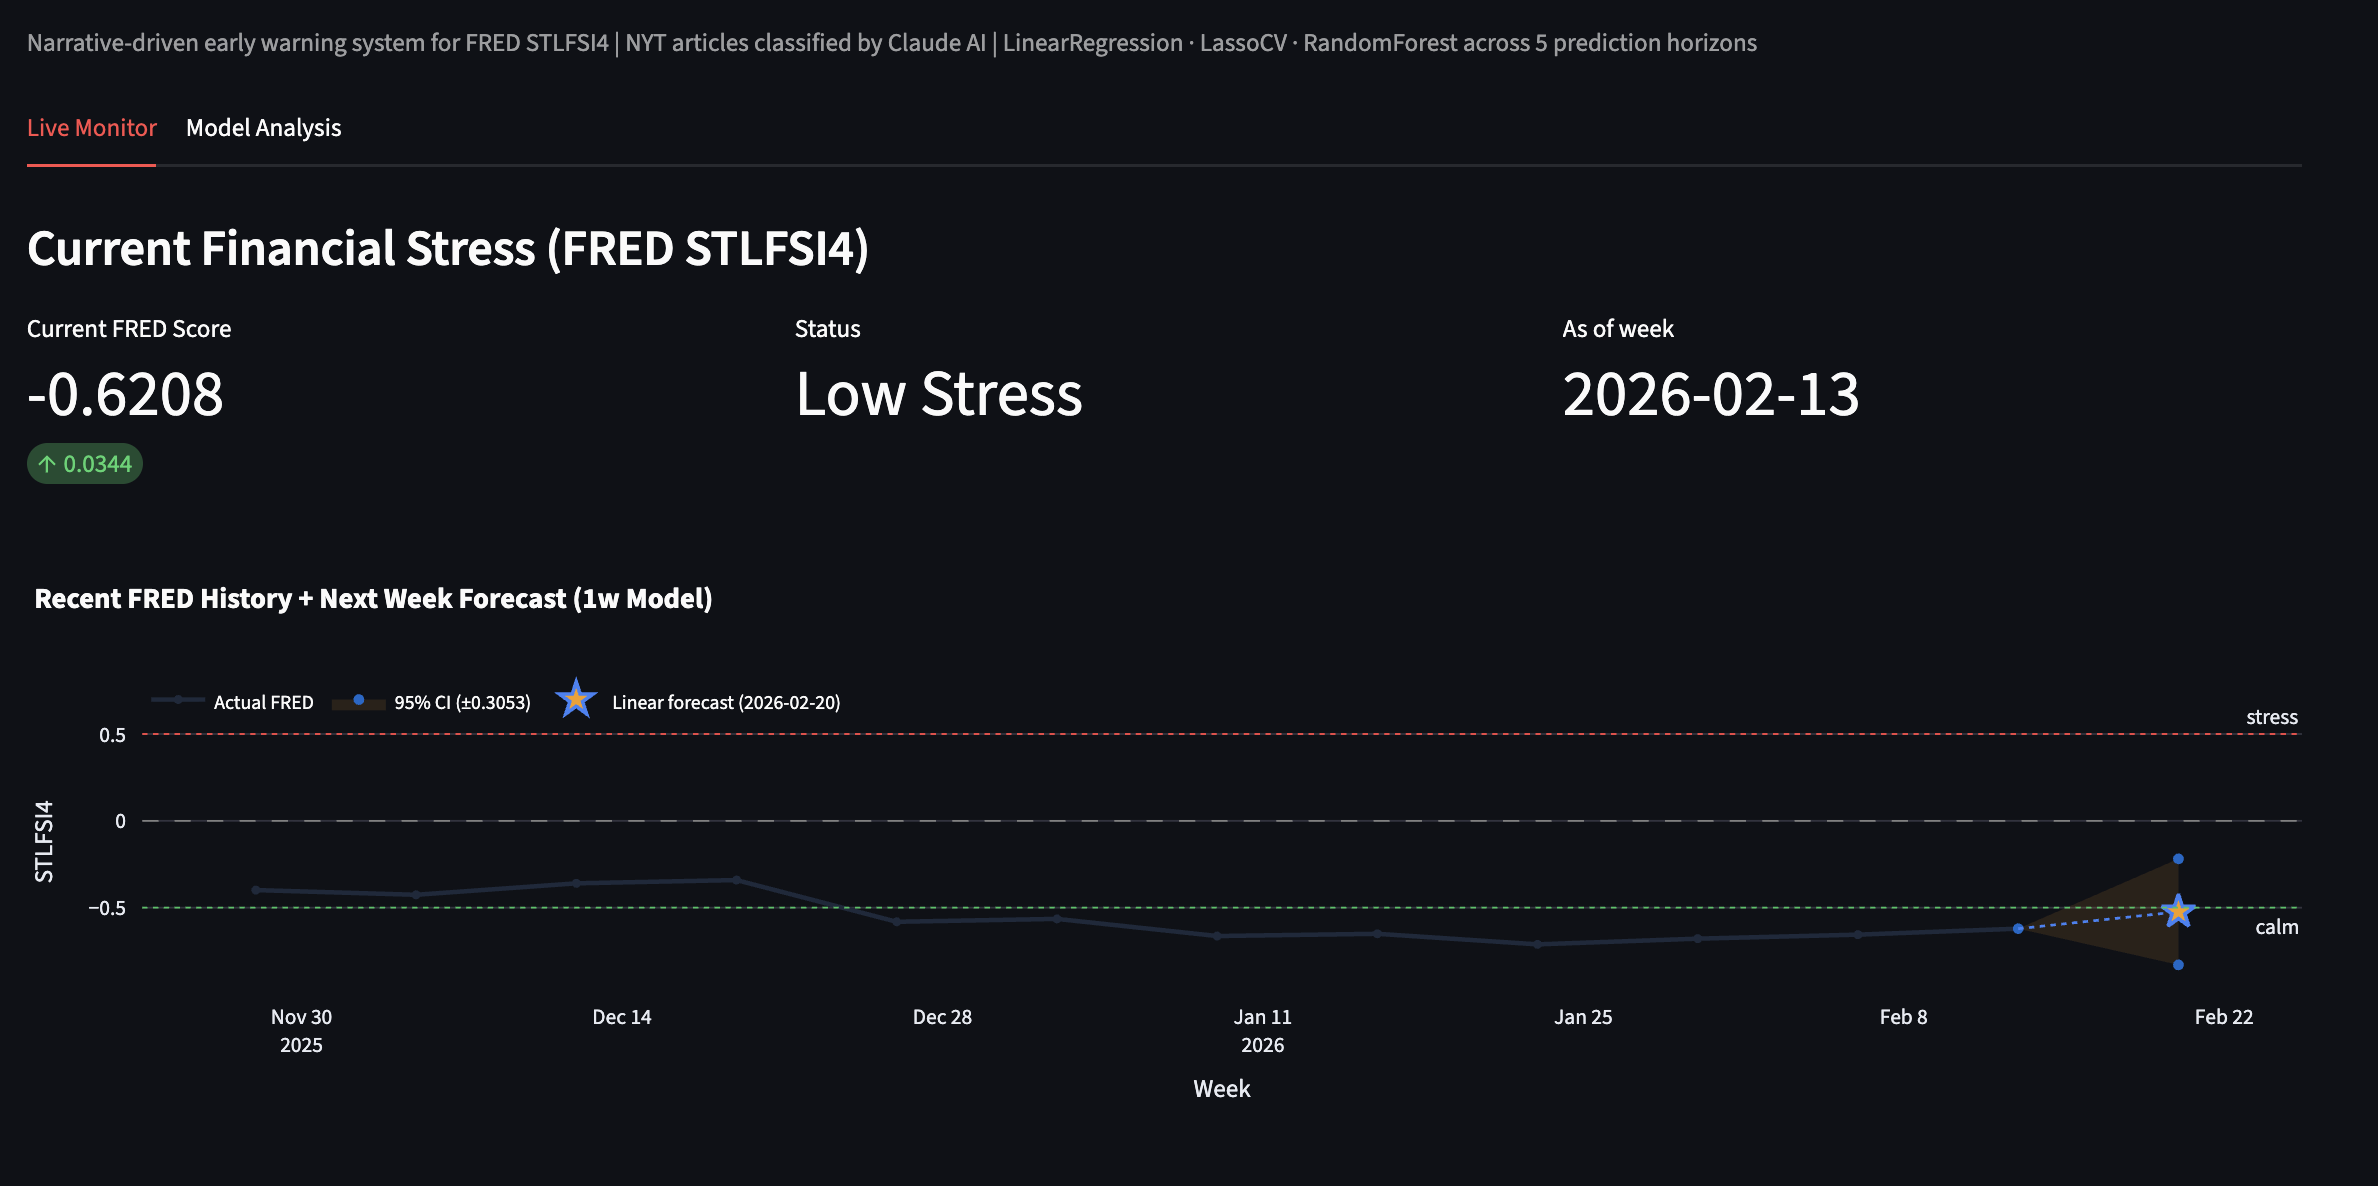
Live status of Stress Levels, and a forecast of 95% confidence for the next week.
-

-
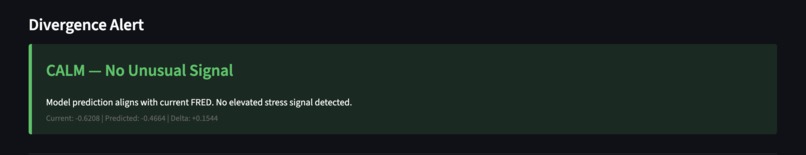
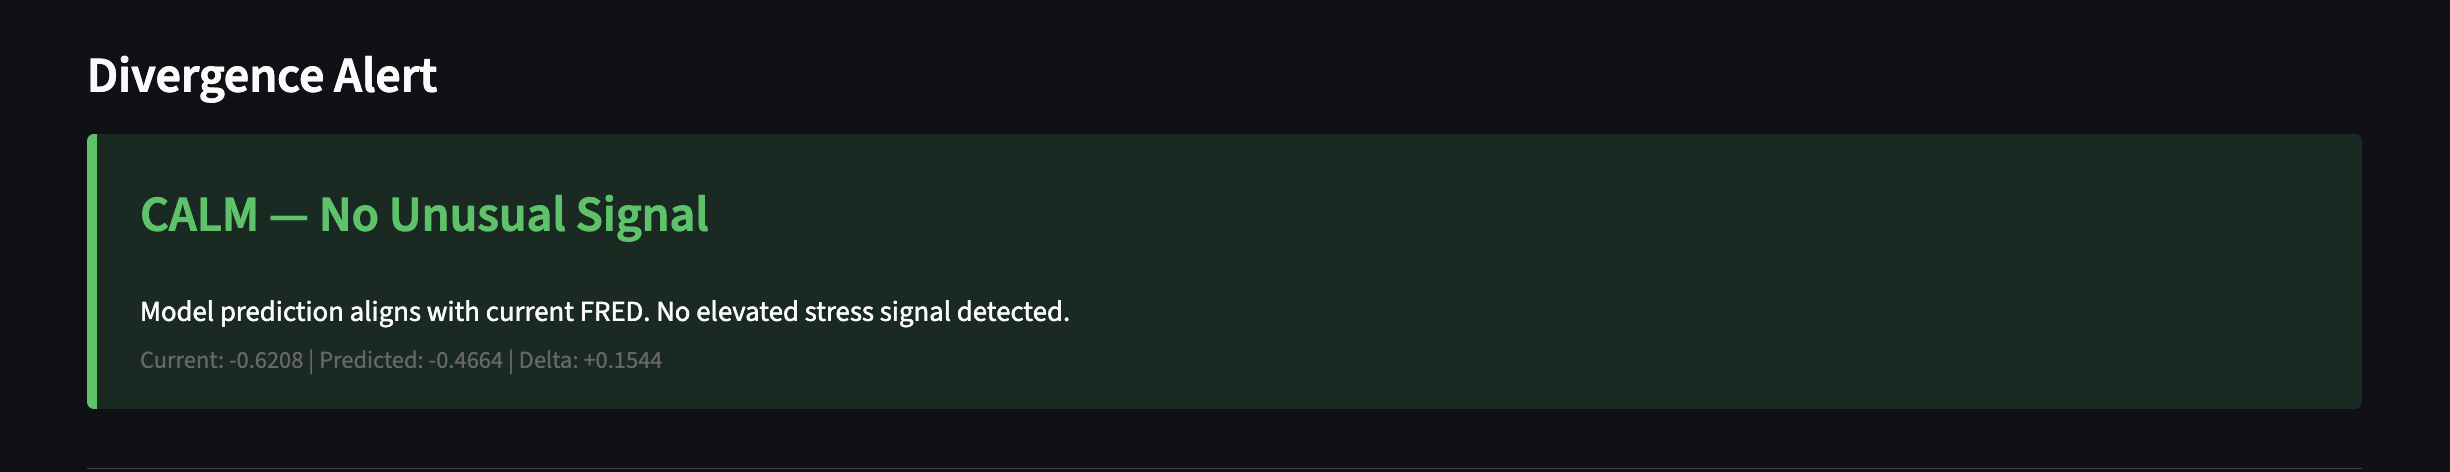
Live Status of if there are any signs pointing to unusual stress levels
-
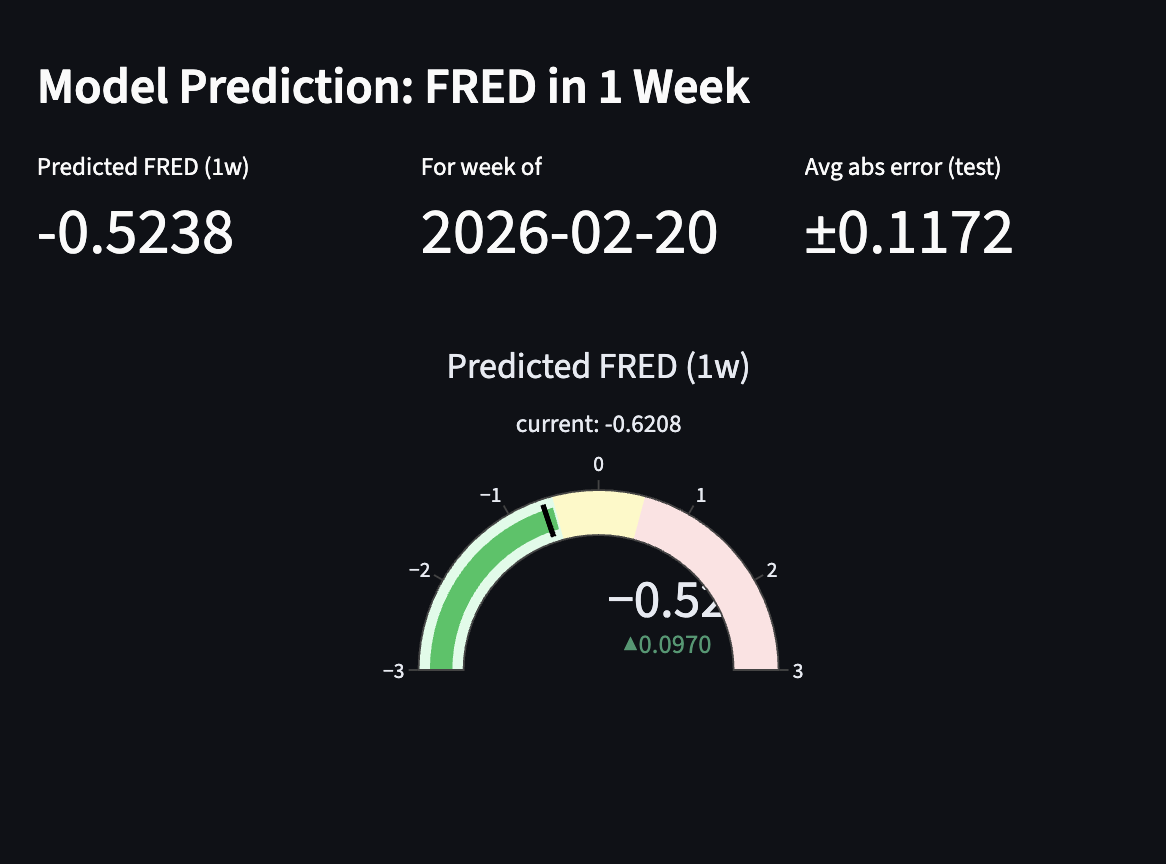
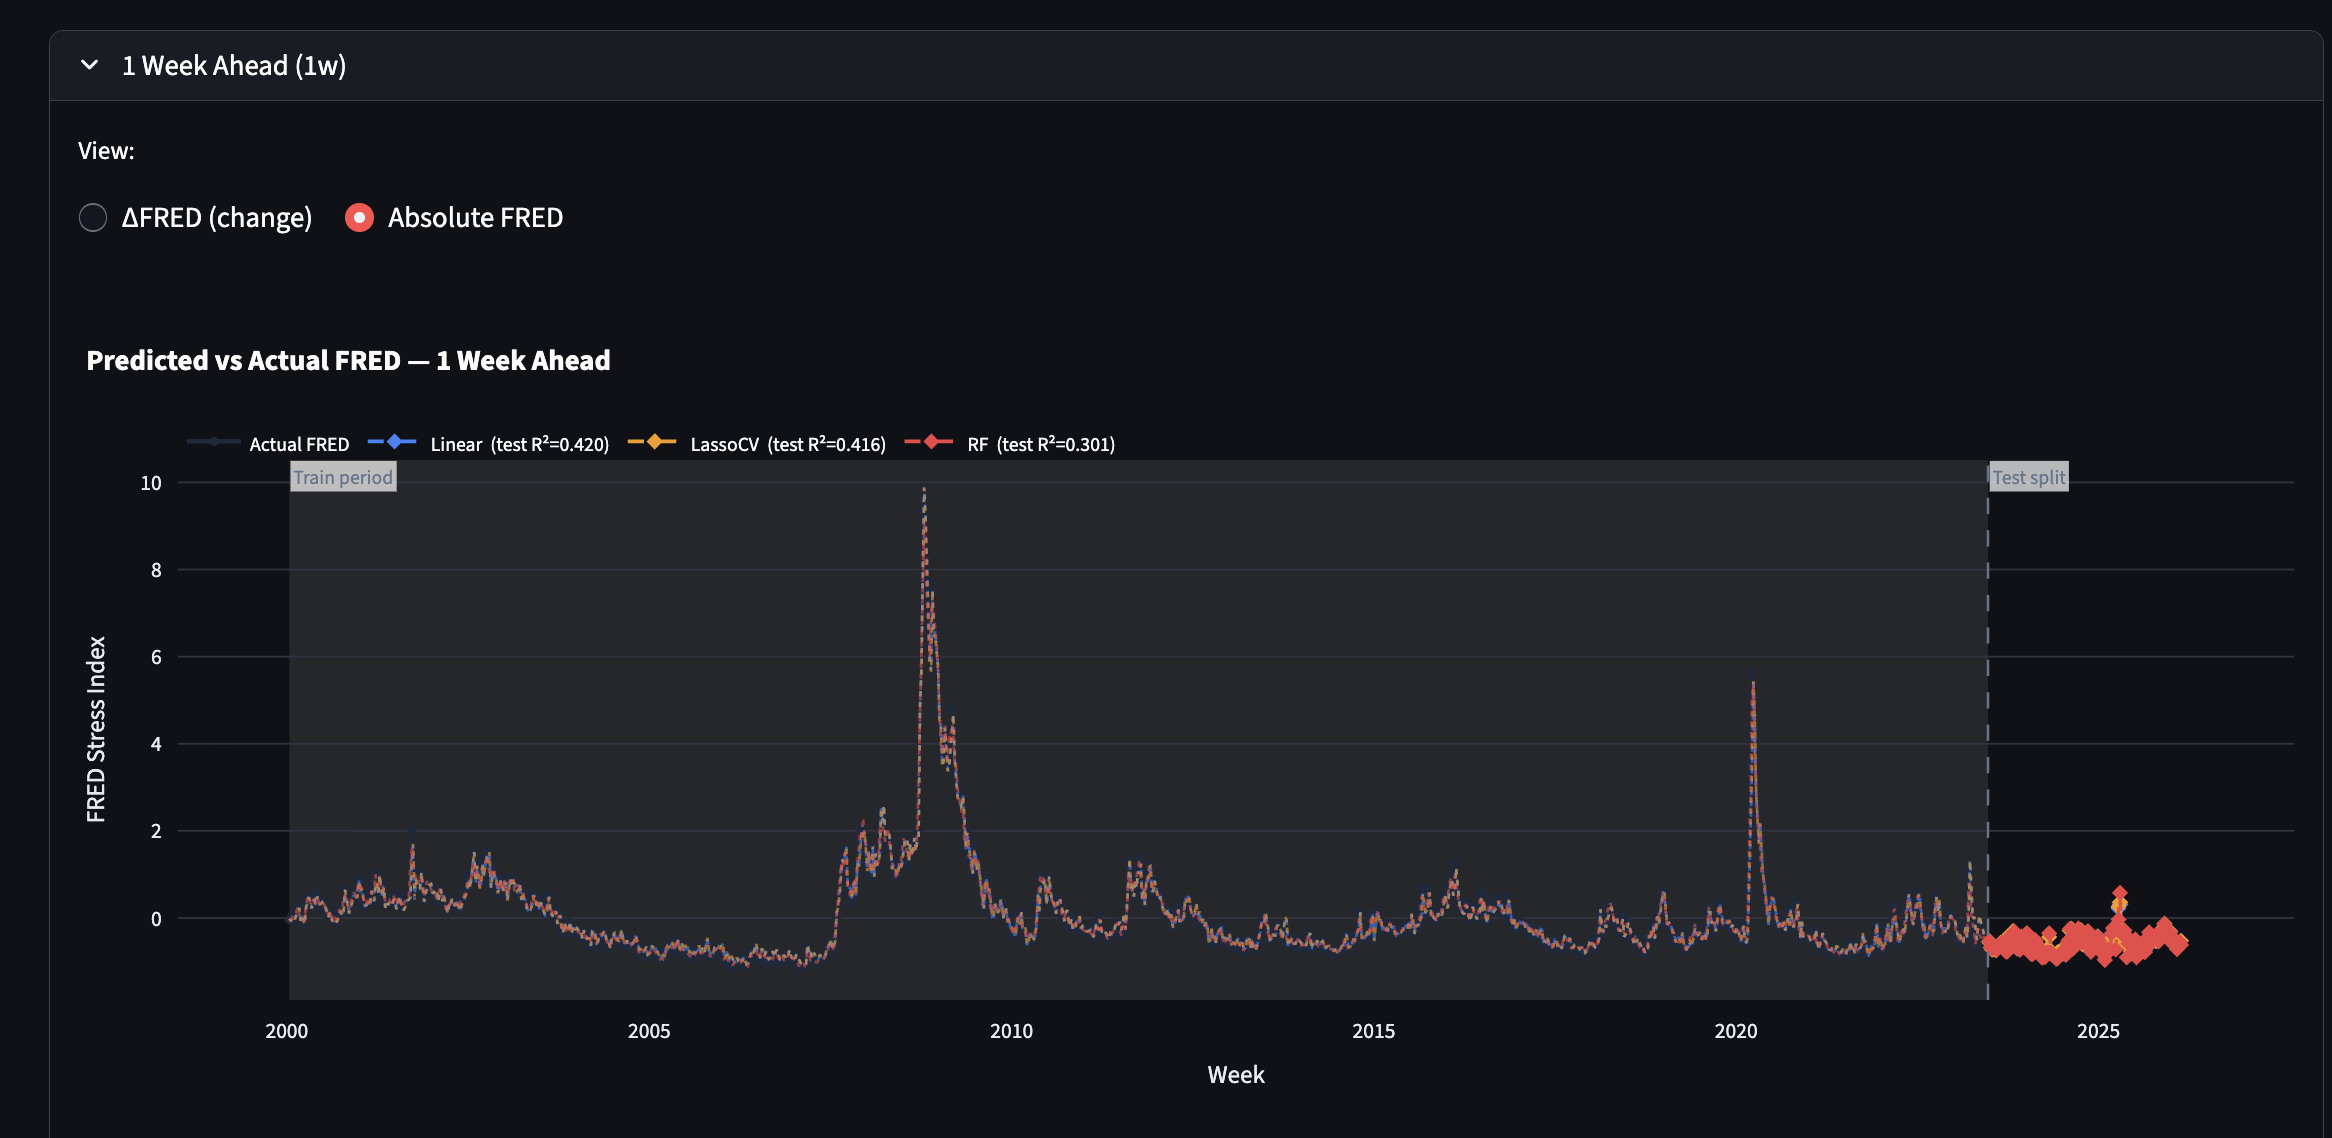
Analysis of how the Model forecasts the following week's FRED Score
-
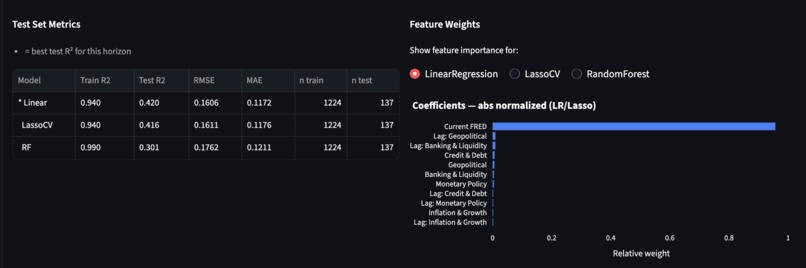
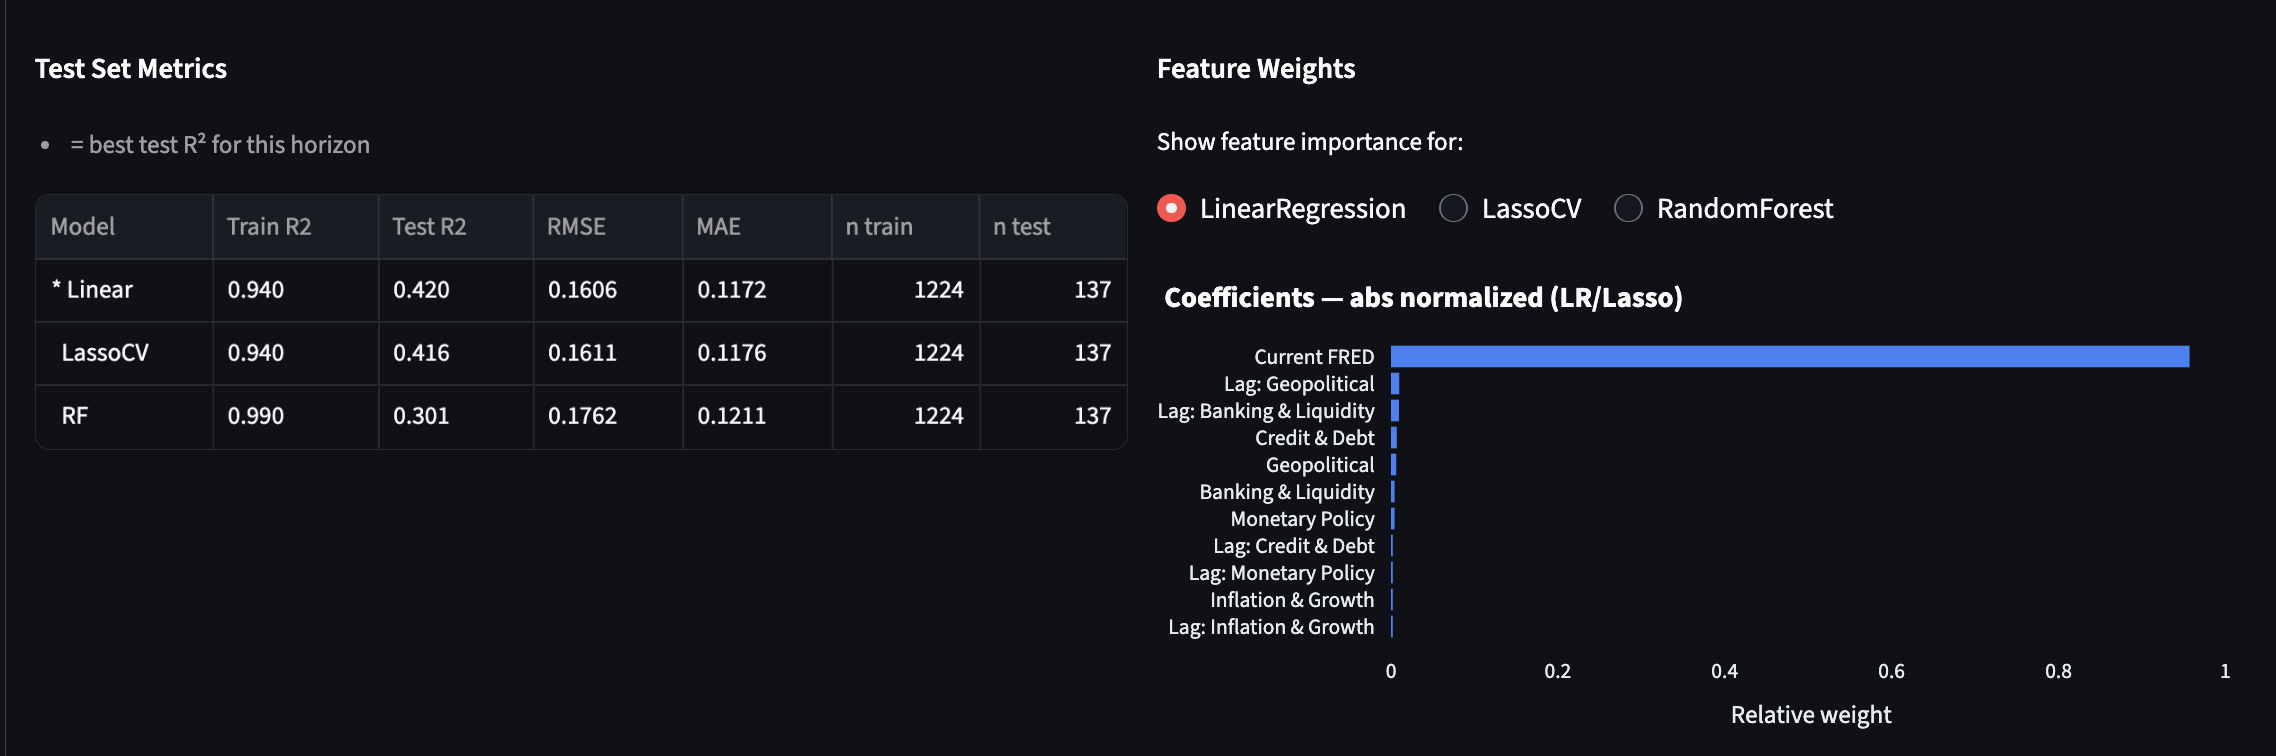
Metrics and options to see how different models relied on different weights for the theme parameters
-
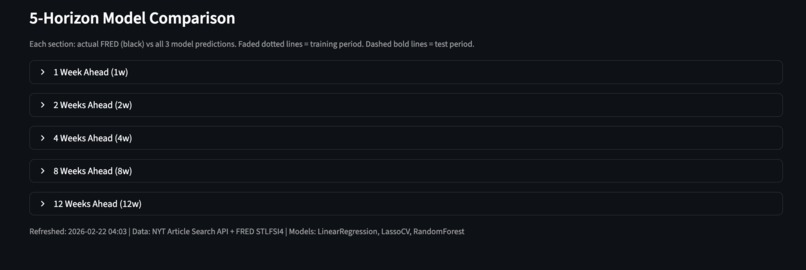
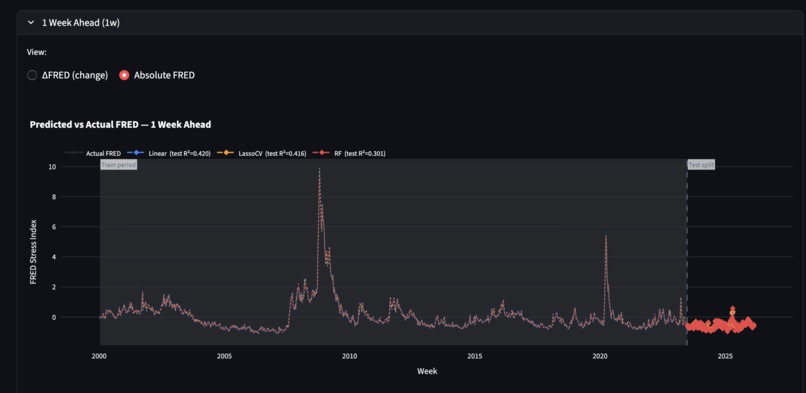
Models that forecast FRED Scores for various amounts of weeks in the future
Inspiration
Financial crises don't appear out of nowhere. They build slowly in the news before they show up in the data. The St. Louis Fed Financial Stress Index (STLFSI4) is a weekly measure published by the Federal Reserve that tracks the level of stress in US financial markets, but it captures stress after the fact. By the time it moves, markets have already reacted.
Most forecasting tools rely on historical market data, which is itself a reaction to events that have already happened. We took a different approach and read the news instead. A surge in banking crisis coverage, a shift in how reporters write about Federal Reserve decisions, or a wave of recession stories are early warning signs that models relying purely on numbers will always miss.
What it does
Financial Stress Monitor is an end-to-end pipeline that turns 25+ years of financial news (1999–2026) into predictive stress forecasts.
Collection. Articles are ingested from the NYT Article Search API and a Kaggle NYT dataset via 10 targeted queries mapped to 5 stress themes (monetary policy, credit/debt, banking/liquidity, inflation/growth, geopolitical risk). Up to 7 API keys rotate across calls to maximize throughput.
Classification. A two-stage LLM pipeline filters for relevance using Claude Haiku (batches of 30), then assigns each article up to 3 stress themes with direction (increasing/decreasing/neutral) and magnitude (1–3) using Claude Sonnet.
Aggregation. Weekly magnitude-weighted net sentiment scores per theme are computed and joined to FRED STLFSI4 data, with 5 pre-computed future target columns (1w, 2w, 4w, 8w, 12w ahead).
Modeling. 25 regression models (Linear Regression, LassoCV, Random Forest, XGBoost, LightGBM × 5 horizons) are trained on 11 features — 5 current-week theme scores, the current FRED score, and 5 lagged theme scores — predicting ΔFRED up to 12 weeks out.
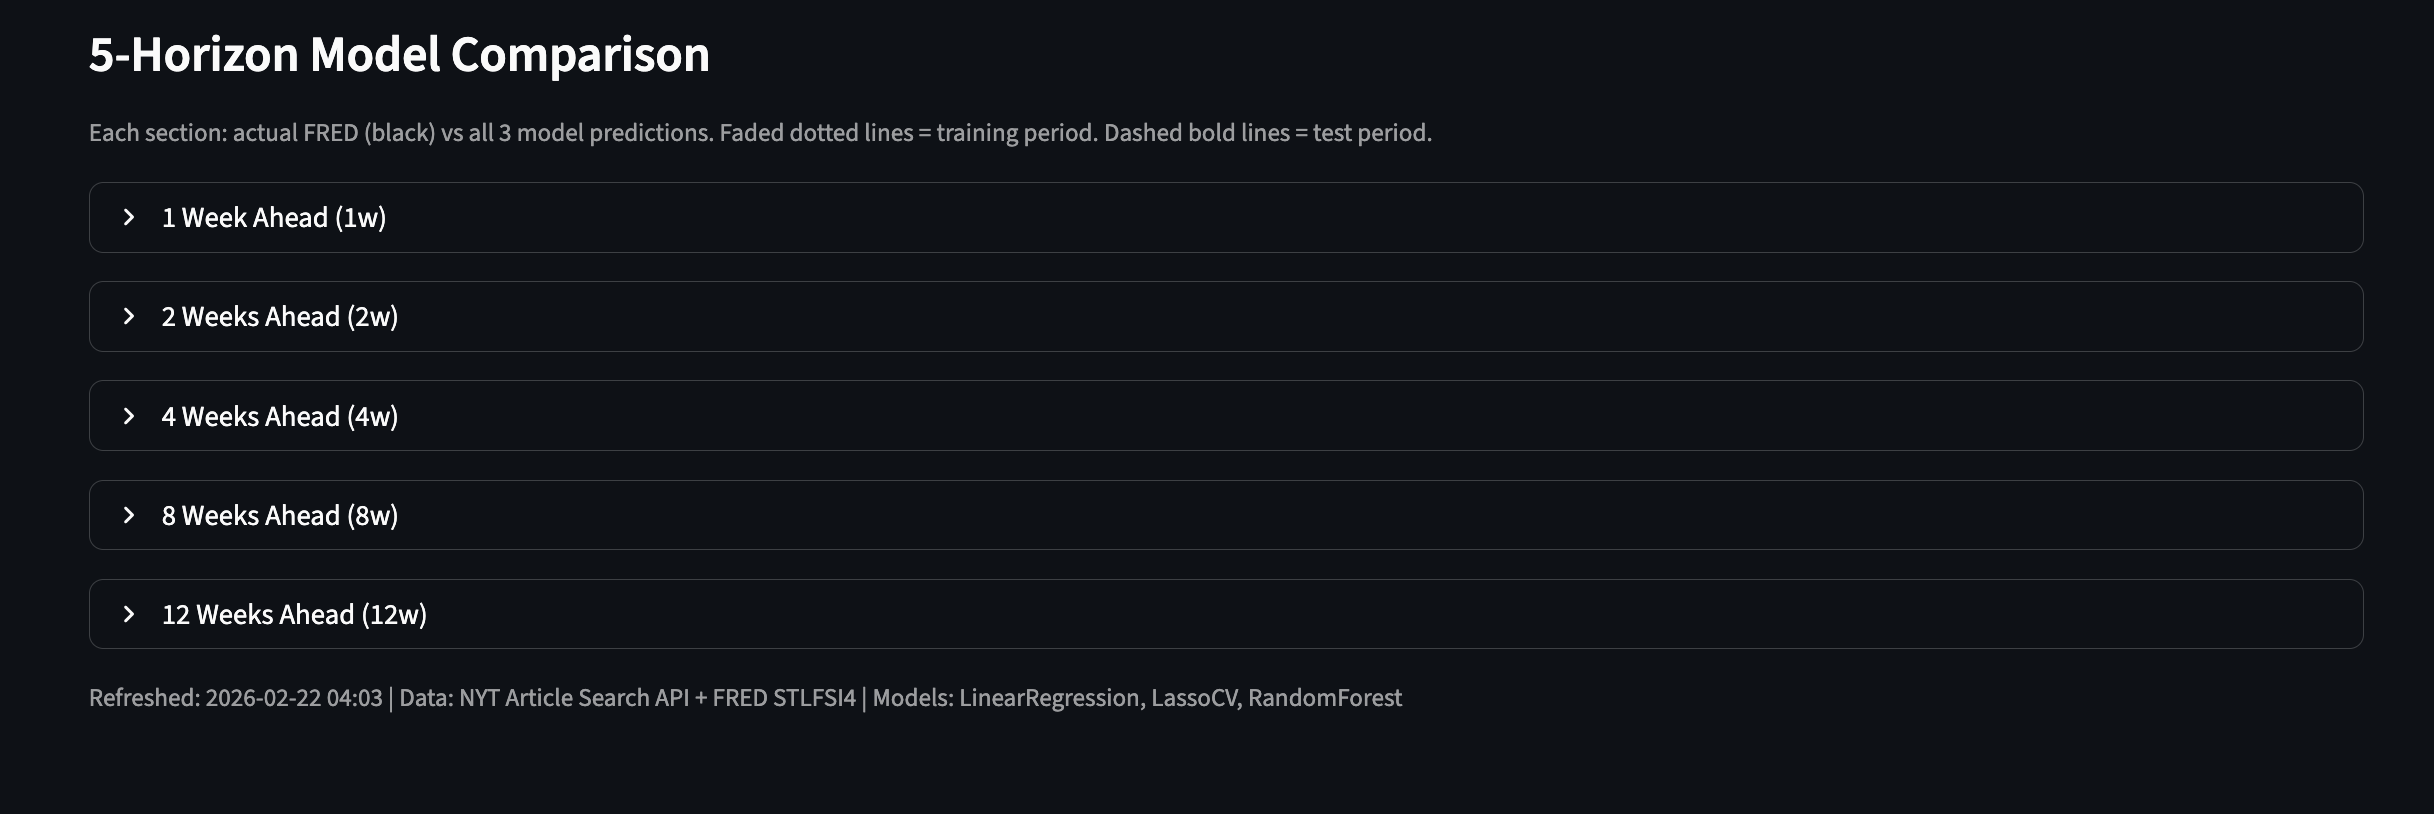
Dashboard. A Streamlit app surfaces current stress conditions, a 2-week forecast gauge, a divergence alert when the model pulls away from current FRED, a per-week article explorer sorted by magnitude, and a full Model Analysis tab with actual-vs-predicted charts, feature importance, and a metrics table comparing all 5 models across all 5 horizons.
How we built it
Data collection. We built a multi-source ingestion pipeline in Python. For historical coverage (1999–2023), we used a Kaggle NYT headlines dataset. For 2023–2026, we used the NYT Article Search API directly, issuing 10 targeted queries per 7-day window — each query designed to surface articles relevant to one of the 5 stress themes. To work within API rate limits we rotated up to 7 API keys and collected backwards from the most recent week, ensuring the freshest data was always captured first if the daily quota ran out. Merging the two sources required careful deduplication by normalized headline to eliminate cross-dataset overlap.
LLM classification pipeline. We built a two-stage Claude pipeline in classifier.py. The first stage runs a relevance filter using Claude Haiku in batches of 30 articles, tagging each article as financially relevant or not. The second stage runs a multi-theme stress classifier (also Haiku) in batches of 10, prompting the model to assign each relevant article up to 3 stress themes along with direction (increasing/decreasing/neutral) and magnitude (1–3). Getting the direction classification to correlate with STLFSI4 — rather than just general financial anxiety — required several prompt iterations. The key fix was an explicit instruction: direction must reflect realized stress with a clear transmission mechanism to credit markets, not just narrative concern.
Aggregation and FRED alignment. pipeline.py aggregates classified articles into weekly sentiment scores using magnitude-weighted net scoring per theme (+magnitude for increasing, −magnitude for decreasing). All week boundaries are normalized to Friday before aggregation so the Kaggle dataset (Monday weeks) and NYT API dataset (Friday weeks) align with FRED's Friday publication cadence. FRED STLFSI4 data is fetched via the FRED API and joined to each week using a ±10-day nearest-date match to handle holidays. Five future FRED columns (1w, 2w, 4w, 8w, 12w ahead) are pre-computed for use as training targets.
ML training. train_model.py trains 25 models (Linear Regression, LassoCV, Random Forest, XGBoost, LightGBM × 5 horizons) on 11 features — 5 current-week theme scores, the current FRED score, and 5 lagged (prior-week) theme scores. The training target is ΔFRED (change from current to future reading) rather than absolute FRED, which prevents the model from ignoring sentiment and simply extrapolating autocorrelation. We used a chronological 90/10 split (~1,226 train / ~136 test weeks) to evaluate out-of-sample performance on recent data. The best model per horizon (by test R²) is saved to disk; LightGBM with shallow trees (max_depth=3) won at 4–12 week horizons while Linear Regression won at 1–2 weeks.
Dashboard. We built a live Streamlit dashboard in app.py with two tabs. The Live Monitor tab shows the current FRED reading, a theme-level stress breakdown for the most recent week, a 2-week prediction gauge, and a divergence alert that color-codes the gap between predicted and current FRED. The Model Analysis tab renders actual-vs-predicted ΔFRED charts for all 5 horizons with train/test split markers, feature importance charts, and a full metrics table comparing all 5 models. A per-week article explorer (loaded on demand from the full classified dataset) lets users drill into which specific articles drove a given week's sentiment shift, sorted by magnitude score.
Challenges we ran into
Data gaps across 25 years: The Kaggle dataset has thin coverage after 2023, and the NYT API has rate limits (5 calls/min per key). We solved this by rotating 7 API keys, building an automatic gap-detection script, and parallelizing collection across machines — splitting the 1999–2025 timeline between team members running Phase 3 simultaneously.
LLM calibration for a specific target metric: Getting Claude to classify articles in a way that actually correlates with STLFSI4 — rather than just general financial anxiety — required several prompt iterations. The key insight was adding an explicit rule: direction must reflect realized US financial system stress, not narrative anxiety. A news article about a geopolitical risk doesn't increase financial stress unless there's a clear transmission mechanism to credit spreads or bank funding costs.
Finding a reliable news source: We needed a source with consistent financial coverage going back to 1999, available through an API with structured metadata. The NYT Article Search API fit that criteria but required careful query design — too broad and results were noisy, too narrow and entire stress themes would be underrepresented. For years before API coverage became reliable we supplemented with a Kaggle dataset, which introduced its own challenge of reconciling two sources with different formats, coverage densities, and duplicate rates.
Interpreting a short backtest: Training on an 136-week backtest period that spans mostly one stress regime produces negative test R² — not because the model is wrong, but because the SVB collapse creates a structural break the model hasn't seen. The full 1,362-week dataset is the real evaluation.
Autocorrelation dominance. Our first models were effectively useless — feature importance showed that fred_score absorbed 91–95% of model weight, meaning predictions were little more than 0.86 × current FRED. We fixed this by switching the target to ΔFRED (eliminating the autocorrelation signal by construction) and adding 5 lagged sentiment scores to capture momentum. After retraining, fred_score weight dropped to near zero and sentiment accounted for 14–37% of model weight. A secondary challenge was overfitting: Random Forest and XGBoost hit Train R² of 0.86–0.89 but collapsed to negative Test R². LightGBM with shallow trees and L1/L2 regularization proved most stable.
Accomplishments that we're proud of
Actually extracting signal from news. After diagnosing and fixing the autocorrelation dominance problem, sentiment features account for 14–37% of model weight and we achieve positive out-of-sample R² at 1–2 week horizons — outperforming a naive AR(1) baseline at every horizon beyond 1 week.
60,000+ articles classified across 25 years using a multi-theme schema (up to 3 themes per article, each with direction and magnitude) with no fine-tuning — entirely through prompt engineering.
A fully reproducible end-to-end pipeline — collection, dedup, relevance filtering, classification, aggregation, FRED alignment, training, and dashboard — wired together as scripts any team member can run in sequence from a fresh clone.
Systematic evaluation across 25 model combinations. Letting test R² determine the winner per horizon produced an empirical result: LightGBM generalizes better at longer horizons, linear models hold their own at short ones.
A dashboard that communicates uncertainty honestly. The divergence alert interprets the model's forecast gap in plain language; the Model Analysis tab shows train vs. test performance so users can see exactly where the model has been reliable and where it hasn't.
What we learned
We almost shipped a model where the sentiment pipeline was doing nothing. Feature importance is the first thing you check, not the last. We nearly moved on from a model where 91–95% of the predictive weight sat on a single feature — the current FRED score — and everything we'd spent weeks building was contributing near zero. Plotting feature weights before calling something done is now a hard rule for us.
LLM schema quality sets the ceiling. Coarse buckets (5 themes, magnitude 1–3, three directions) lose nuance that a domain expert would catch, and magnitude-weighted aggregation compounds that loss. We could swap in a better ML architecture and gain very little. Better classification at the article level is where the real headroom is.
Good training numbers can lie, and a short test window is how you find out. Model selection depends on the regime, not just the metric. Random Forest and XGBoost both looked strong on training data and fell apart on the test set — memorizing noise rather than generalizing. Without a long, diverse evaluation period, it's hard to tell the difference between a model that learned something real and one that got lucky.
Building end-to-end is harder than building each piece. Each individual component — API collection, LLM batching, FRED alignment, model training, dashboard — is tractable on its own. Making them all work together reliably, with consistent data schemas across sources that were built years apart, with error handling that doesn't silently corrupt the dataset, is where most of the real engineering time went.
What's next for StressPress
More prediction targets. STLFSI4 is one slice of systemic risk. We want to add the VIX, credit spreads (ICE BofA High Yield OAS), and other regional Fed stress indices — giving users visibility into whether sentiment is driving fear in equity markets, credit markets, or the broader financial system.
Richer news sources, and collect more data. NYT provides strong macro and policy coverage, but misses faster-moving signals from financial wire services, Fed speeches, earnings call transcripts, and SEC filings. Adding these sources — especially FOMC statements — would strengthen the 1–2 week horizons where information speed matters most. Also, capture data from other sources that may not be directly financial-related and turn that into data for our models.
Better classification. The current pipeline has no feedback loop. Future work would build a labeled evaluation set to measure per-theme classification accuracy, experiment with chain-of-thought prompting for directional nuance, and explore fine-tuning a smaller model on verified financial stress examples to reduce API cost at scale.
Built With
- claude
- csv
- fred-api
- kaggle
- lightgbm
- numpy
- nyt-api
- pandas
- python
- scikit-learn
- streamlit
- xgboost

Log in or sign up for Devpost to join the conversation.