Inspiration
A headline tour is one of the most expensive bets in entertainment: 20 cities, rooms booked months ahead, an opening act, and sponsors who want to know who's in the crowd. Those calls are still made from last tour's ticket counts, streaming dashboards and gut feel. Ask an LLM and you get the biggest cities in the country and Coca-Cola as a sponsor. Qloo knows where a particular artist's fans actually concentrate, which other artists they love, and what they buy. That's the missing input.
What it does
Headliner is an agent for live-music promoters and tour planners. Type an artist (or click a sample) and it makes the three expensive decisions of a tour, each grounded in Qloo calls it plans itself:
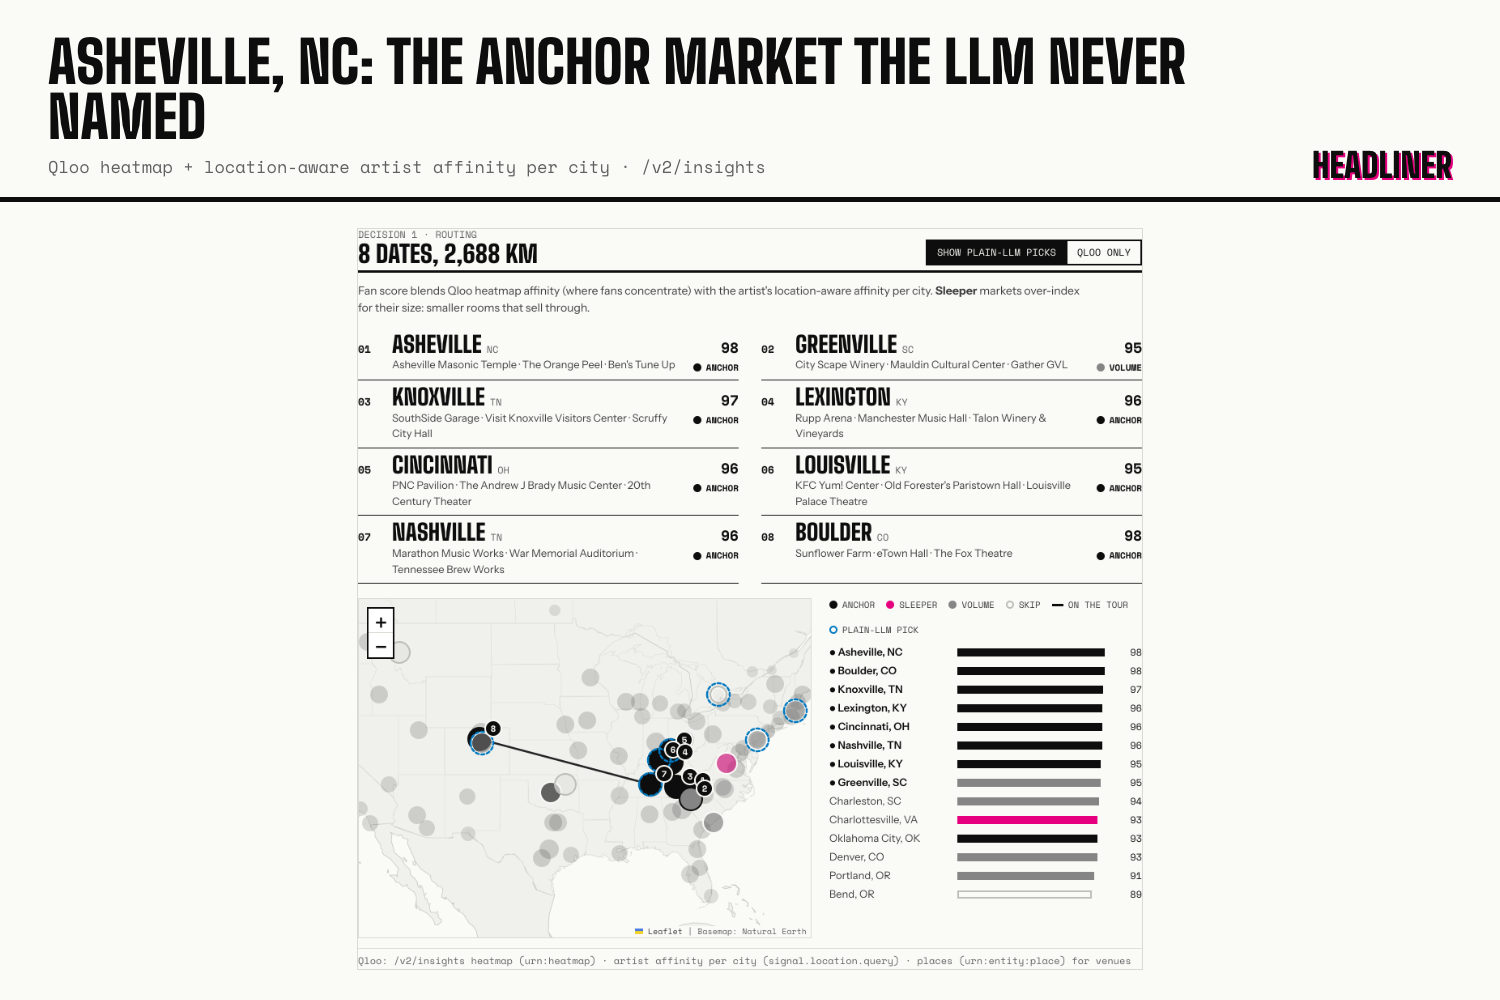
- Routing. A Qloo heatmap shows where the artist's fans concentrate across the region. Qloo's location-aware affinity scores each city, and the agent tiers markets (anchor, sleeper, volume, skip), orders them into a drivable route on a map, and pulls Qloo-matched venues for every stop. Sleeper markets are the point: cities where fans over-index for the city's size, which a promoter can sell out in a smaller room.
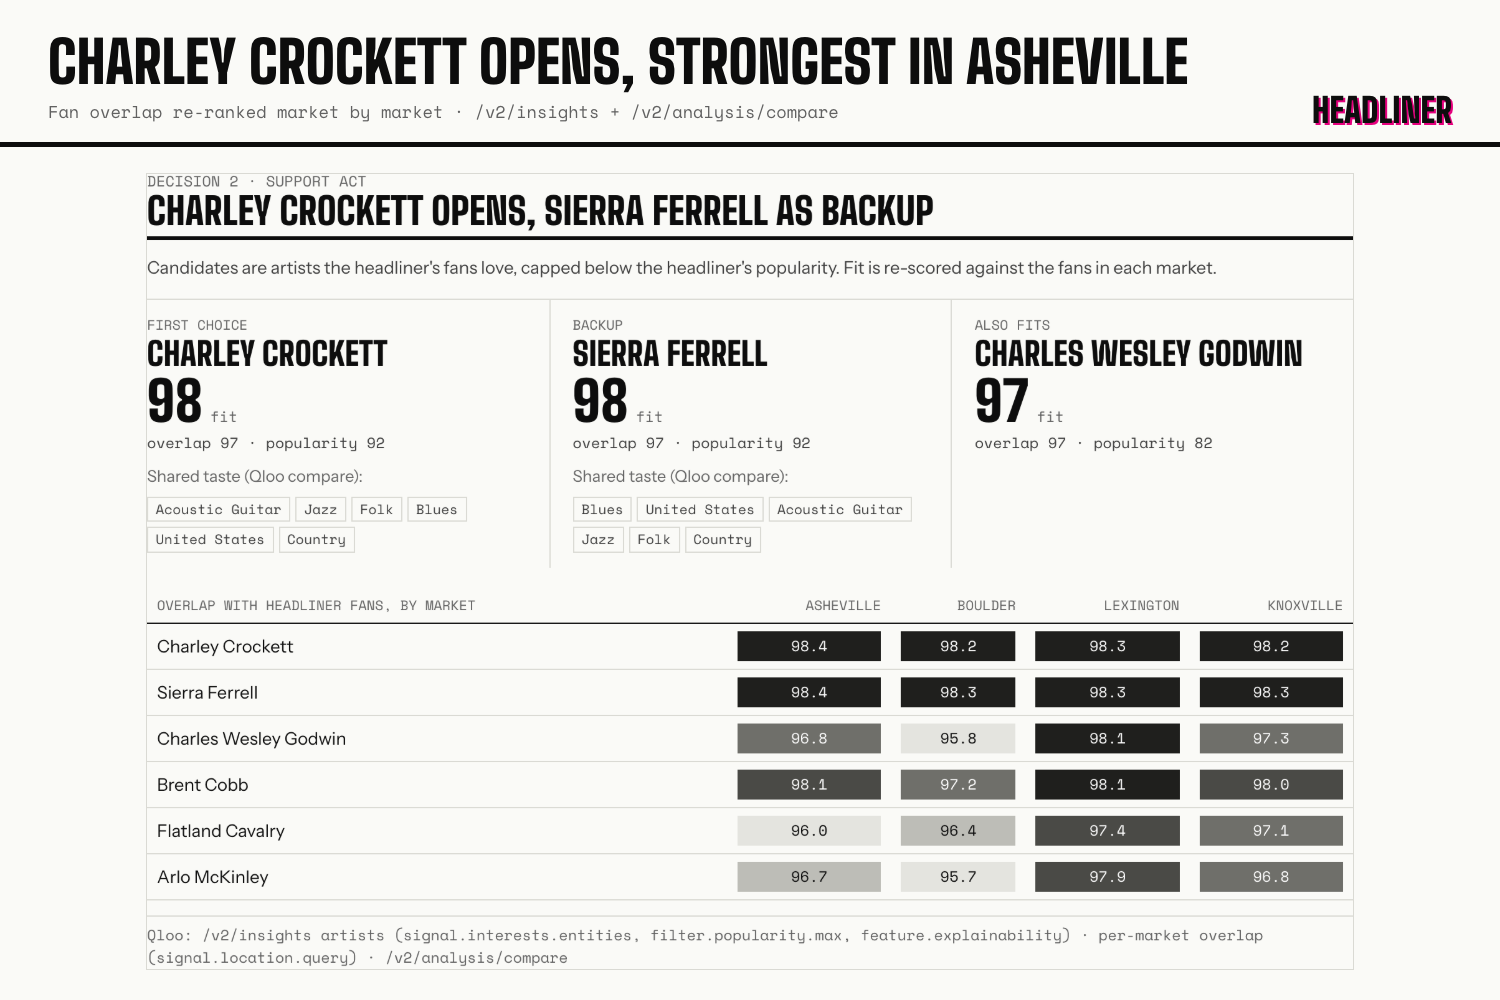
- Support act. Qloo returns artists the headliner's fans love, capped below the headliner's popularity. The agent re-ranks them against the fans in each market, because the right opener in Boston isn't always the right one in Burlington, and explains the overlap with Qloo's audience comparison (shared taste tags).
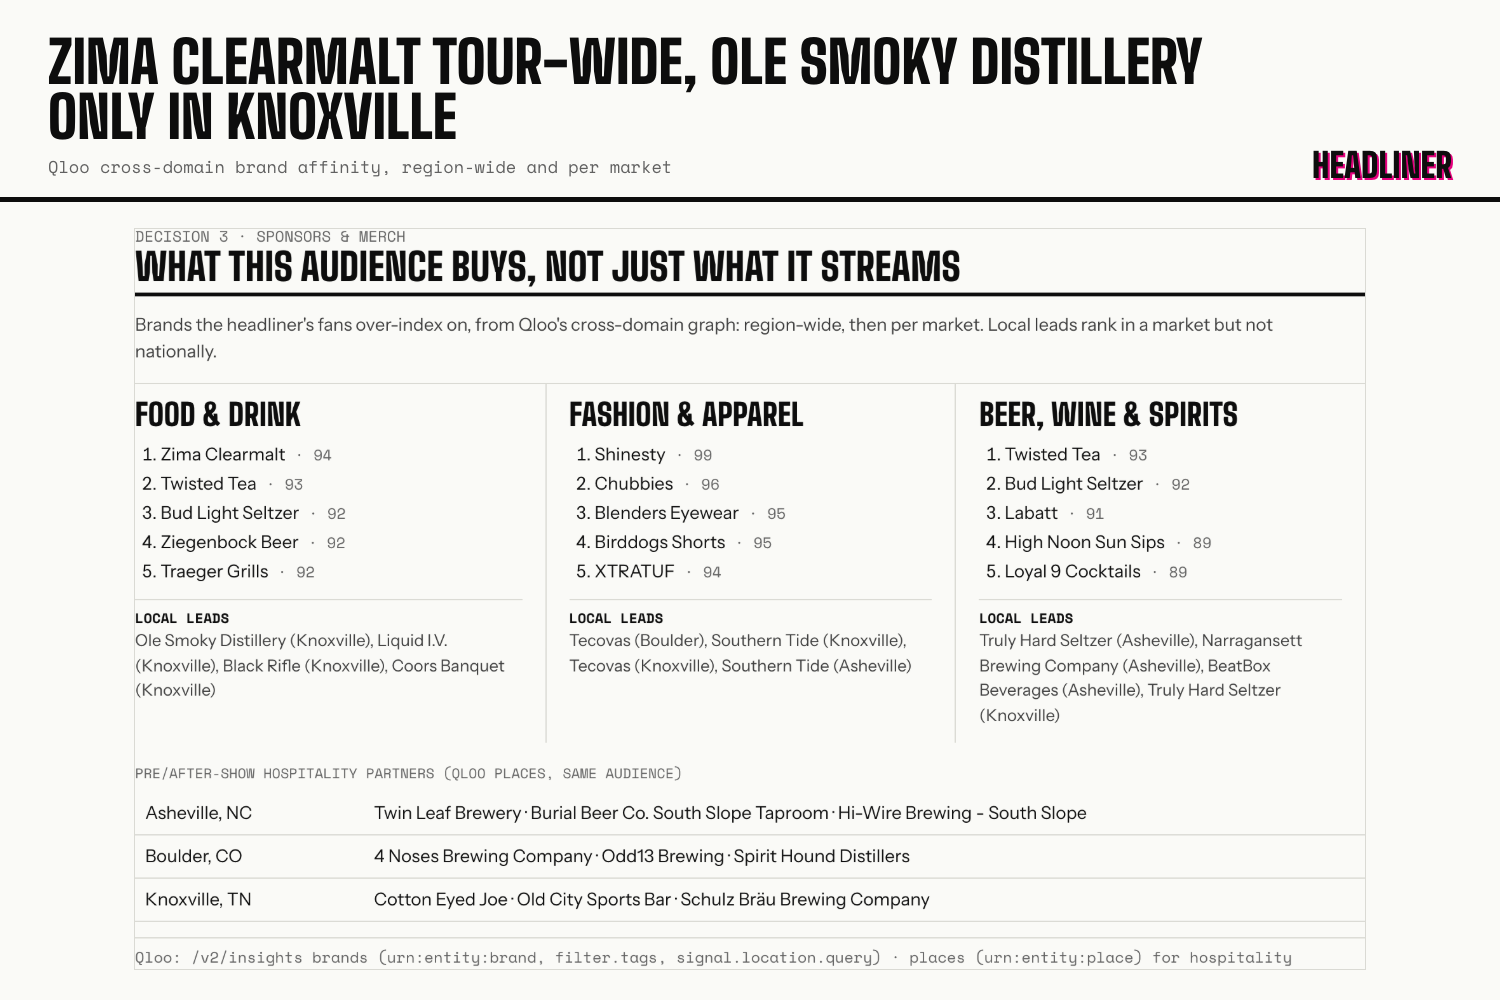
- Sponsors & merch. Qloo's cross-domain graph gives the brands this audience over-indexes on (food & drink, fashion, beer/wine/spirits), tour-wide and per market. That surfaces local-only activation leads and pre/after-show hospitality partners.
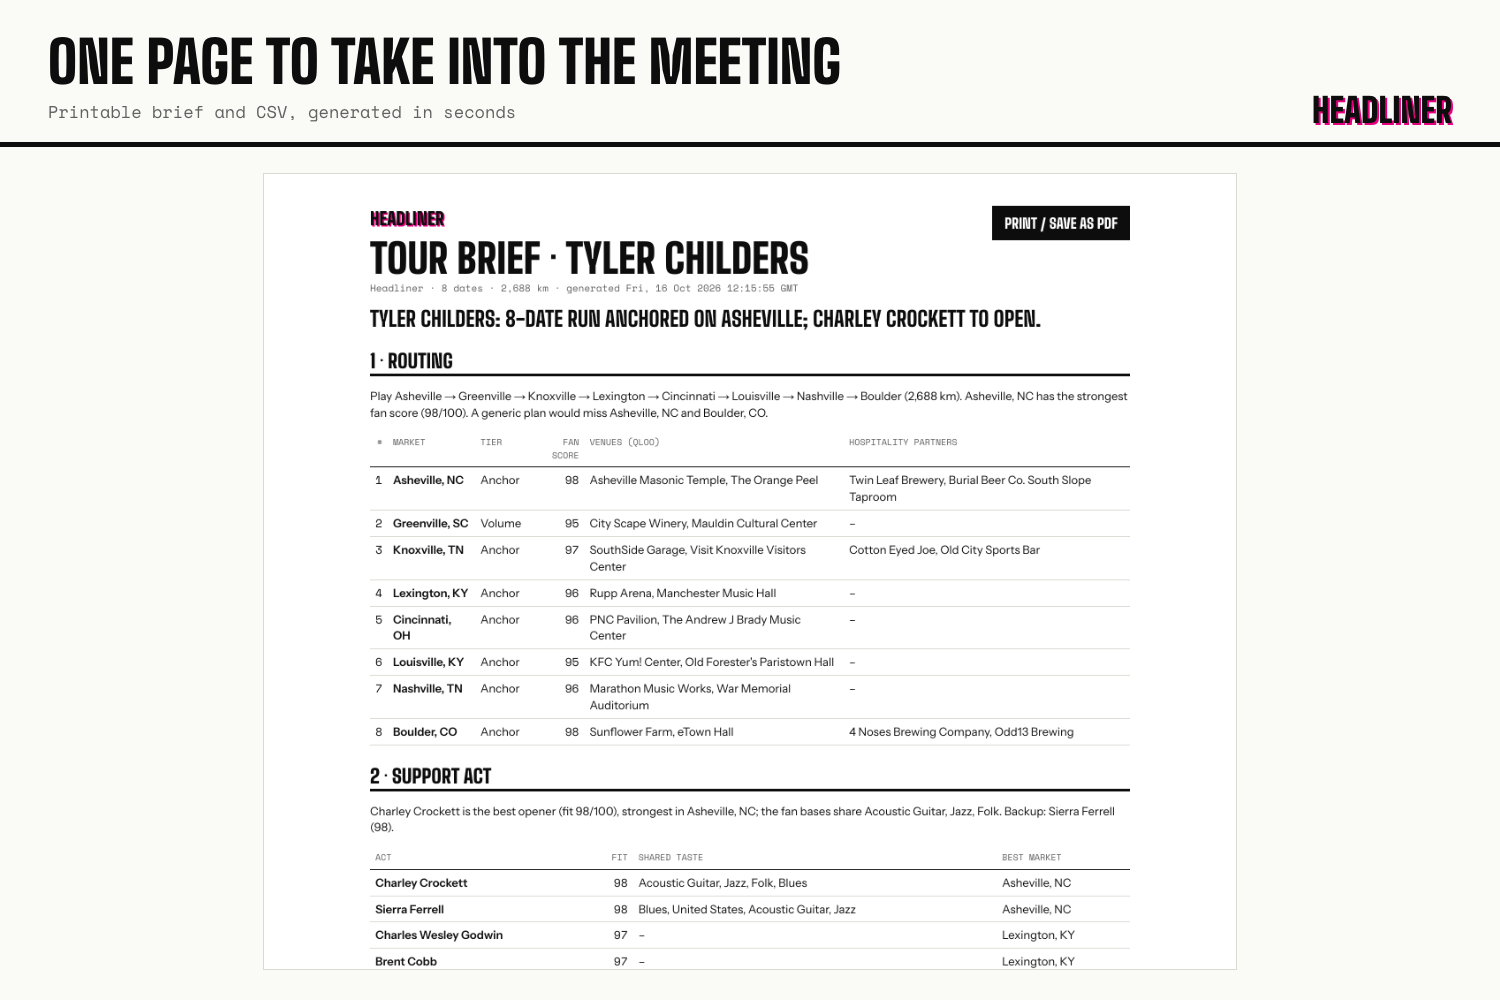
- The brief. One printable page and a CSV a promoter can take into a meeting.
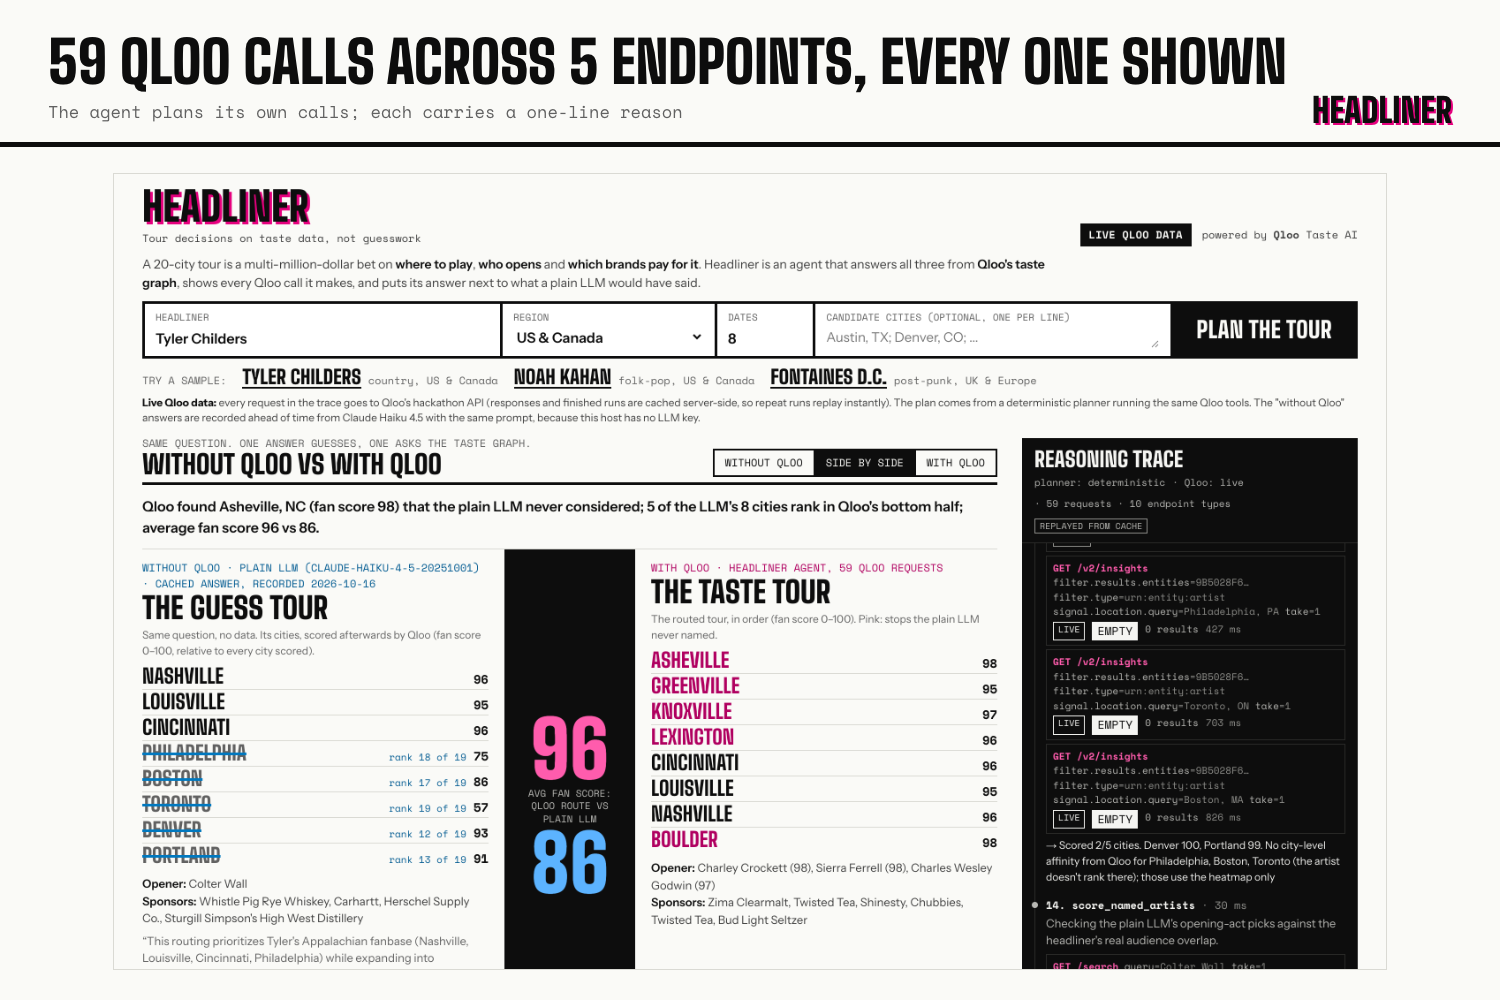
Every Qloo request (endpoint, parameters, result count, latency) streams into a reasoning trace as it happens.
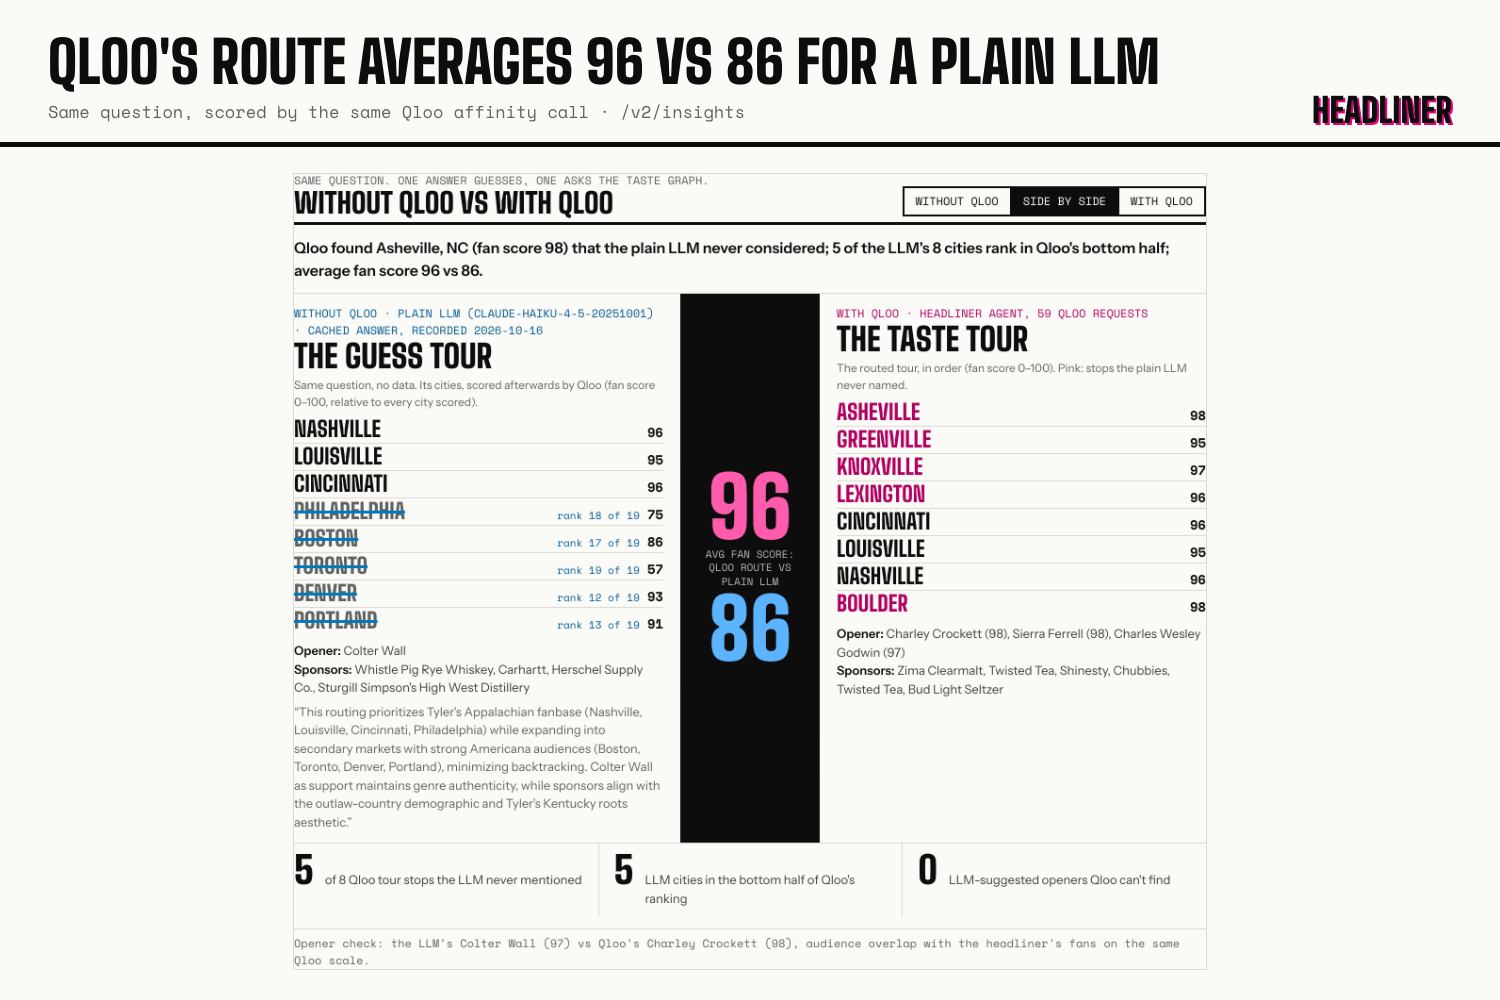
Without Qloo / with Qloo. The same question goes to the plain LLM with no tools. Headliner then fact-checks that answer with the same Qloo calls it used for its own plan. For an 8-date Tyler Childers tour, the plain LLM (Claude Haiku 4.5, same prompt, no tools; the demo serves its recorded answer) sends him to Philadelphia, Boston and Toronto. Qloo scores those cities 75, 86 and 57 for his fans, and 5 of the LLM's 8 cities land in the bottom half of Qloo's ranking. Headliner's route averages a fan score of 96 against 86, opens in Asheville, NC (98), a market the LLM never named, and picks Charley Crockett to open (fan overlap 98 vs 97 for the LLM's Colter Wall). The brief says it directly: "If your submission would work the same without Qloo, you're building the wrong thing." Headliner shows the gap as a number.
How we built it
- Next.js 15 + TypeScript, one app. The agent streams its events (steps, Qloo calls, the LLM baseline, the result) as NDJSON to a React UI with a Leaflet map and hand-built SVG charts.
- Agent: 12 tools, each wrapping documented Qloo calls. An OpenAI-compatible tool-calling loop lets the LLM choose the next tool, and every call carries a one-sentence reason that becomes the trace. A deterministic planner runs the same tools when no LLM is configured. A coverage guard refuses to finish a brief until routing, support act and sponsors are each grounded in Qloo results.
- Qloo client: typed endpoints validated with zod, the
hackathon.api.qloo.comhost enforced, retries on 429/5xx, empty-result flagging (Qloo silently ignores invalid parameters), and a server-side cache of responses and finished runs, so judges get instant replays. - Qloo endpoints:
/search,/v2/tags,/v2/insights(heatmap, artist, place, brand, tag, demographics),/v2/analysis/compare,/v2/trending. About 60 requests per plan. - Scoring: fan score blends heatmap affinity with location-conditioned artist affinity on Qloo's own 0-1 scale (times 100, not rescaled), so strong markets cluster in the 90s and a 10-point gap is large. Tiers compare each market with the rest of the region: over-index = concentration percentile minus volume (heatmap popularity) percentile.
- Deploy: Vercel (free tier). Qloo calls are live from the server; 16 artists are pre-run before each deploy so judges get instant replays, and any other artist runs live in about 15–25 s.
- Tests: 52 unit and integration tests (client, fixtures, scoring, contrast, CSV, the LLM loop with a scripted model, and the full agent on fixtures). One test asserts that every request uses only documented Qloo parameters.
Challenges we ran into
- No API key for most of the build. We wrote the client against the published reference and Qloo's own harness, then built a fixture mode by running the real agent against a schema-faithful stand-in.
scripts/qloo-smoke.shvalidated every call the moment the key arrived. - Silent failures. Qloo ignores invalid parameters, so a typo returns an empty list rather than an error. The client flags every empty result in the trace, and the smoke test checks that location parameters actually change the answer.
- Real data broke three assumptions. The locality heatmap boundary took about 50 s per call live, so the agent now folds geohash cells (2 s) into cities. Trending percentiles came back as rank fractions (0.11 = top 11%), not 0-100. Two cities of one metro (New York and Brooklyn) both made the route, so the planner now books one date per metro.
- No LLM key on the host. The plain-LLM answers are recorded ahead of time and labelled as cached in the UI; everything Qloo is live.
- Keeping the LLM honest. Tools return Qloo IDs and scores. The brief's numbers come from tool results and are never generated, and the coverage guard catches a model that tries to finish early.
Accomplishments that we're proud of
- The with/without comparison is measured, not asserted: the LLM's own cities are scored by Qloo.
- Sleeper-market detection: concentration vs volume from one heatmap call.
- Per-market support-act overlap, which no streaming "fans also like" list gives you.
- It looks and behaves like a product: one click, mobile-friendly, printable brief, CSV, no login.
What we learned
Taste data is most valuable where the decision is expensive and the obvious answer is wrong. The agent pattern earns its keep when every claim in the output can be traced to a call in the log.
What's next for Headliner
Ticketing and capacity data next to fan concentration (room-size recommendations), date-aware routing around festivals, multi-artist bills (co-headline compatibility), and an API for agency booking tools.
Known limitations (Qloo kit guidance)
- Qloo affinities describe aggregate audiences, not individuals. Headliner sends no personal data.
- Fan score is relative to the cities scored in a run, not an absolute demand forecast. It doesn't replace ticketing history.
- Venue capacity and availability aren't in Qloo, so venues are taste matches, not holds.
- The hackathon environment may lack data for some artists or regions. Empty results are shown, not hidden.
Request-to-result example (redacted)
GET https://hackathon.api.qloo.com/v2/insights
    ?filter.type=urn:heatmap
    &signal.interests.entities=<Tyler Childers entity ID>
    &filter.location=POLYGON((-125 24, -66 24, -66 50, -125 50, -125 24))
    &output.heatmap.boundary=urn:geohash
    &take=50
X-Api-Key: <redacted>
→ results.heatmap[]: { location: {latitude, longitude}, query: {affinity, affinity_rank, popularity} }
→ 10,846 geohash cells, folded to 14 cities; affinity high + popularity low = "sleeper" market
  (live: Charlottesville, VA, fan score 93, over-indexes +0.26 for its size)
Built With
- claude
- leaflet.js
- llm-tool-calling
- natural-earth
- next.js
- node.js
- openai-compatible-api
- qloo
- qloo-insights-api
- react
- typescript
- vercel
- vitest
- zod

Log in or sign up for Devpost to join the conversation.