-
Bivariate Relationships
-
Linear Multiple Regression Model
-
Conditions for Inference
-
Conditions for Inference
-
Conditions for Inference
Purpose:
The Human Development Index (HDI) is a composite statistic of life expectancy, education, and per capita income indicators, which is used to rank countries into four tiers of human development. The formula for calculating HDI is: L^(1/3) * E^(1/3) * I^(1/3) where, L = Life expectancy at birth; E = Mean years of schooling; I = Gross National Income per capita in dollars.
Human development is a measure of the standard of living of a given population. We believe that there are variables that affect life expectancy, education and per capita income and therefore, indirectly contribute to the HDI. Our group is interested in studying some of these indirect variables and calculate an alternate formula that can be used to predict HDI.
Specifically, we are interested in associations (if any) with the population’s access to technology, gender equality in the political sphere, and perception of corruption among the general population. We are interested in these particular variables because developed nations are typically characterised by advanced technological infrastructure, widespread gender equality and transparency in governmental instituitions. We hope to investigate how accurately we can predict HDI using this criteria.
Hypothesis:
Determine whether the Human Development Index is correlated with access to technology (broadband use and cell phone use), gender equality (seats held by women in parliament and non-discrimination clause in the constitution) and perception of corruption.
Data:
We will be using the following publically available datasets:
Population:
Each observational unit is a single country and the larger population we are trying to generalize to are also countries. We will only be considering countries for which data is available for all our explanatory variables. Roughly, we will be looking at over a hundred countries.
Response variable:
Our response variable is the Human Development Index (HDI) up to 2015. The HDI scores for each country are measured in HDI points. The range of possible values is between 0 and 1.
Explanatory variables:
- Fixed broadband subscriptions: Fixed broadband subscriptions refers to fixed subscriptions to high-speed access to the public Internet (a TCP/IP connection), at downstream speeds equal to, or greater than, 256 kbit/s. The values are in millions of people.
- Non-discrimination clause mentions gender in the constitution: This is a qualitative variable where 1 indicates that the country’s constitution includes gender in its non-discrimination clause and 0 indicates that it does not.
- The Corruption Perception Index (CPI): The CPI is an annual ranking of countries by their perceived levels of corruption. The CPI defines corruption as the “misuse of public power for private benefit.” The CPI is measured and calculated through opinion surveys and assessments. Countries are ranked on a scale from 100 (Very clean/Very little corruption) to 0(highly corrupt).
- Proportion of seats held by women in national parliaments (%): Women in parliaments means the percentage of parliamentary seats in a single or lower chamber held by women from 1985 to 2014.
- Cell phone use (%): Cell phone use means Mobile-cellular telephone subscriptions per 100 inhabitants. Since cell phone was invented in 1973, we only use data since 1985 when it started to show trend of prevalence.
Abstract:
The goal of our project is to understand the possible association between Human Development Index in response to technological infrastructure, gender equality in the political sphere and the perception of corruption in a country. To quantify these variables, we used broadband and cellular subscription data, percentage of females in political institutions and the Corruption Perception Index (CPI). In our analysis, we found that the percentage of female seats does not have a statistically significant relationship with HDI. However, there is strong statistical evidence that CPI and broadband and cellular subscriptions are related to HDI. Also, we found that this model works really well on developed countries which tend to emphasis technology, gender equality and transparency.
Introduction:
The Human Development Index (HDI) is a measure of a country’s standard of living measured by life expectancy, education, and per capita income. We believe that there are variables that affect those three indicators and therefore, indirectly contribute to the HDI. Our group is interested in studying some of these indirect variables and the significance of their impacts on HDI (if any) to therefore create an alternative formula that calculates HDI using indicators which are more relatable for people and that we believe to be important measures for a country’s standard of living. We chose technology, gender equality and corruption perception as three possible measures in relation to HDI. HDI is our response variable and broadband use, cell phone use, percentage of seats held by women in parliament, non-discrimination clause in the constitution and corruption perception index are our explanatory variables. Our null hypothesis is that those three indicators do not have statistically significant effects on HDI while our alternative hypothesis is that at least one of them has a statistically significant impact. We assumed that developed nations generally have a more advanced technological infrastructure, higher participation by women in politics and higher transparency in governmental institutions. We fitted a linear multiple regression model and found when the other explanatory variables are held constant, except for percentage of seats held by females in congress, all other variables appear to be statistically significant. We also investigated collinearity among our explanatory variables to examine percentage of female seats in relation to HDI alone. Conditions of inference are met for us to draw possible insights from this model.
Data:
We have 144 countries in our dataset. Each observation in our data set is a country. Each country has a measure of HDI, CPI, number of citizens per 100 citizens with cellphone subscriptions, number of citizens with broadband subscriptions, percentage of seats held by females in government, and whether a gender nondiscrimination clause is in the constitution. The Human Development Index (HDI) is a measure of the quality of life of the inhabitants of a country, and it is calculated as follows: HDI = Health^(1/3) * Education^(1/3) * Income^(1/3). Health, education, and income are three dimensional indices calculated through life expectancy, mean years of school, expected years of schooling, and GNI per capita values for each country. The HDI scores has a possible value between 0 and 1. The formula predicts that countries with higher HDI scores are more developed and have higher standards of living for its citizens compared to countries with lower HDI scores. The HDI is published by the United Nations Development Program. The CPI scores are used as a measure of how corrupt a country is seen to be through assessments and surveys. The CPI score is calculated on a scale from 0 to 100. Low scores, closer to 0, indicate that a country is perceived to be highly corrupt while high scores, closer to 100, indicate that a country is perceived to be very clean. Countries included in the CPI ranking are those that are present in at least 3 of the CPI’s data sources. The CPI is published by Transparency International. Cell Phone use for each country is measured as the number cell phone subscriptions per 100 inhabitants. The cell phone use data is collected from telecommunication regulatory agencies, ministries, and national statistics offices through an annual survey. Broadband use is interpreted as the number of fixed subscriptions to access to the public internet within each country. This measure excludes subscriptions that have access to the internet through mobile-cellular networks. The broadband subscription numbers are collected from the International Telecommunication Union and the Telecommunication/ICT Development Report and database. The proportion of seats held by women in parliament is expressed as the percentage of all parliament seats in a country that are occupied by women. These proportions are gathered from the Inter-Parliamentary Union(IPU). The nondiscrimination clause mentions gender in the constitution is a discrete variable with only two values, 0 and 1. 0 means the country does not have a nondiscrimination clause in the constitution that mentions gender, and 1 means the country does have a nondiscrimination clause in the constitution that mentions gender. This data is collected from the Women, Business, and the Law group of the World Bank. --Need to include R code and explanations for univariate analysis--
Model:
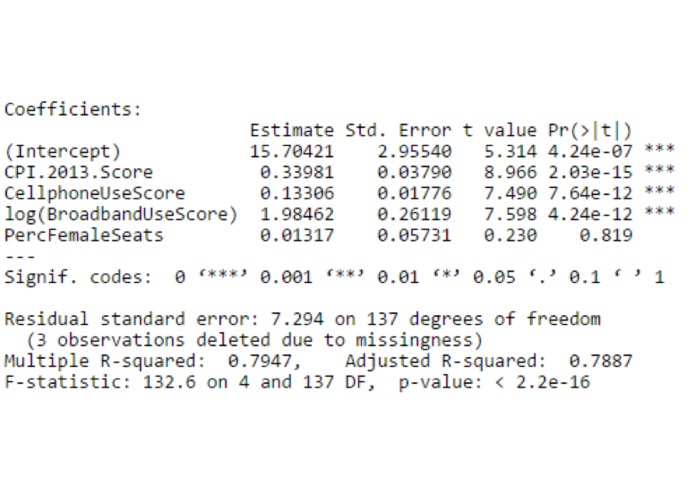
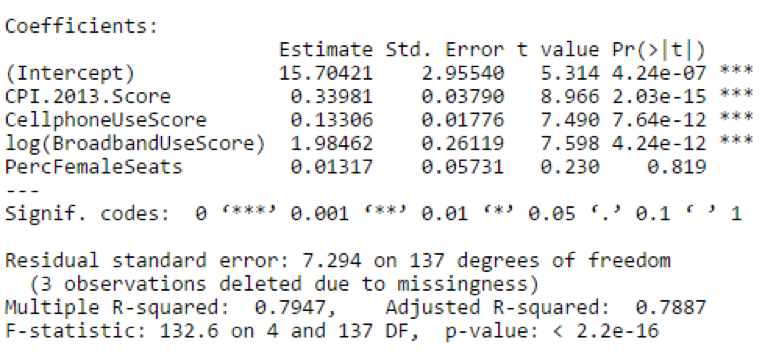
We chose to remove the qualitative variable, non-discrimination clause in the constitution from our analysis because 74 countries had missing data for that variable. Since we were working with 144 countries in total, that would have reduced our dataset to half. A lot of the removed countries are well known - like Australia and Italy while lesser known countries like Burundi are kept in and we were unsure if this was because of ambiguity in policy or some other reason. Furthermore, the distribution of broadband subscriptions was right skewed so we did a log transformation to obtain a normal distribution. HDI ranges between 0 to 1 so we multiplied the HDI column by 100 to convert it into a percentage. This allowed for easier interpretation of our coefficients. We fit a linear multiple regression model with HDI as the response variable and CPI, percentage of female seats, cell phone subscriptions and the log of broadband subscriptions as our explanatory variables. We obtained the following equation from the results of our regression model. HDI = 15.704 + 0.33 * CPI + 0.13 * CellphoneUse + 1.98 * log(BroadbandUse) + 0.01 * percFemaleSeats
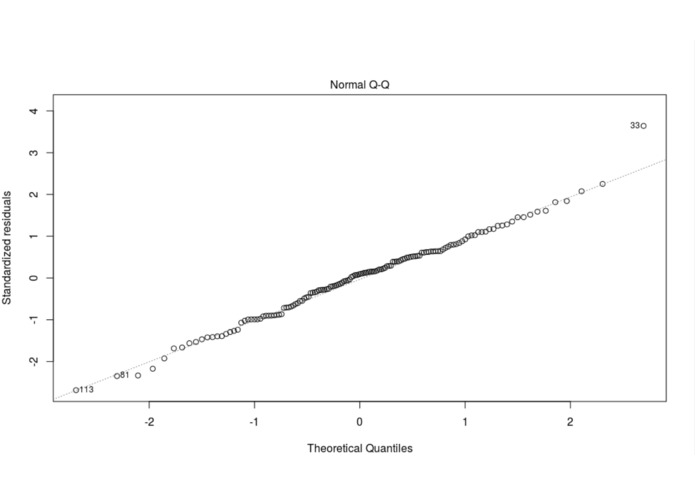
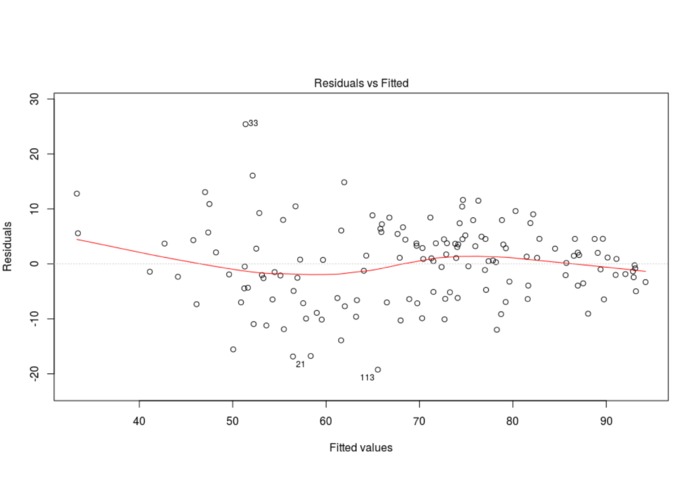
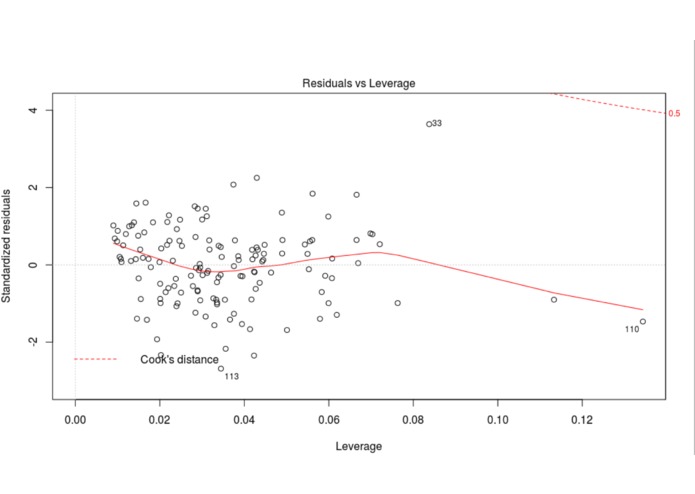
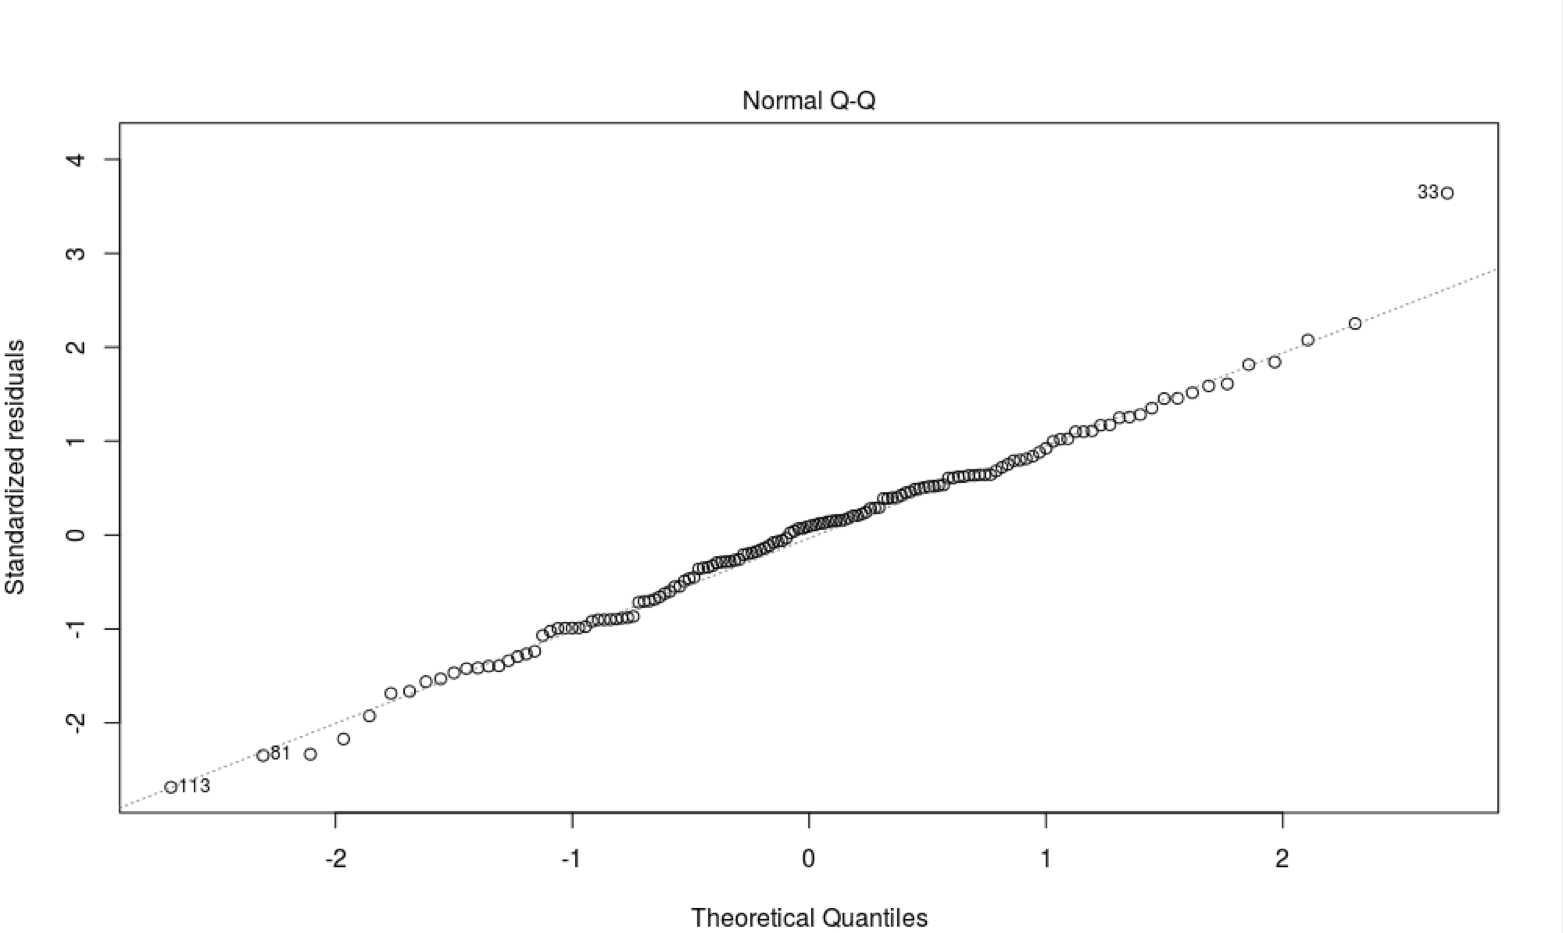
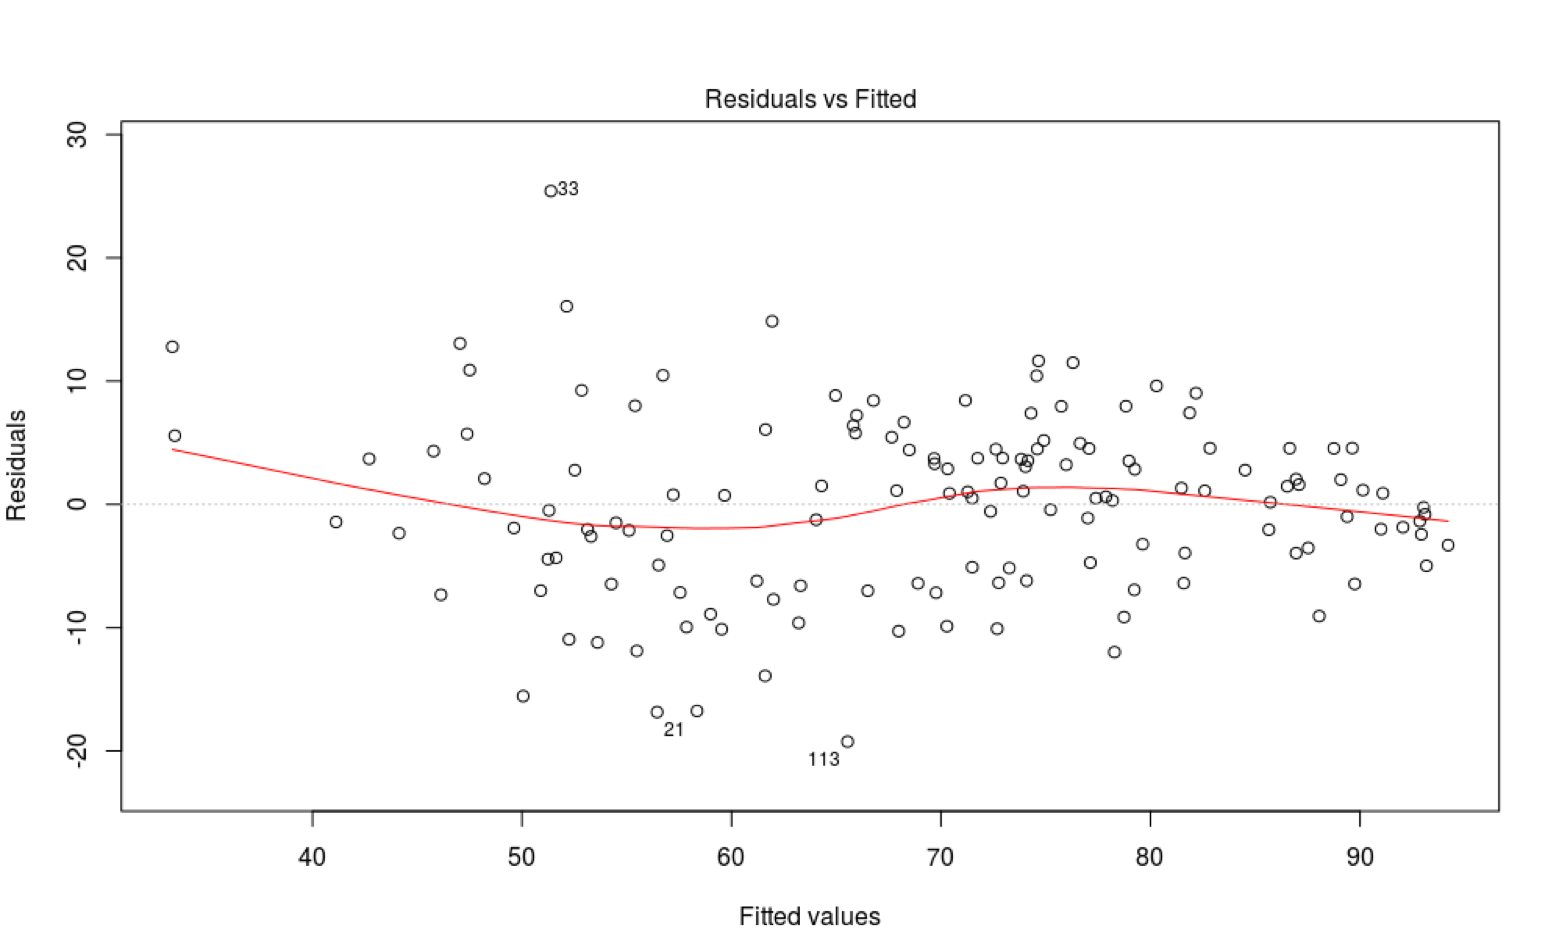
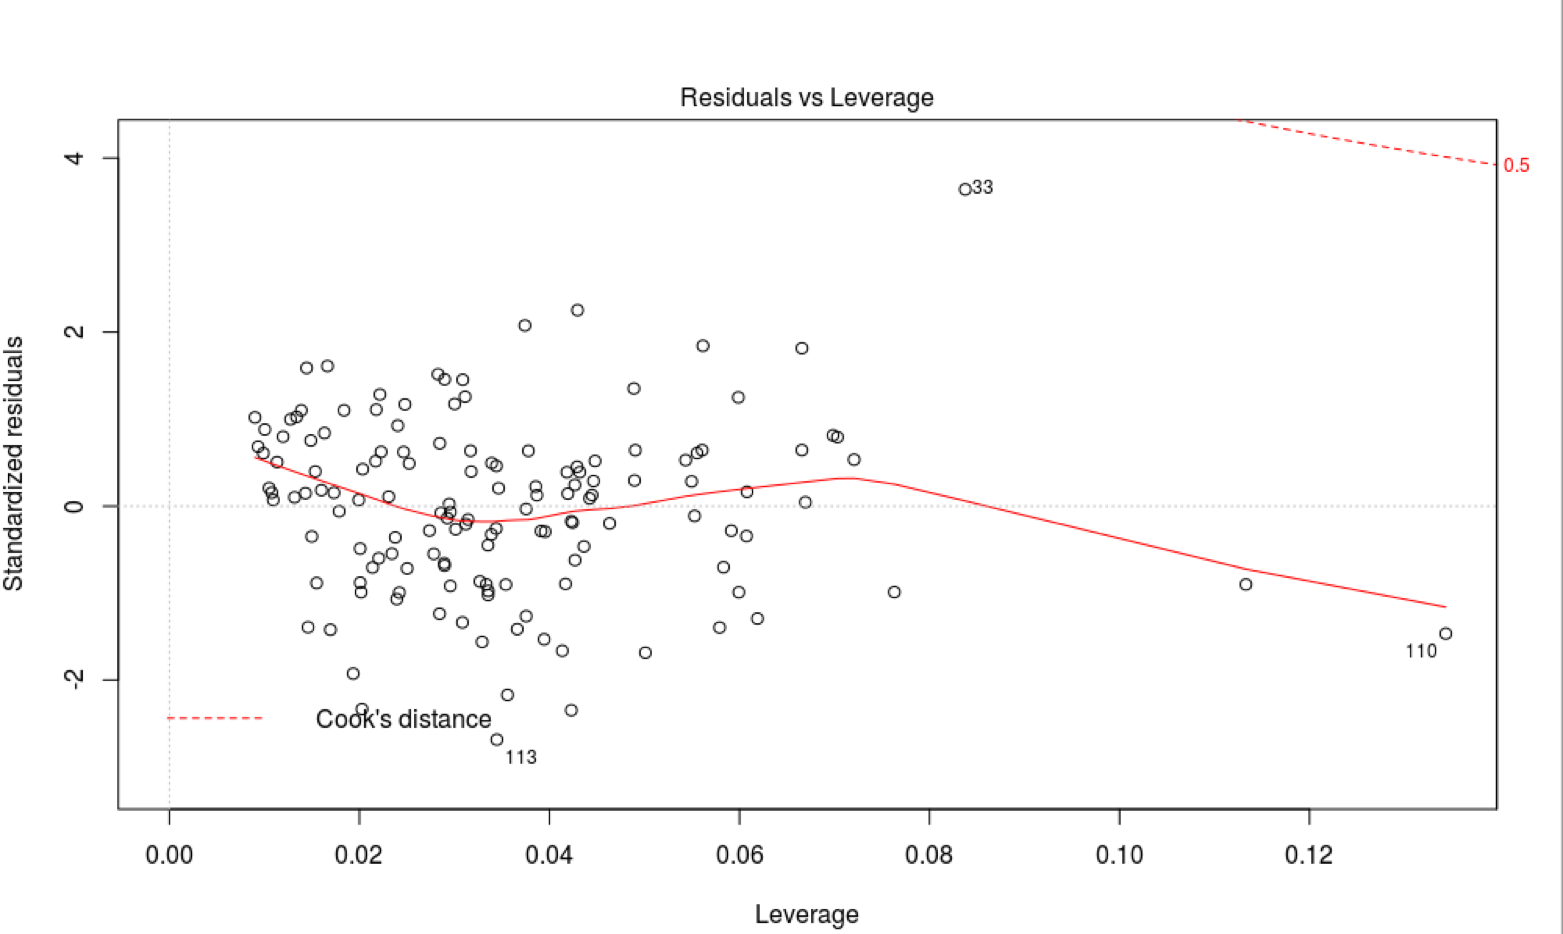
We also looked at the regression plots to verify conditions for inference. The Residuals vs. Fitted plot shows that our data points are linearly distributed and have equal variance. The Q-Q plot shows that the residuals are normally distributed. The independence condition is a little tricky for our dataset because data for one country may be influenced by data for another country due to many reasons including, but not limited to, geographical proximity and political alliances. However, for the purpose of our model, we are assuming that the independence condition is sufficiently satisfied. There were no influential points that exerted undue leverage.
For this analysis, we set our alpha-level to 5%.
Results:
Percentage of female seats did not provide any additional explanatory power for HDI above what was already accounted for by broadband use, cell phone subscriptions and the Corruption Perception Index. From the latter, the CPI is the most statistically significant indicator followed by cell phone subscriptions and broadband subscriptions.
Controlling for other variables, an increase in cell phone subscriptions by one unit per 100 inhabitants is expected to increase the HDI by 0.133 percentage points, an increase in broadband subscriptions by one is expected to increase the HDI by 1.984 percentage points, and an increase in CPI by one percentage point is expected to increase HDI by 0.33% percentage points. Also, an increase in percentage female seats by one percentage point is expected to increase HDI by 0.01% percentage points, but it is not statistically significant based on its very small coefficient with a very large p value.
The adjusted r-squared value indicates that 78.8% of variability in HDI is explained by the regression model. The standard error indicates that our expected values are, at an average, 7.3% off from our observed values.
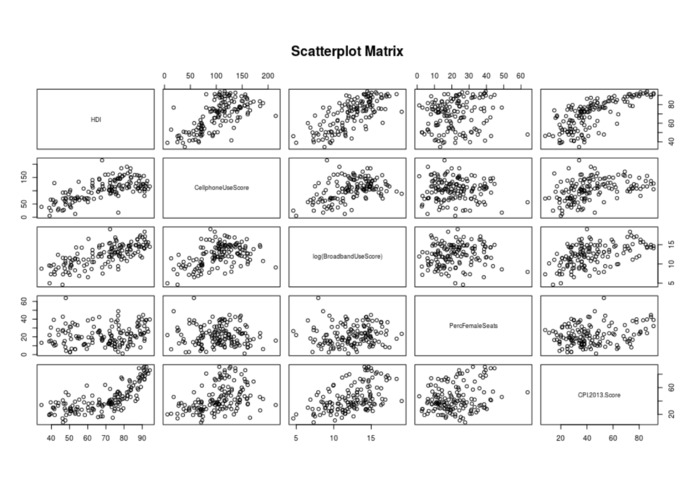
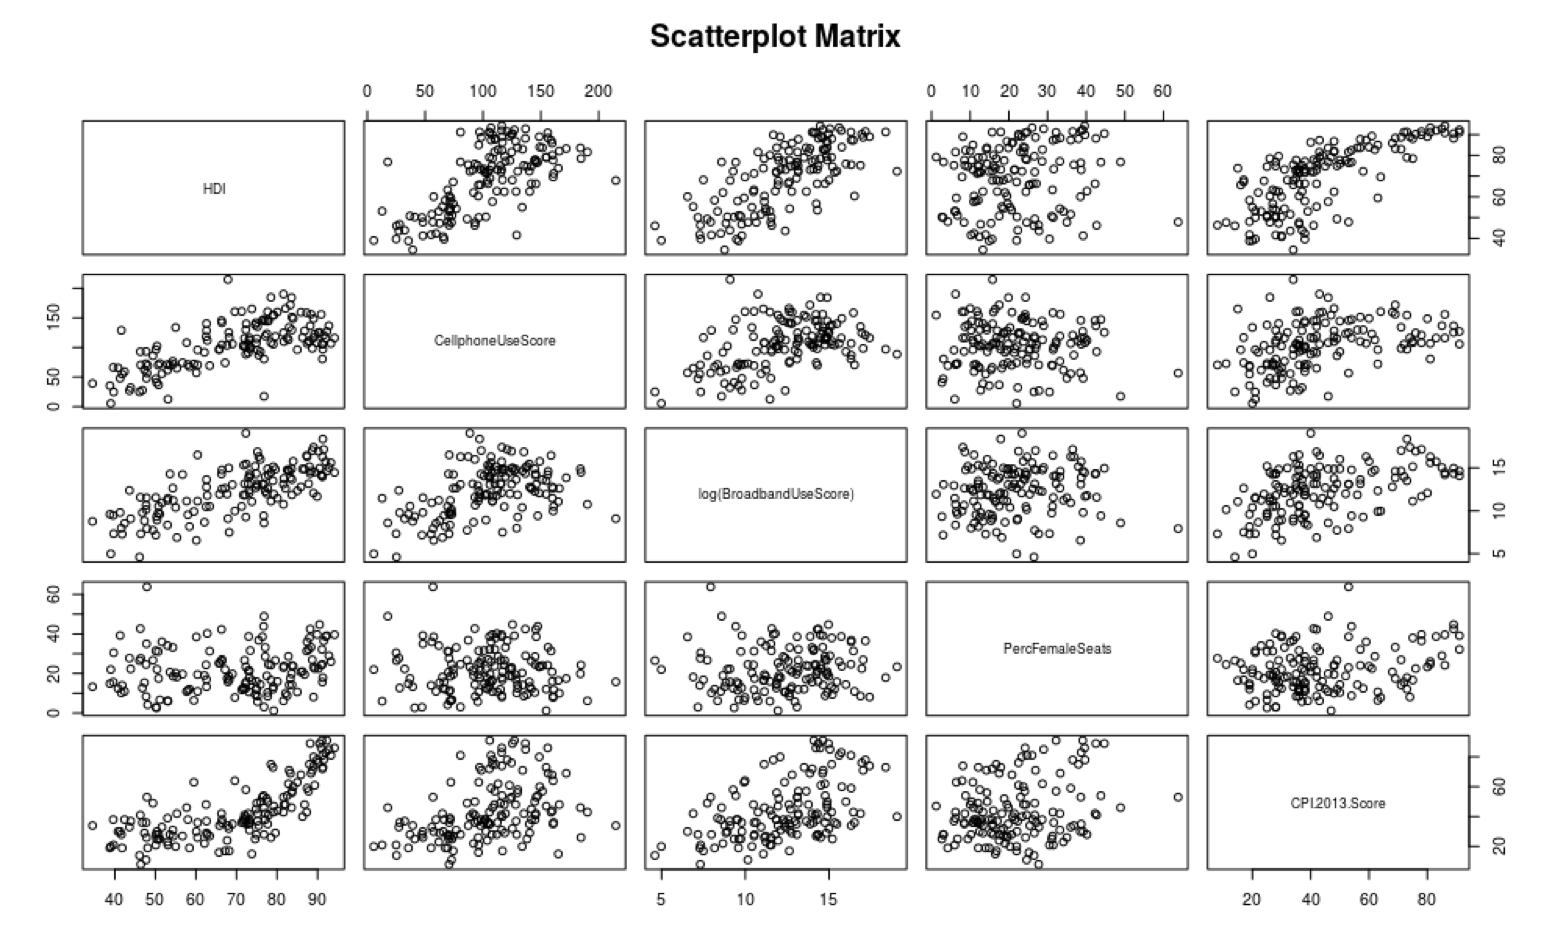
We explored the bivariate relationships and noticed that the relationship between percentage of female seats and our response variable HDI, is not linear. We created a linear model with HDI as the response variable and percentage of female seats as the explanatory variable. Percent of female seats was not statistically significant alone, as it had a high p-value of 0.09. The rest of our explanatory variables, CPI, broadband use, and cell phone use, all had extremely low p-values below 0.05 when they were used to create separate linear models with HDI. This means that each of these explanatory variables were statistically significant factors affecting HDI by themselves.
Conclusion:
It is important to note that the 144 countries we chose for our analysis were not randomly selected from all countries of the world but were countries that had data readily available for the variables we were considering. This means that we may have excluded countries that did not have the means available to collect this data.
The high statistical relevance of CPI surprised us because it measures the perception of corruption instead of corruption (not possible to measure) in a country and we did not expect that to have such a strong relationship with HDI which is originally calculated by a very quantifiable formula. The relevance of broadband and cell phone subscriptions makes sense because technological advances are typically important (whether directly or indirectly) for growth in levels of education, health and income.
Upon plotting the residuals, we discovered that the model did really well (low residual values) on countries with high HDIs such as the UK, Finland and did less well (high residual values) on countries with low HDIs such Eritrea, Burundi. We speculate that there could be many different reasons for this. One reason could be that there may be other variables at play that we have not considered for our model and those variables could be collinear with our explanatory variables for countries with high HDIs but may have a strong non-collinear relationship with countries with lower HDIs.
While we used HDI as our response variable, it is important to point out that this model should not be used to predict HDI. Rather, our purpose was to evaluate the relationship it has with our explanatory variables. The limitations are that we are using raw counts for cell phone and broadband subscriptions that have not been normalised for population sizes in a country and that we are only considering data from one year whereas a time-series analysis seems more appropriate in order to identify trends. Perhaps, most importantly, our explanatory variables are indicators of infrastructure changes that impact countries differently based on time but also on other factors such as their current stage of development. To this end, we are uncertain if there can be a unified formula to predict “human development” that standardizes the different socio-economic contexts between countries.
Lastly, HDI has been widely criticized for not accounting for income inequality. Our model shows that the participation of women in national politics does not seem to significantly impact HDI either. In conclusion, we are unsure if HDI is the best indicator of “human development” if it does not account for gender and income inequalities.

Log in or sign up for Devpost to join the conversation.