-
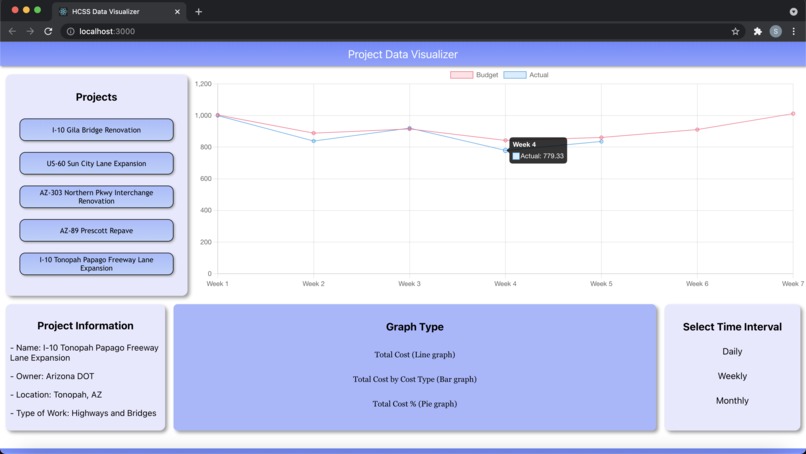
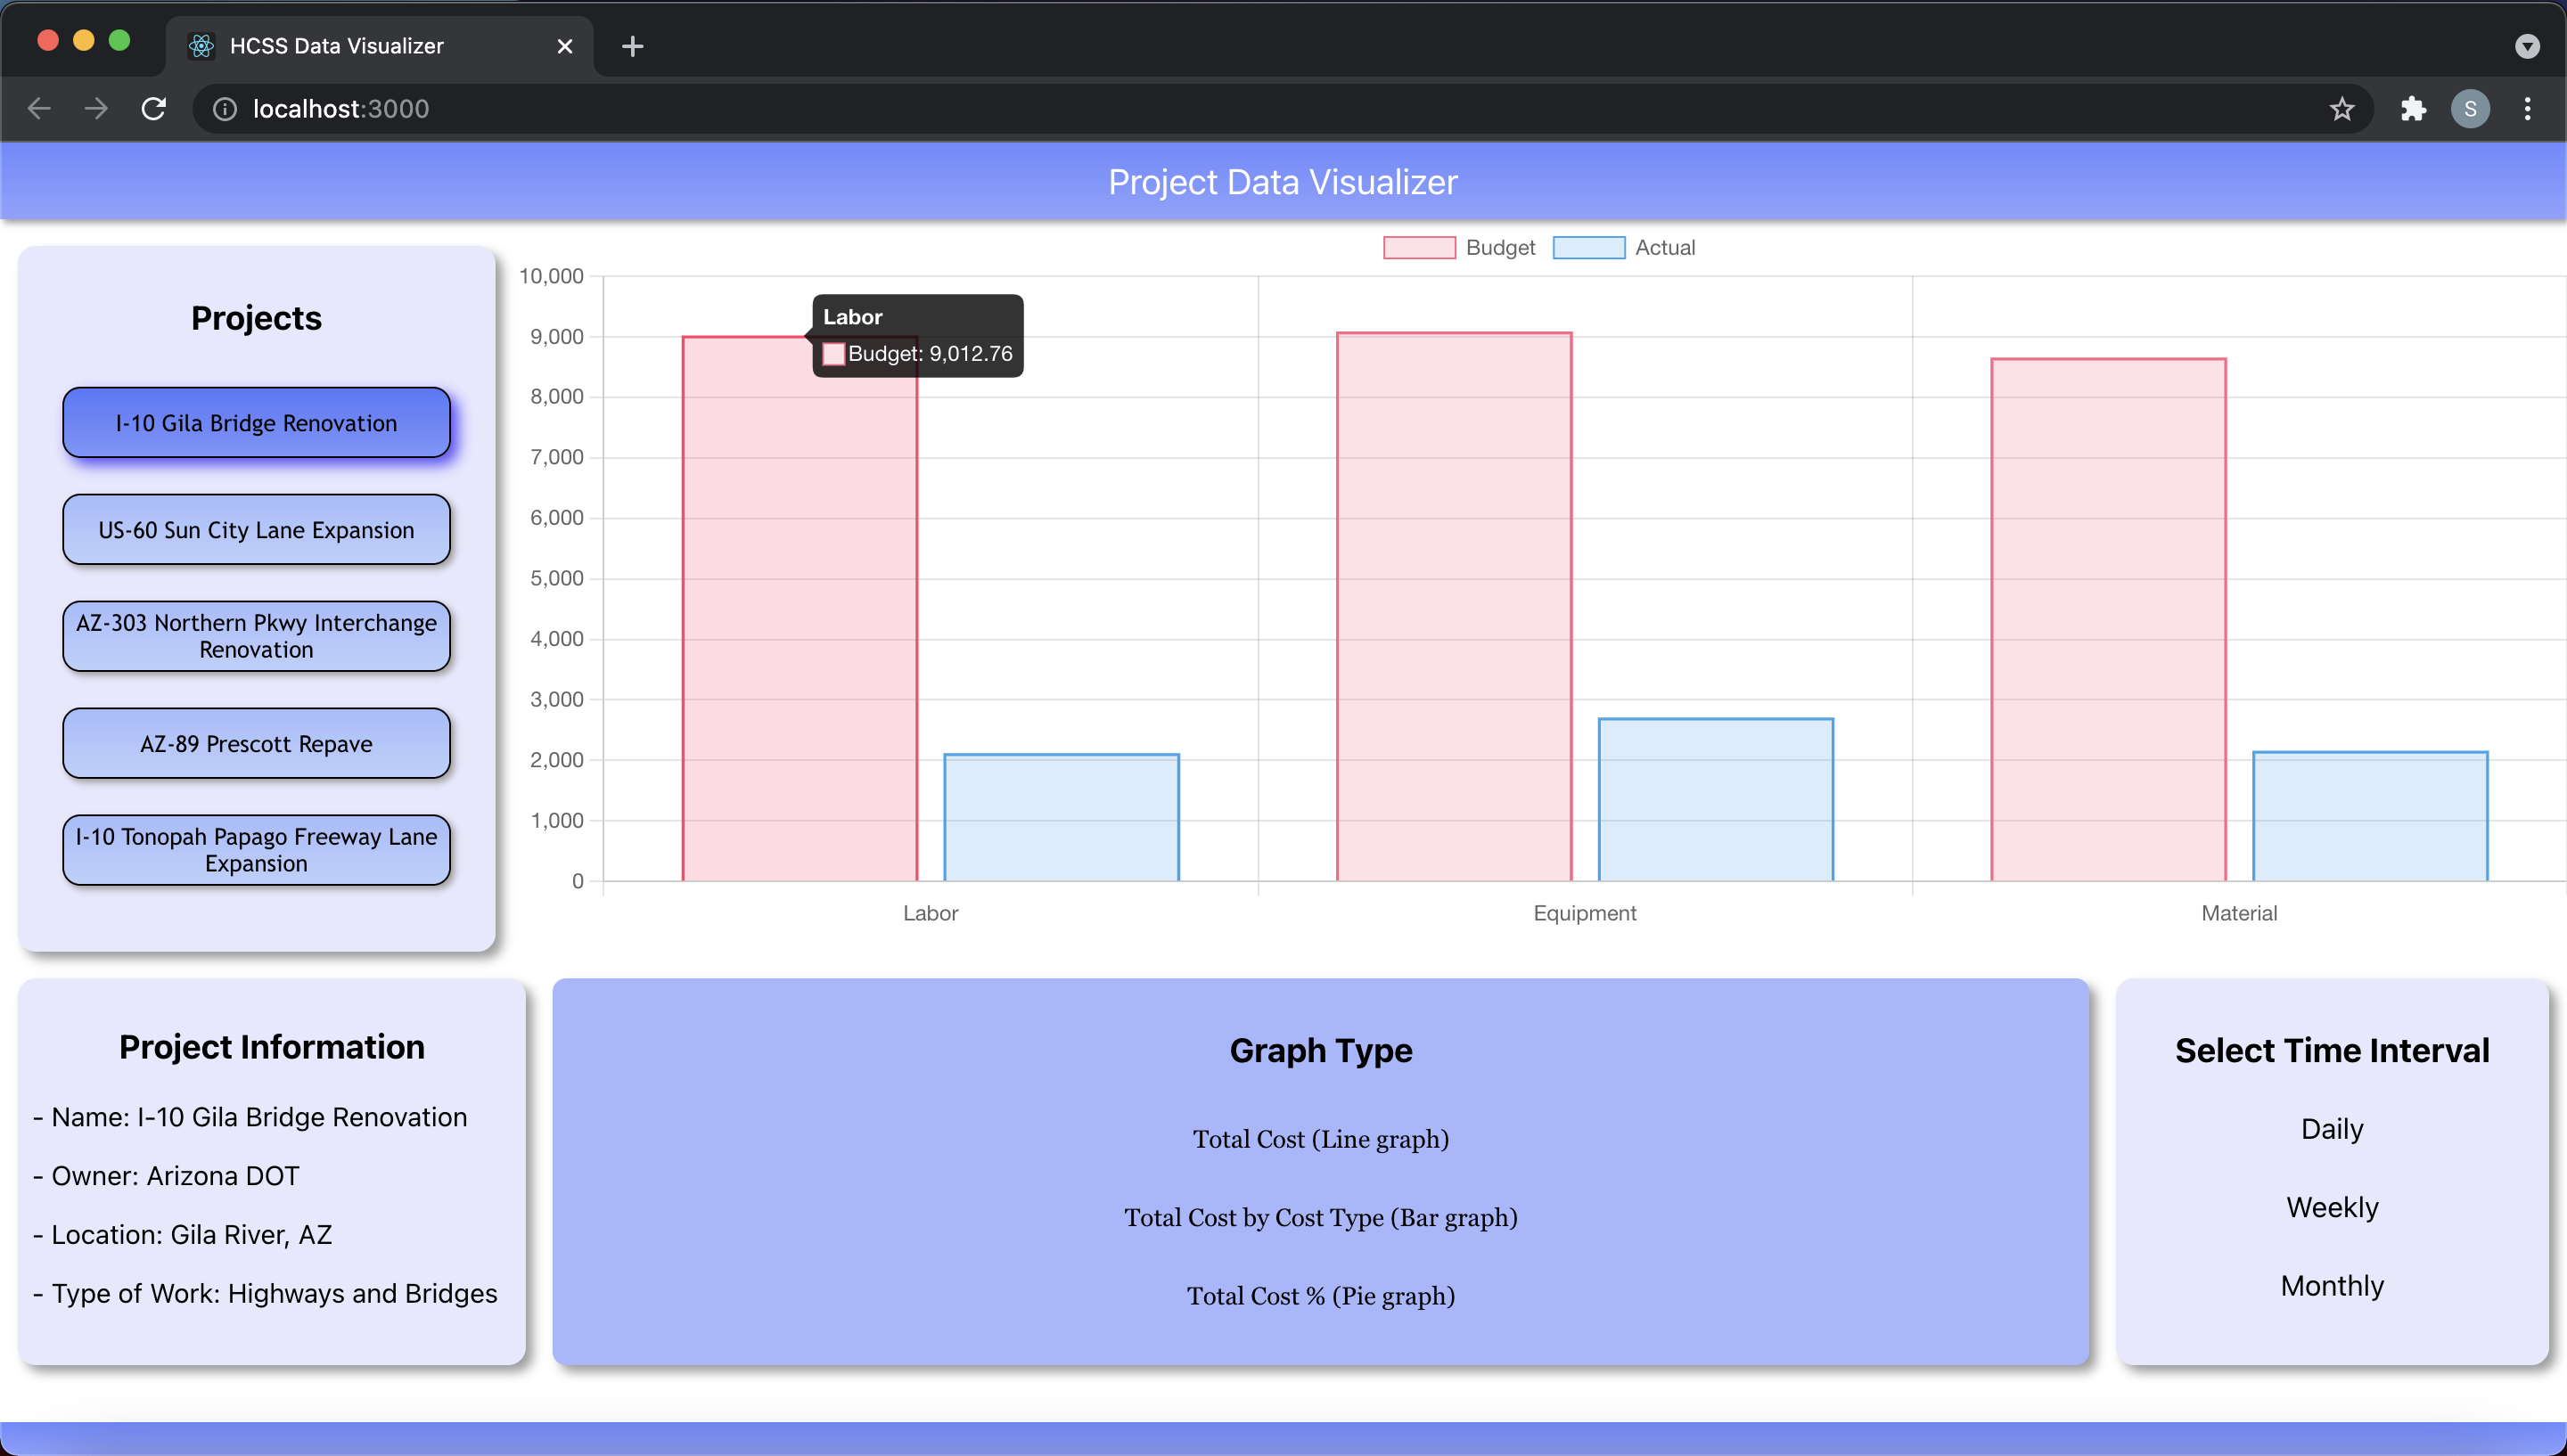
Visualization of the default setting of the dashboard
-
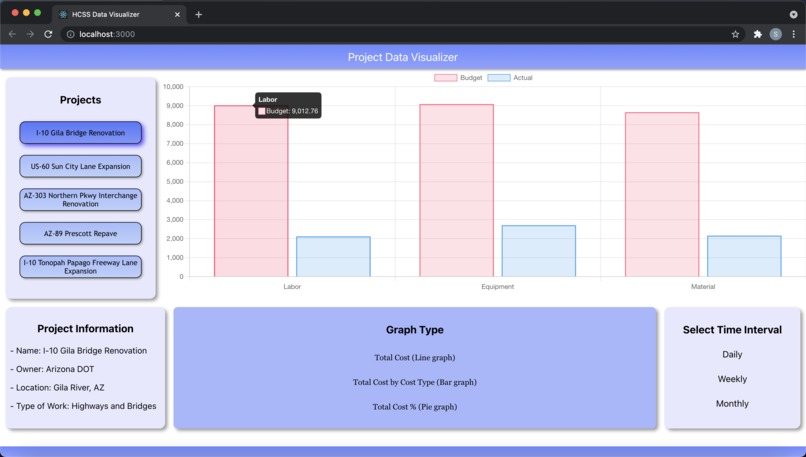
Visualization of the first project in the data set
-
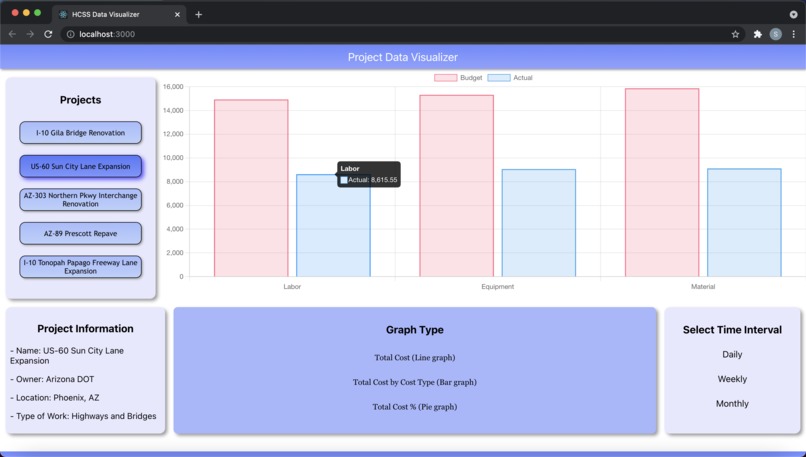
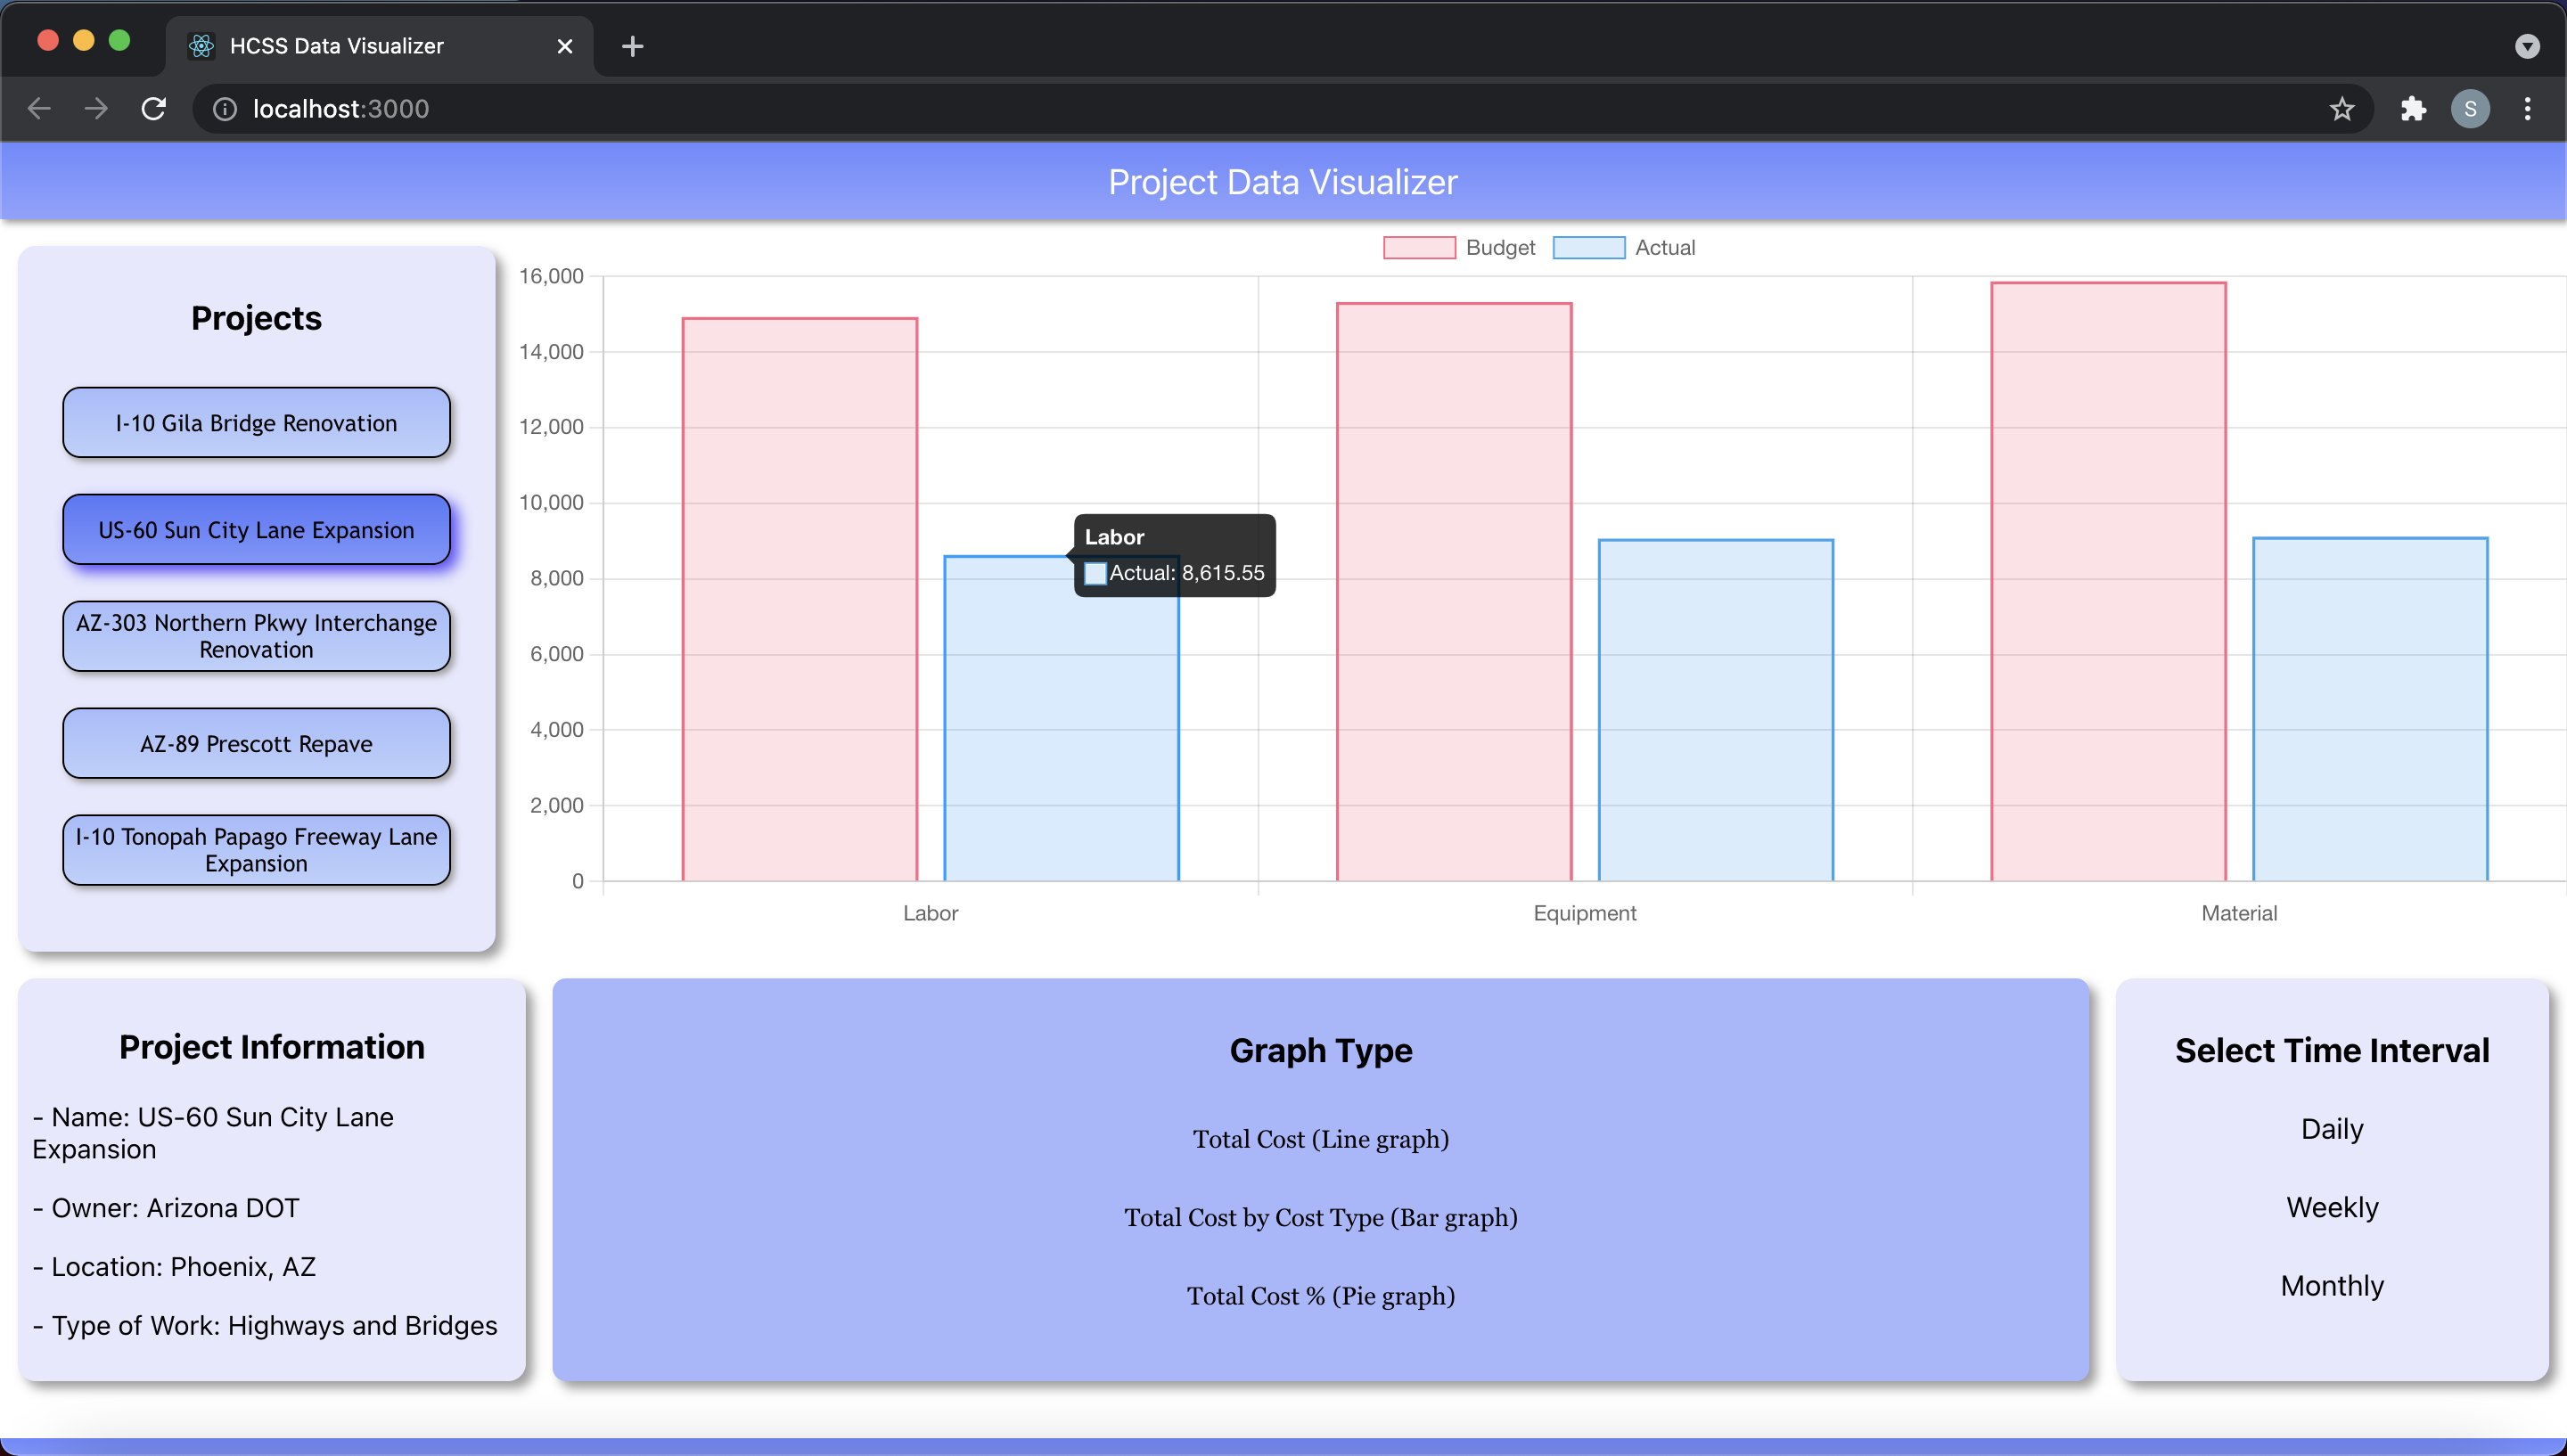
Visualization of the second project in the data set
-
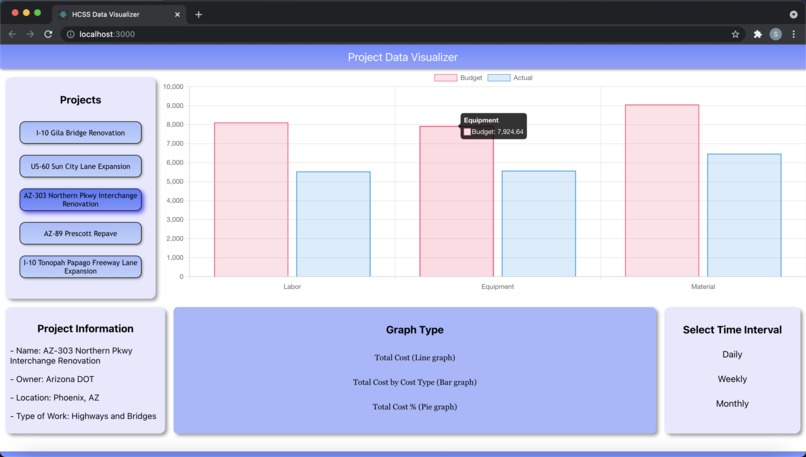
Visualization of the third project in the data set
-
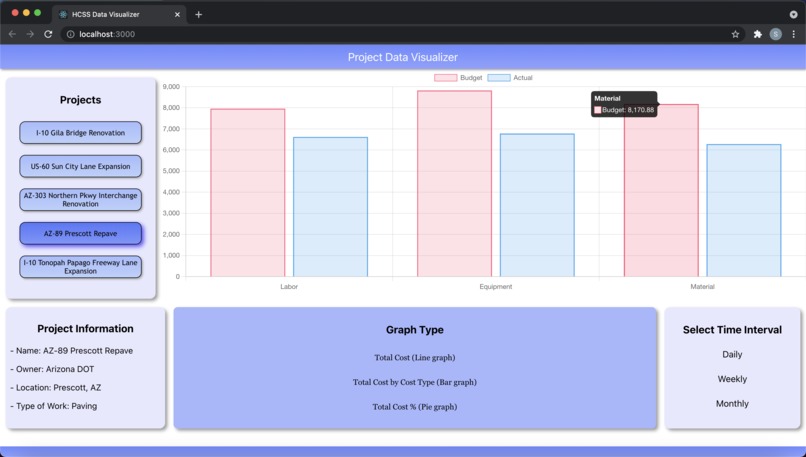
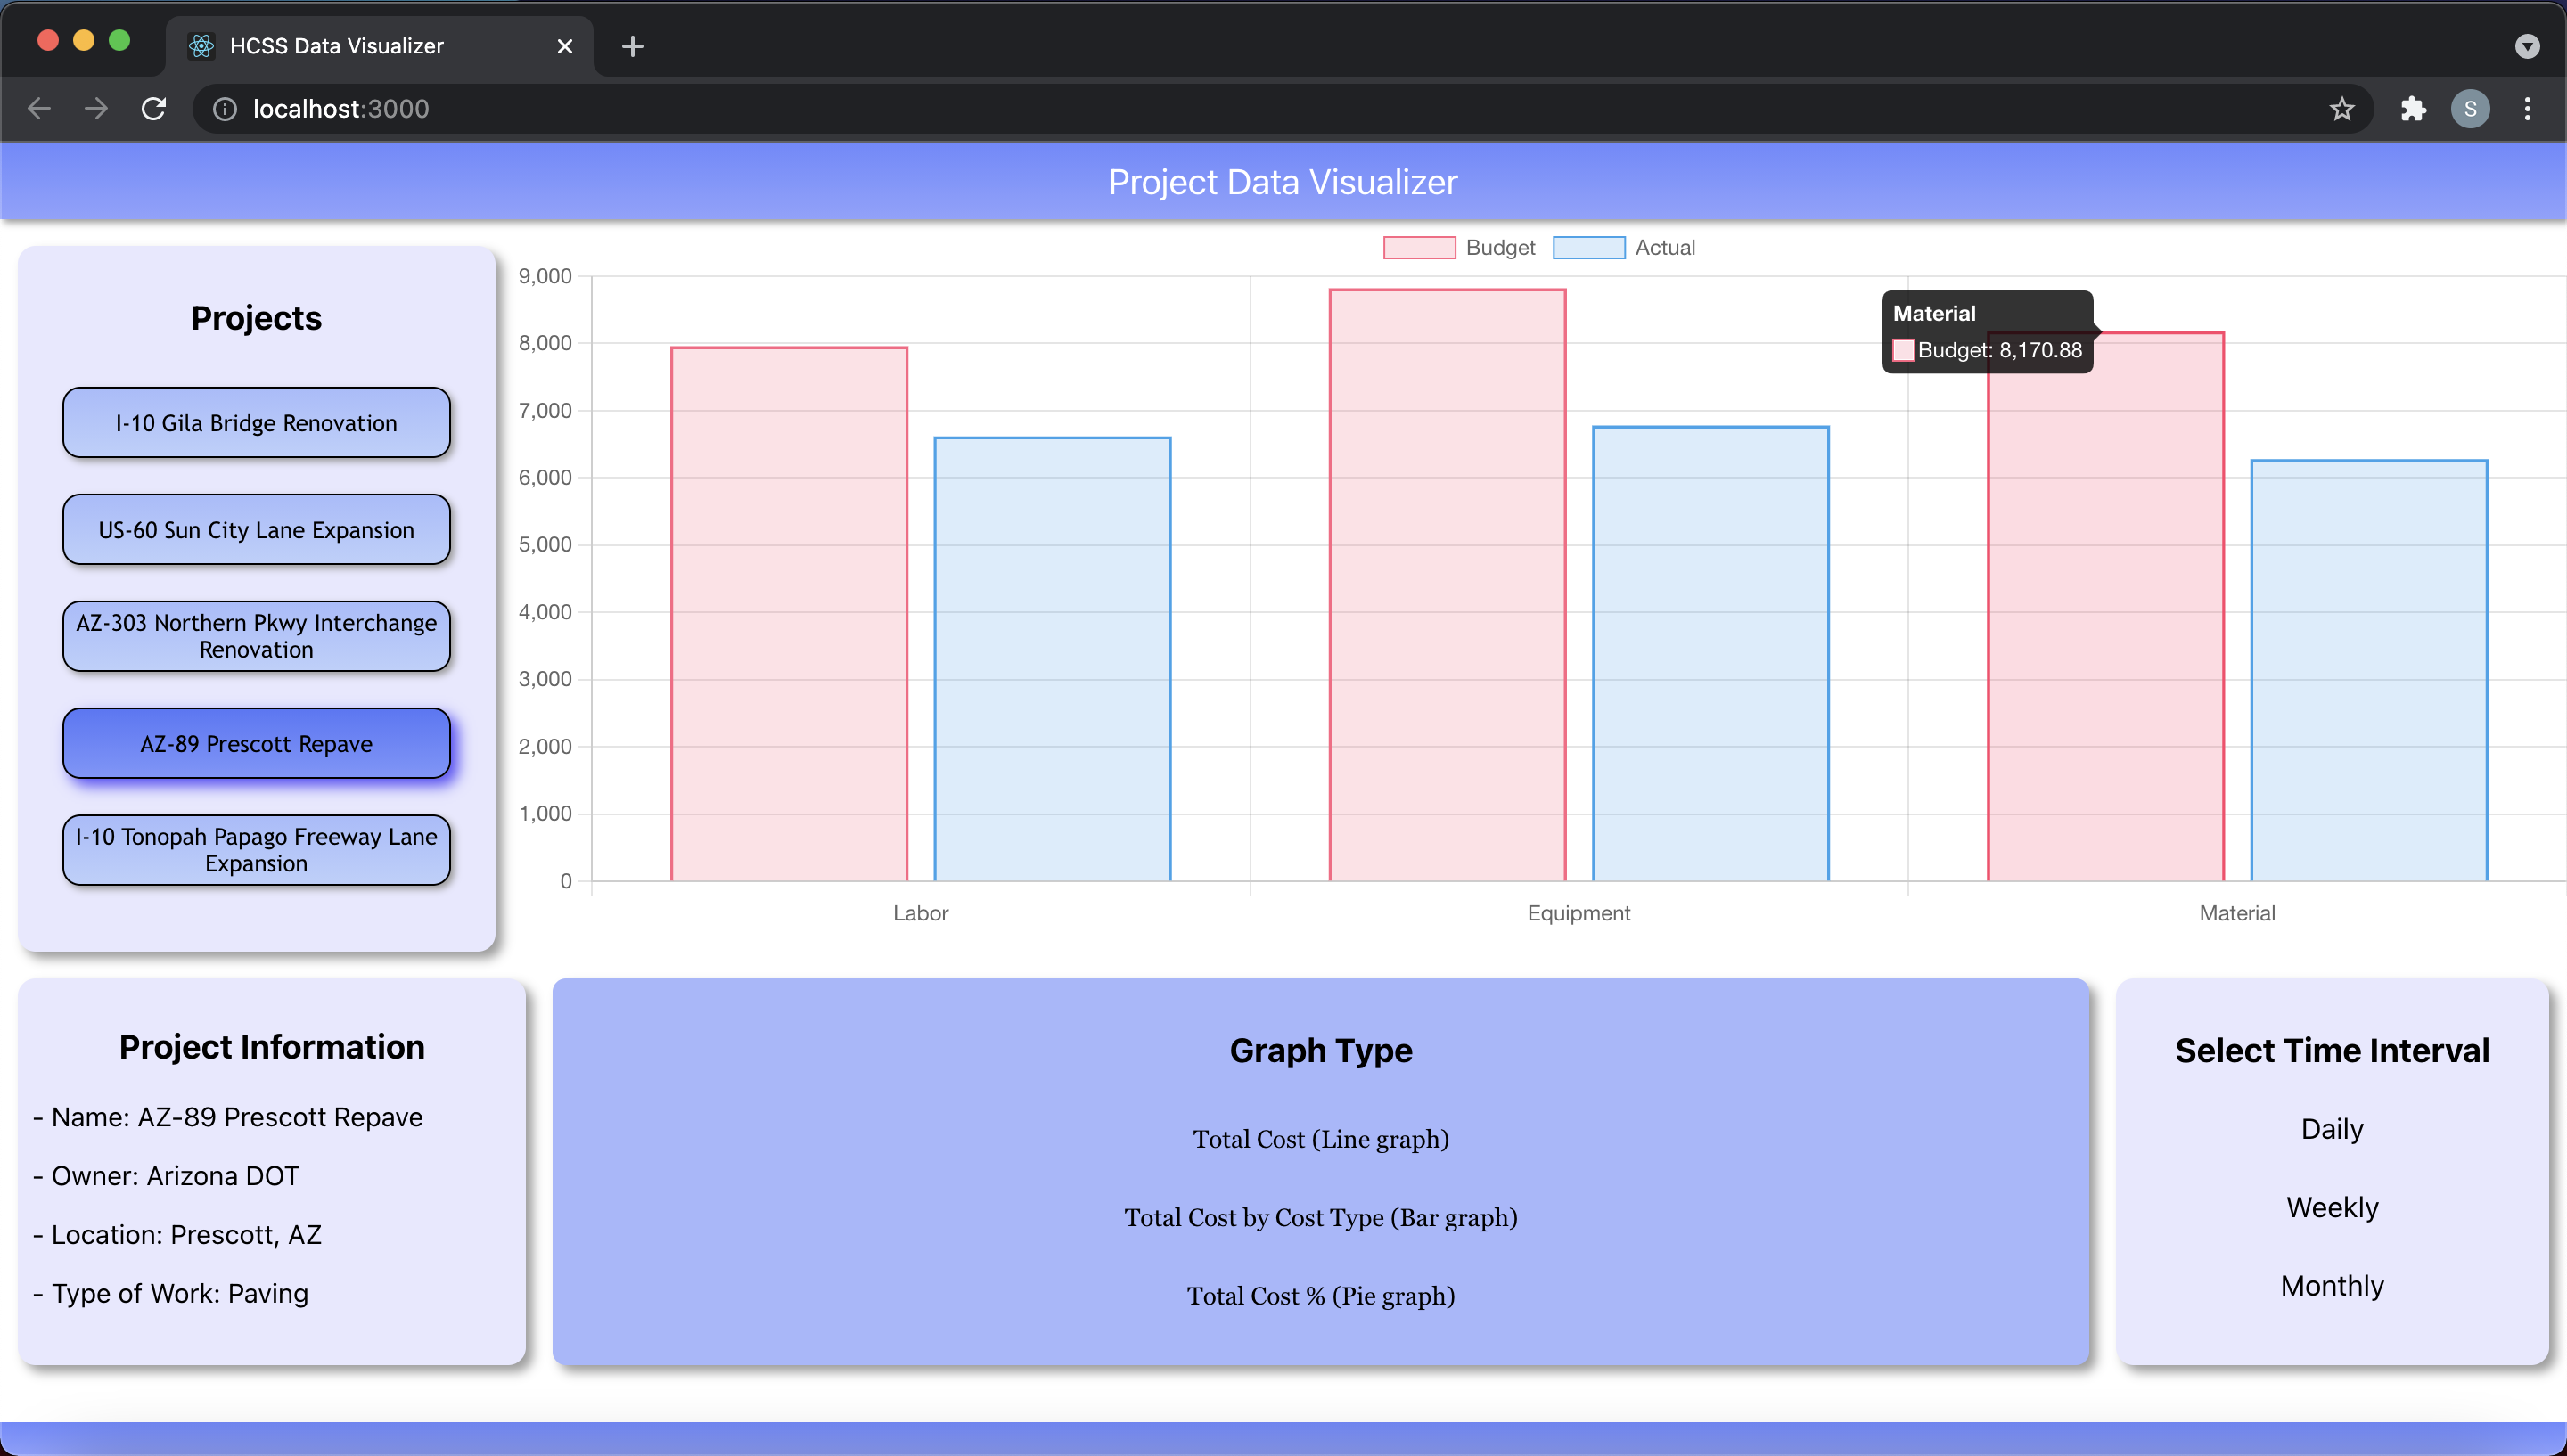
Visualization of the fourth project in the data set
-
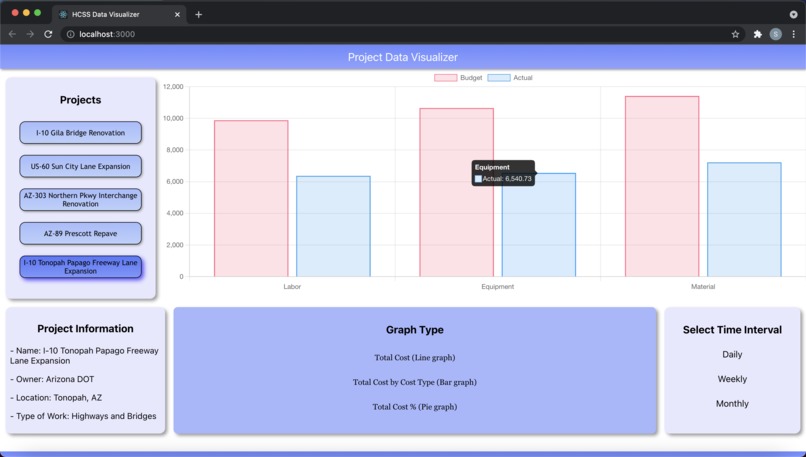
Visualization of the fifth project in the data set

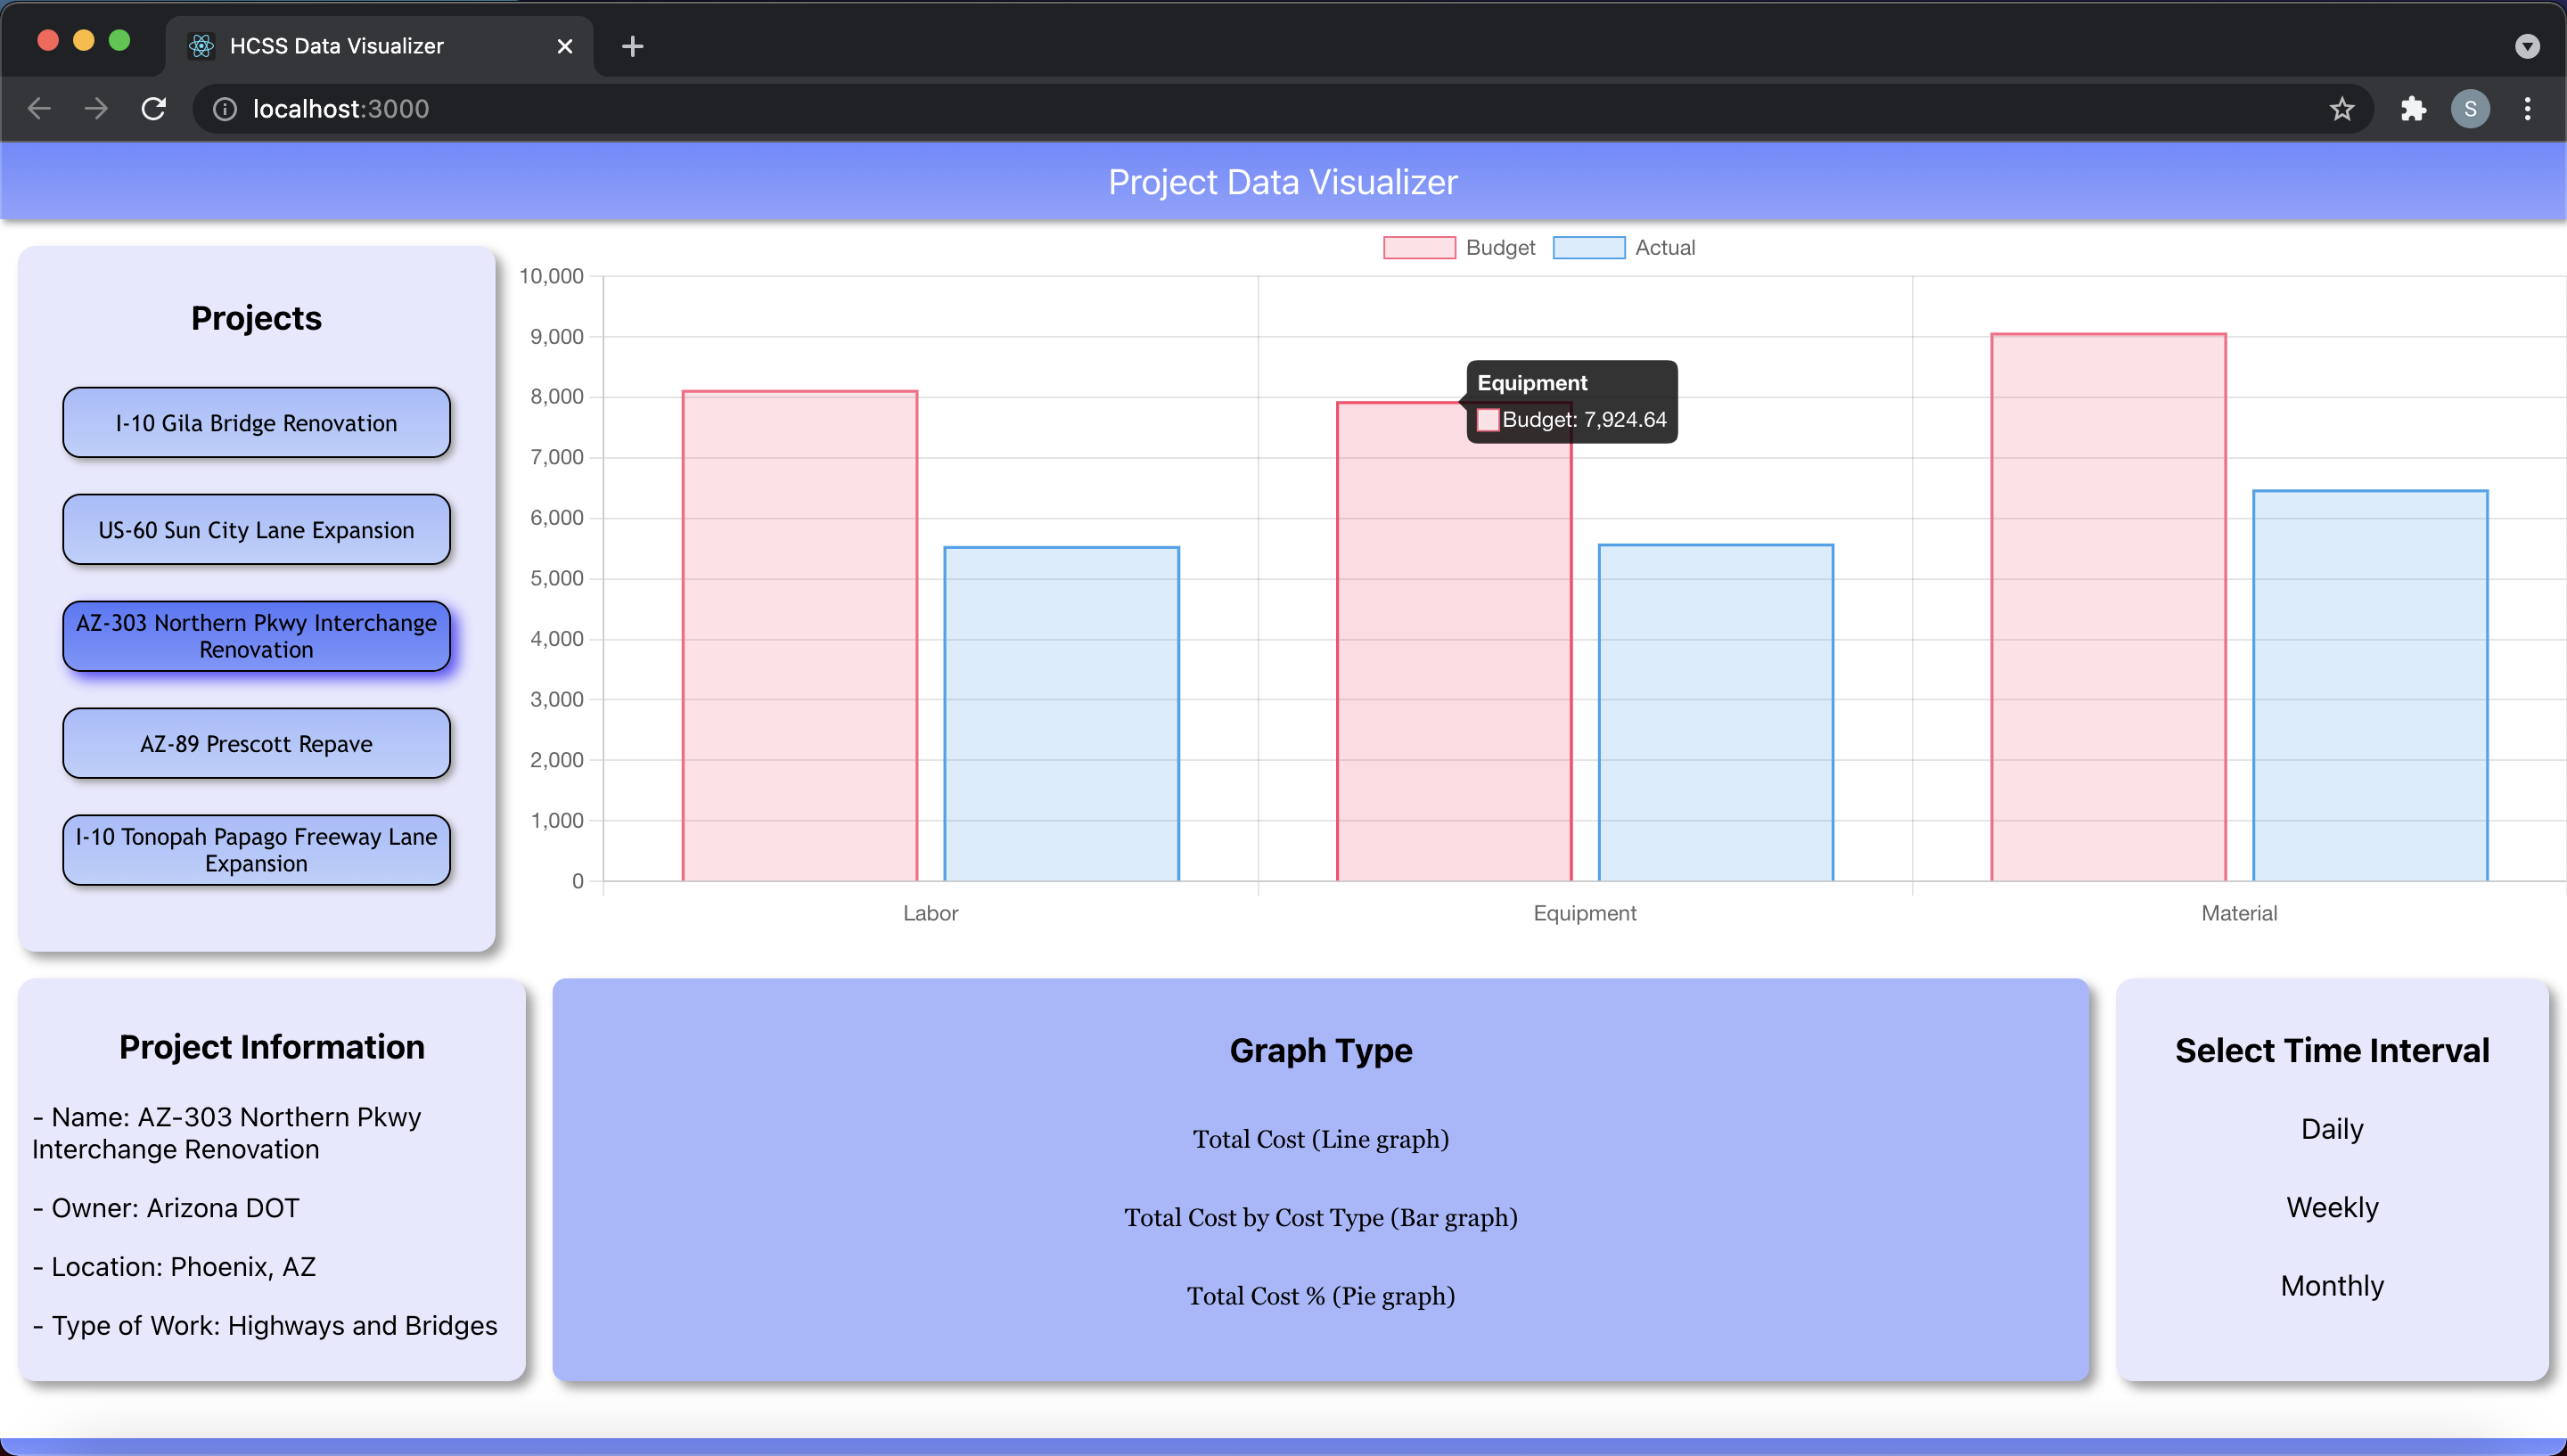

What it does
The dashboard visualizes data given by HCSS by plotting graphs and giving descriptions of each project in the given data.
How we built it
We used HTML, CSS, JavaScript, and React for the dashboard.
Challenges we ran into
It was my team's first time using javascript and react so we spent a lot of learning those new technologies. The issue that kept us from being able to finish the project was the implementation of buttons and changing information that is shown on the dashboard depending on what button is clicked.
Accomplishments that we're proud of
The fact that this was our first Hackathon and most of the technologies we used were new to us made us feel proud of the project we were able to create, even if we didn't finish it.
What we learned
We were able to learn the basics of React while also getting a better understanding of making projects with a team.

Log in or sign up for Devpost to join the conversation.