-
-

The homepage gives a concise introduction. Access is restricted to healthcare professionals and health department officials
-

Join the Coalition - Inviting all accredited labs across the country to send their feeds and enabling their testing data.
-

Heat Map by Volume - State Drill
-

Detailed State Breakdown via Drill
-

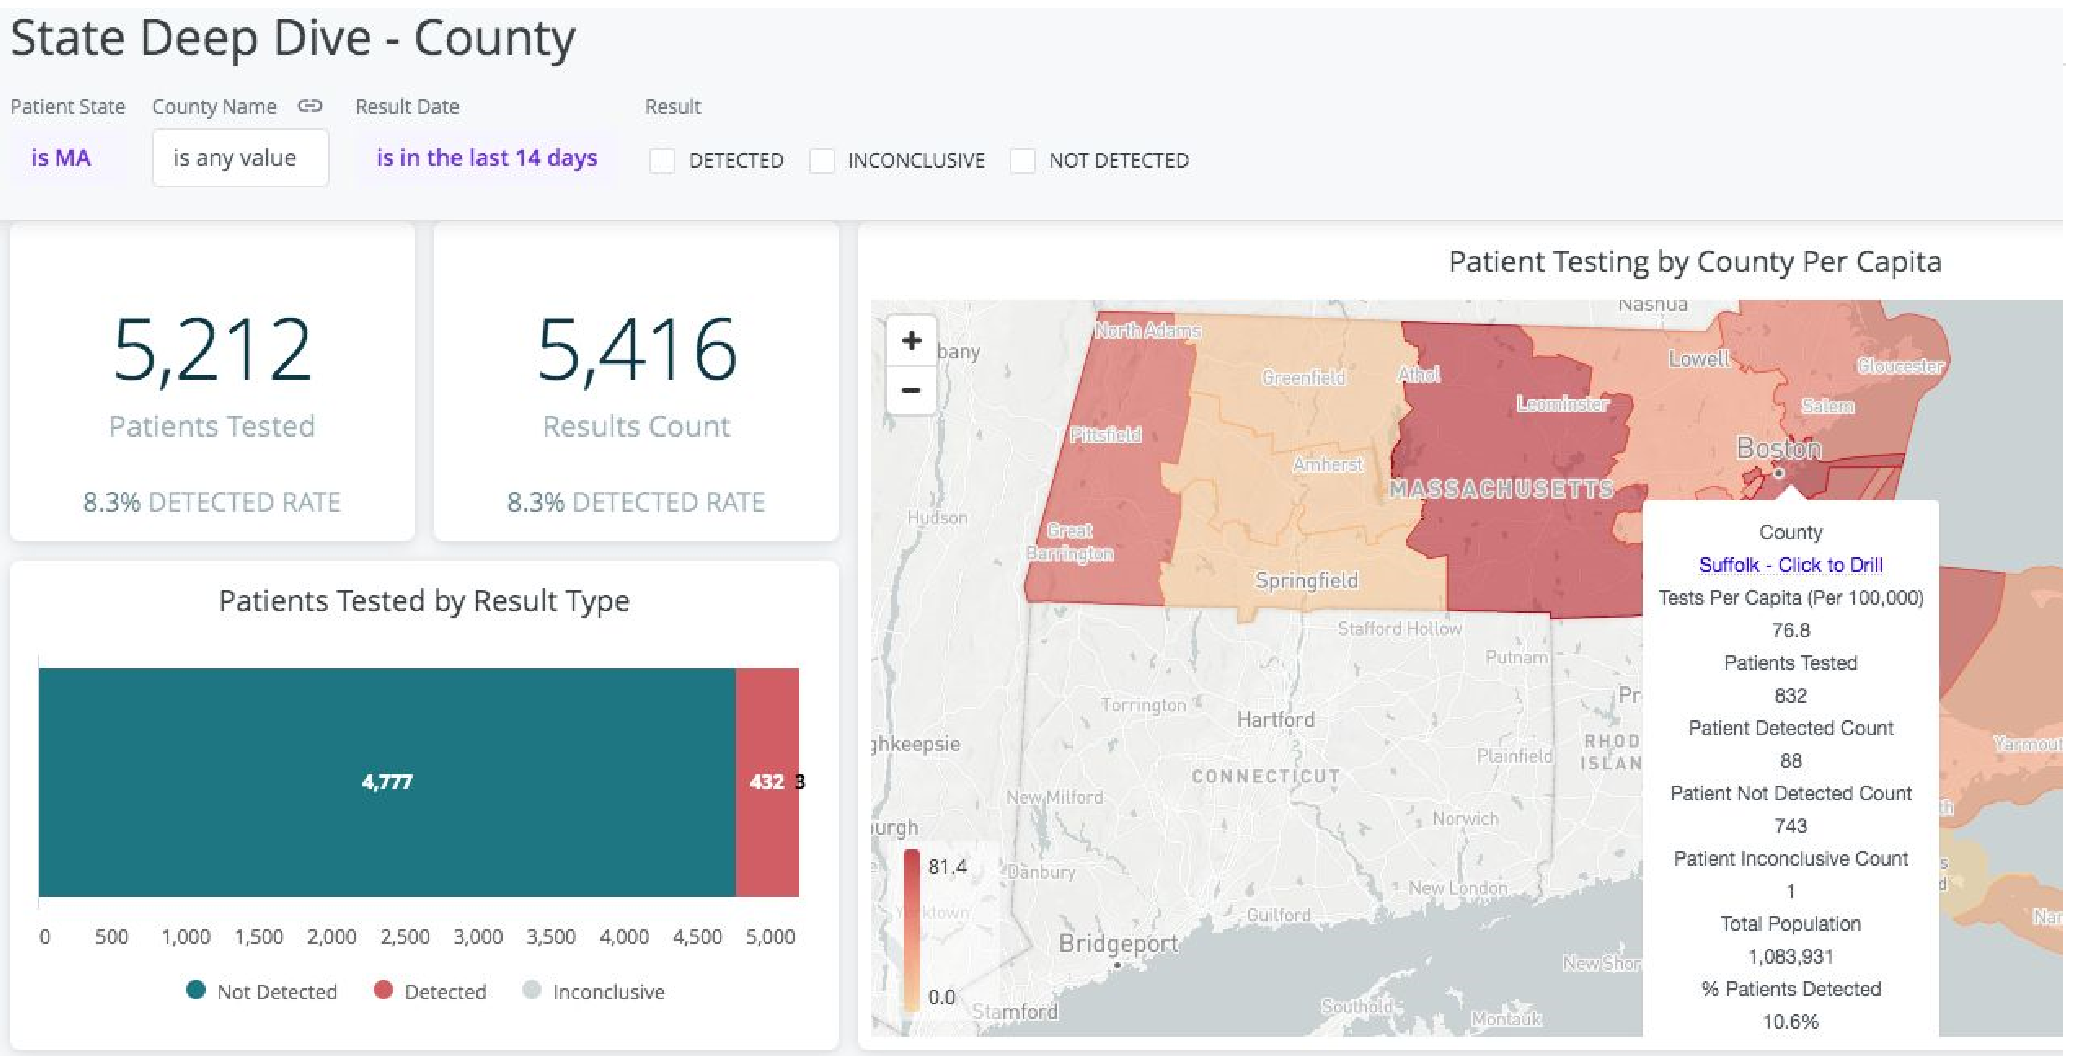
Statewide County Breakdown
-

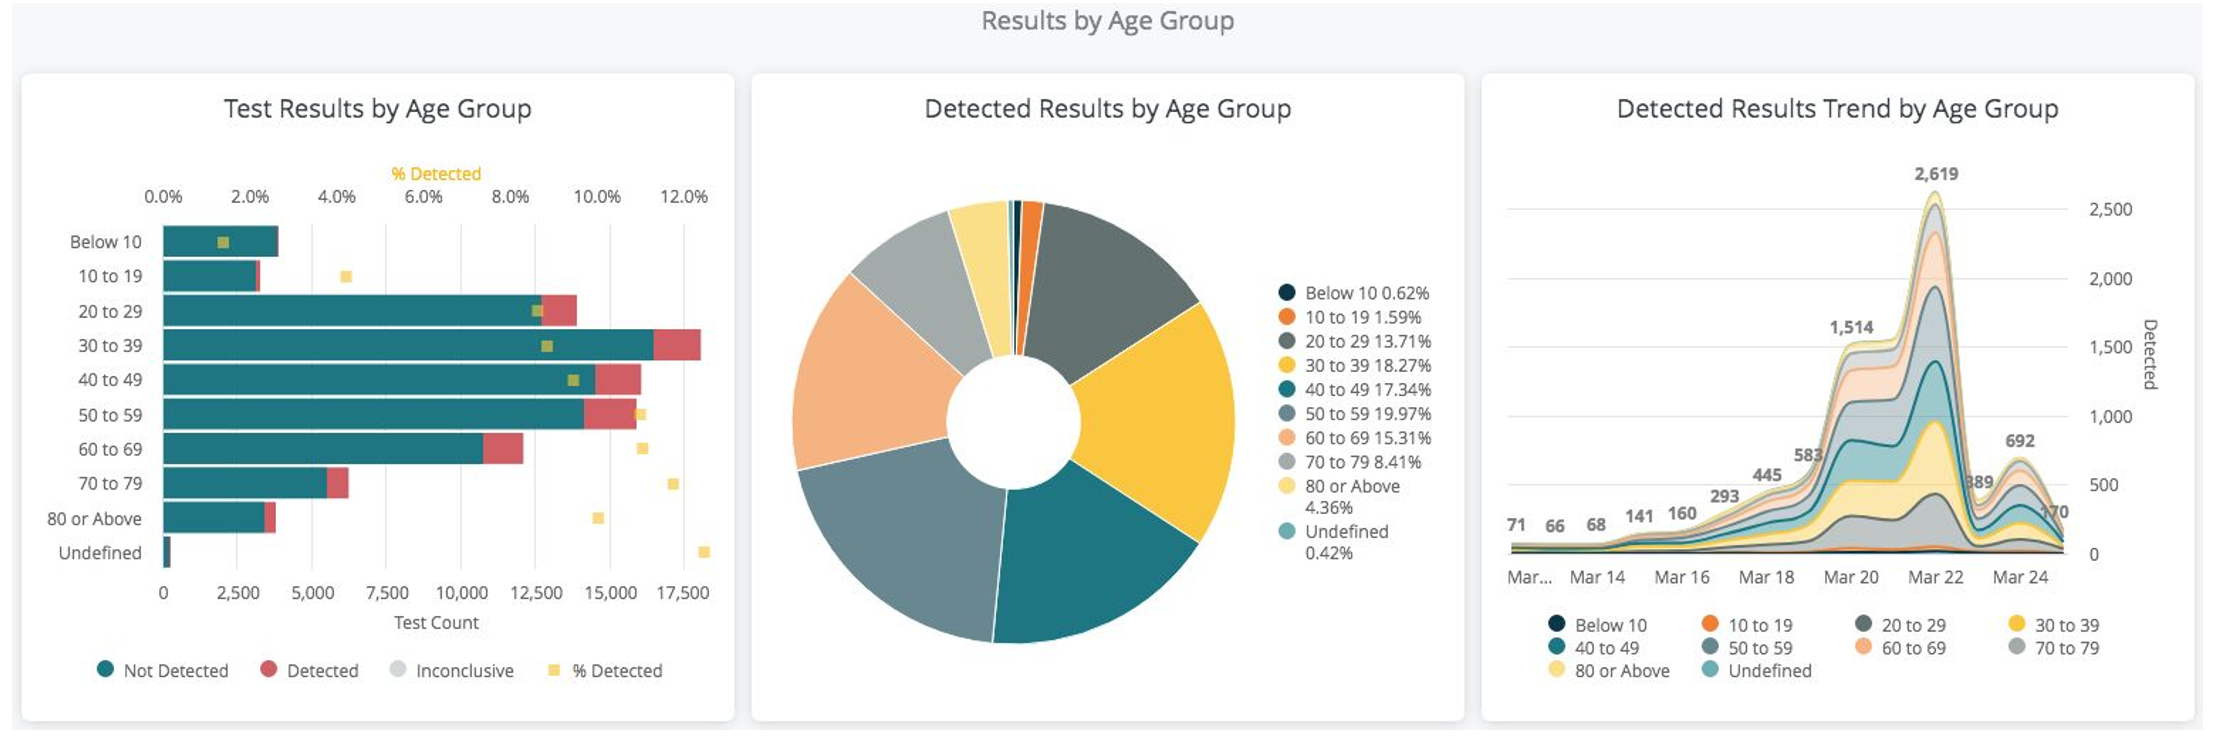
Result Reporting by Demographics - Age Group
-

Result Reporting by Demographics - Gender
-

Test Trending Over Time


Inspiration
With the urgent need to combat the spread of COVID-19, public health agencies and healthcare professionals are desperate for information on current lab testing and results. While many dashboards are reporting on outcomes (positive tests, deaths, recoveries) in arrears, a massive need remains for live lab insight to be made available on an immediate basis. This will provide the advanced ability to analyze the information by location, demographics, and more. For this reason, hc1 has invested in creating a national dashboard displaying live lab test ordering and result information. hc1 is uniquely positioned to deliver this capability today as we are the global leaders in lab bioinformatics. With thousands of lab locations and more than 19B lab results organized in our platform, hc1 generates personalized healthcare insights today, including rich analytics on COVID-19 testing.
What does it do
"The hc1 - COVID-19 Lab Testing Dashboard™ and mapping tools will accelerate insight by 10-21 days for Healthcare Organizations, Public Health, and Government leaders to help predict where the next wave of ER, hospital and ICU overload will occur. Monitoring the rise in '% positivity' of the COVID-19 tests and the 'acceleration of % positive' in local data will tell us where scarce resources must be deployed a couple of weeks before the wave hits our hospitals RATHER than waiting until the severe cases present at the ER door.” - Peter J. Plantes, MD, hc1 – Physician Executive
How is it built
The hc1 - COVID-19 Lab Testing Dashboard™ is informed by data that is provided by members of the hc1 Lab Member Coalition. Data can be ingested through an HL7 feed using hc1's existing ESB - hc1 Connect and the hc1 Platform or through a .CSV file ingested into AWS S3 storage in hc1’s secure, HIPAA compliant cloud. All data is ETL'd into Amazon Snowflake. For display, Springboot App (Java) provides authentication to end users and SSO to Looker visualizations. Looker is used for presenting dashboards to end users. Users registration and authentication is done using hc'1s existing authentication service. All applications are containerized and hosted using AWS ECS. Static content is presented using AWS Cloudfront. Looker is hosted as Looker SaaS provided service. All data is de-identified in the dashboard.
Challenges
Not all COVID-19 testing is captured in the hc1 - COVID-19 Lab Testing Dashboard™ since data presented only consists of current hc1 Lab Coalition Members. hc1 registers 25-30% of the available COVID-19 Lab testing volume nationally into the denominators; as more labs deposit their COVID-19 Testing Data into the data-repository the reports & maps will become ever more specific and informative. During the early period of US spread of the virus, testing is clinically restricted and aimed at highly suspect sick cases; therefore, even when initial data is limited, an area with higher %'ile per population tested and %'ile positive "detected" is especially prone to be a "hot spot" needing immediate treatment resources (ventilators) and PPE supplementation. Test sample zip codes are registered either to the patient's home or to the local lab draw station where they access care. Therefore "hot spot" mapping reflects residential areas of high % + test results or the geographies (county or PUMA) of the clinical delivery site locations where large numbers of patients would be expected to return when symptoms cannot be managed at home.
What did you accomplish
hc1 COVID-19 Lab Testing Dashboard™ provides information that isn't found in other dashboards currently in existence. We aggregate commercial lab testing results from more than 7,680 (as of 24 Mar 2020) ordering locations within the U.S. that are performing roughly 25% - 30% of the total Covid-19 testing volume. We deliver a more complete picture of the lab testing trends inside defined geographical areas; ability to filter and/or drill-down from the national level into the state, county, and the Public Use Microdata Area (PUMA) levels (neighborhoods) used by the U.S. Census Bureau. We offer a near real-time understanding of the virus’ movement through communities by "trending" the results over time periods (day-to-day or week-to-week) of %'ile of the population tested AND the %'ile positive "detected" results of COVID-19 lab tests performed (detected, not detected, and inconclusive.) Our hc1 'direct web-based link' to the labs performing the COVID-19 tests creates a localized mapping, trending data-information, and dashboards that are actionable within hours of the results being reported; much faster than the days it takes to file public health reports extrapolated to show where sick patients had presented to an ER/ hospital/ clinic. We visualize "trending" lab testing data and results by demographic factors (age and sex) and within geographic areas (national, state, counties and PUMAs--the same used by the U.S. Census Bureau.)
What’s next
hc1 is committed to enriching its current data set by growing its coalition members. In addition, we'll also be participating in other coalition efforts.
Built With
- aws-cloudfront
- aws-ecs
- aws-snowflake
- hc1-connect
- hc1-platform
- hl7
- java
- looker
- looker-saas
- springboot


Log in or sign up for Devpost to join the conversation.