-
-
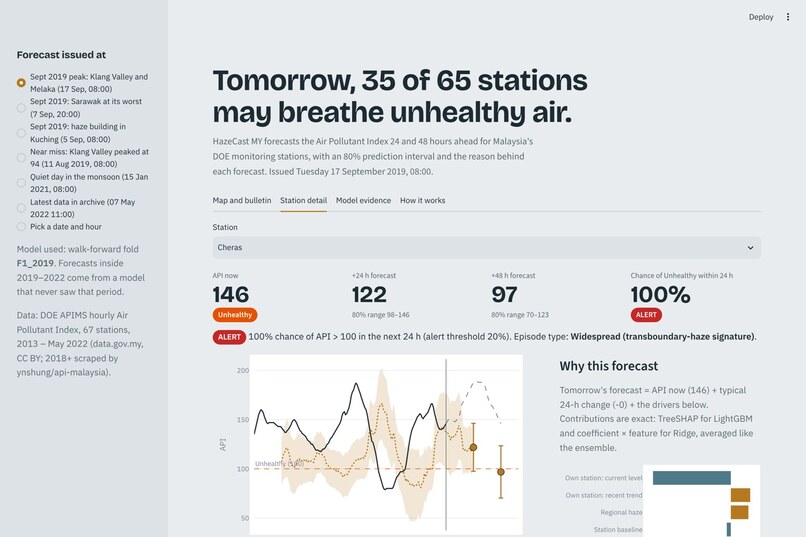
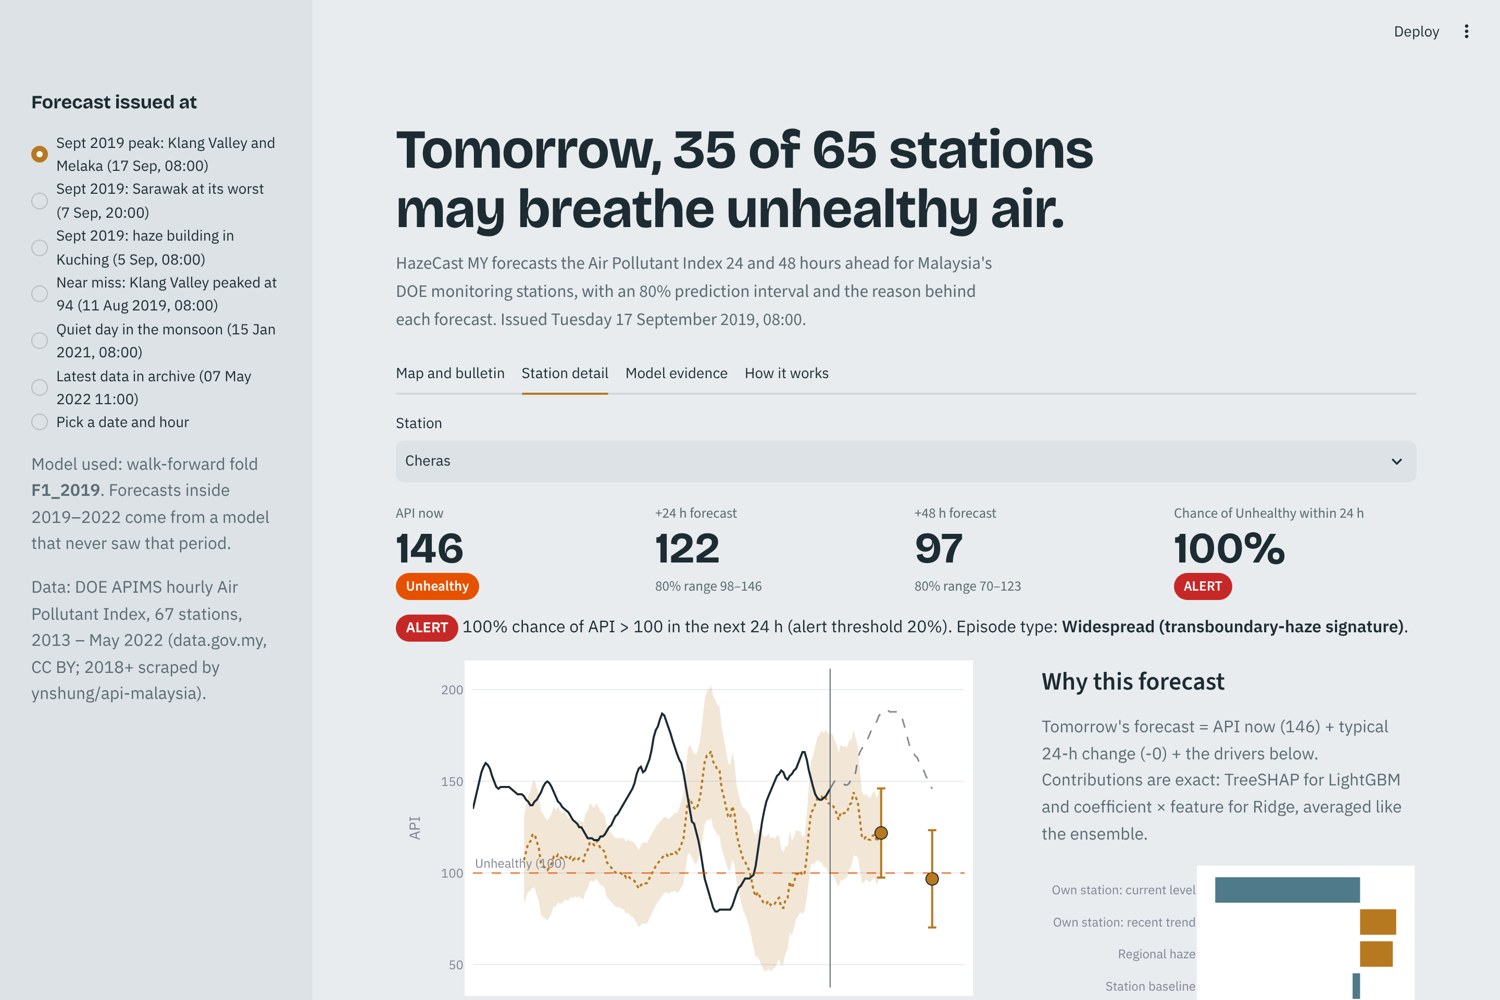
Station detail: 24/48 h forecast, 80% range, chance of Unhealthy air and the drivers behind it
-
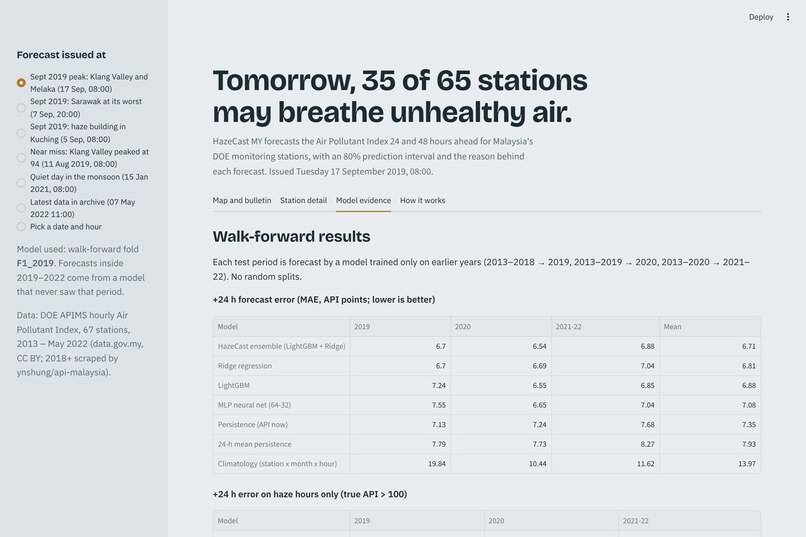
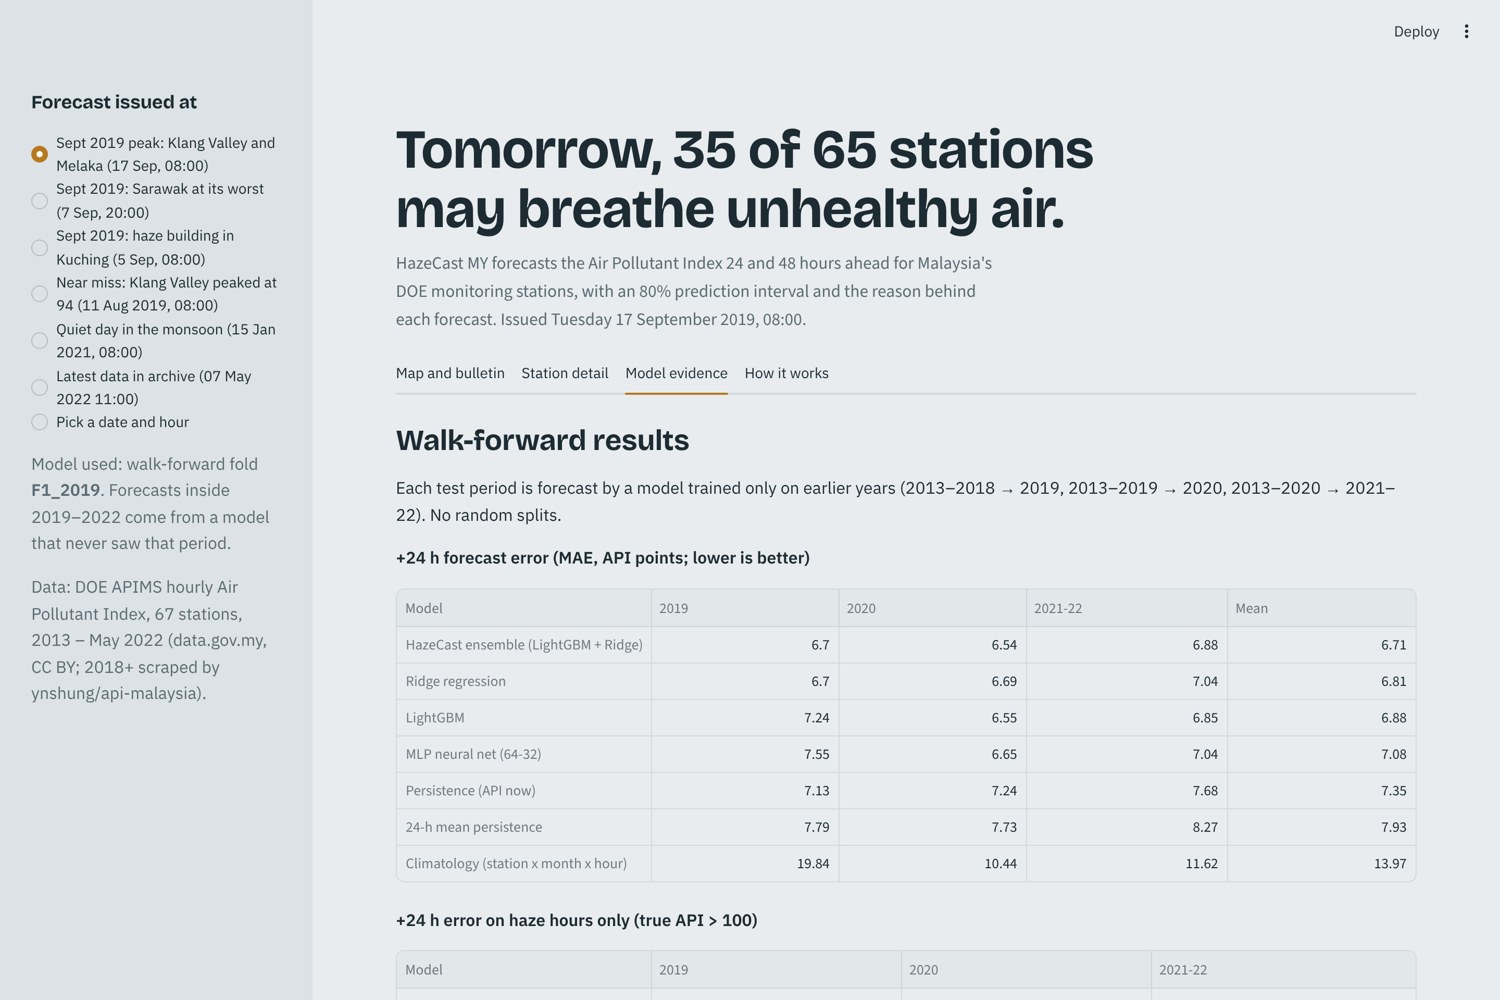
Model evidence: walk-forward results against six baselines
-
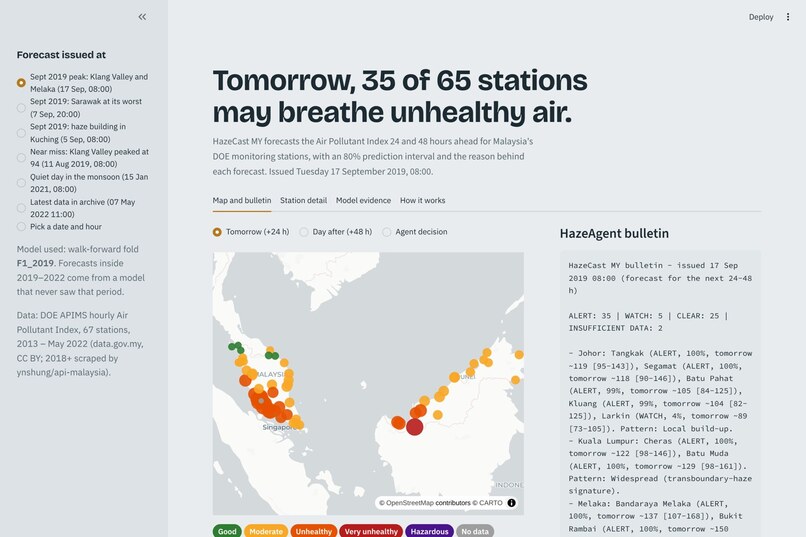
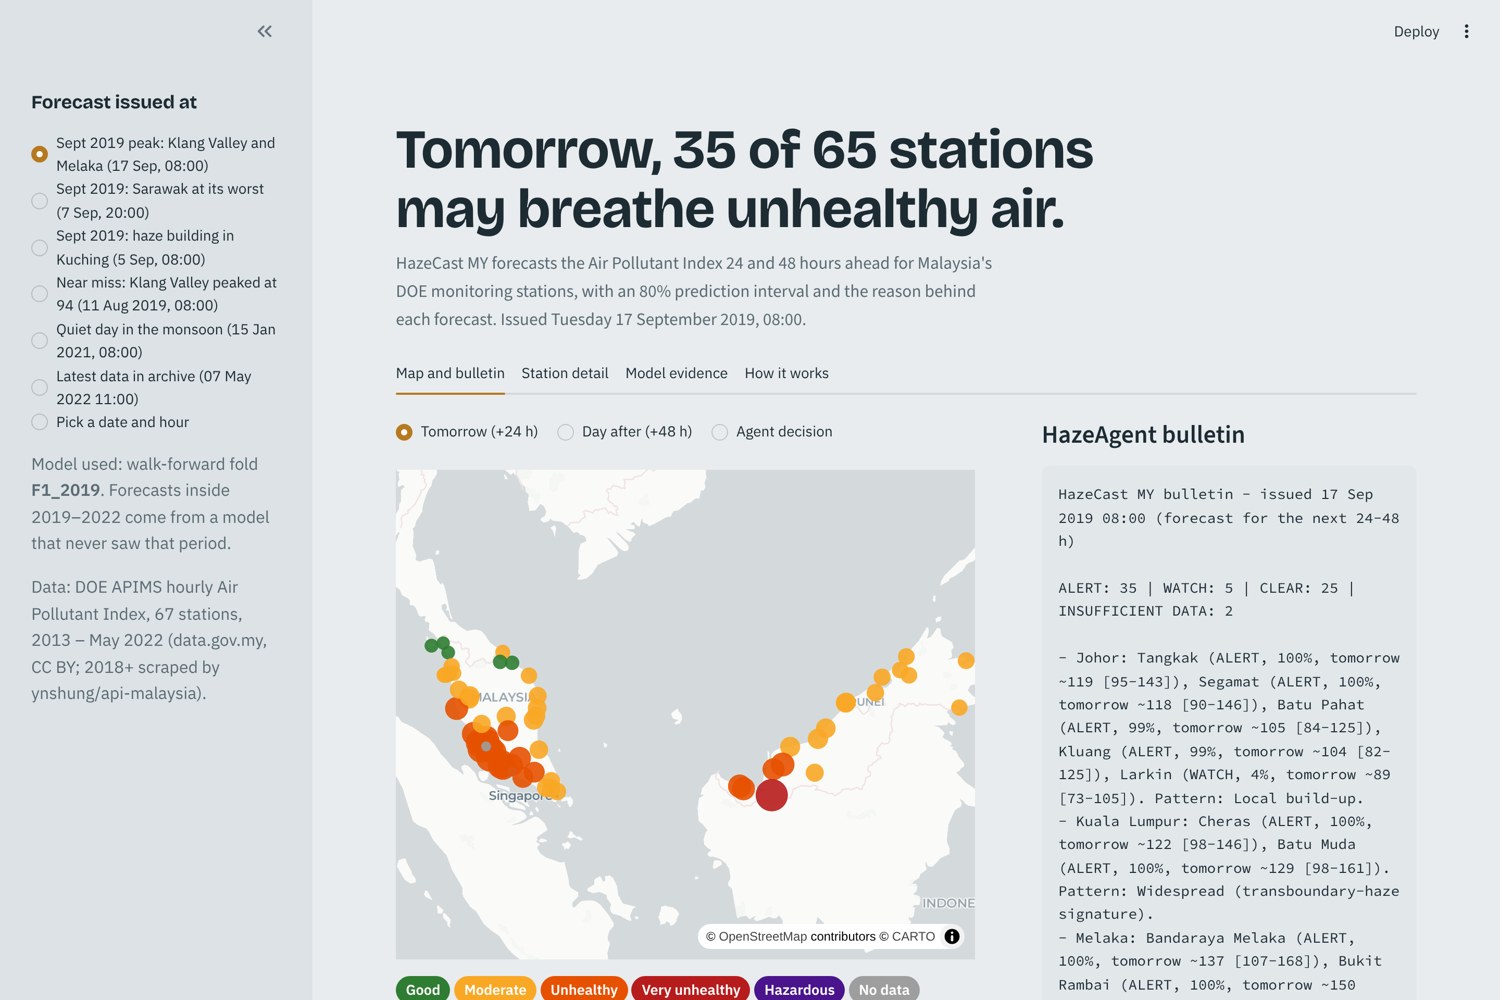
Replay of 17 Sep 2019: 35 stations flagged for unhealthy air tomorrow, with HazeAgent's state bulletin
Inspiration
Every haze season, Malaysians find out the air is unhealthy when APIMS has already turned red. The official index shows the last hour, not tomorrow. In September 2019, 48 stations were Unhealthy at the same time and schools across several states closed. In 2026 it happened again: 20 areas were unhealthy to hazardous on 3 September. Deciding to cancel outdoor activities or hand out masks needs a day of warning.
What it does
For each of 67 DOE stations, HazeCast MY:
- forecasts the Air Pollutant Index 24 h and 48 h ahead
- gives a calibrated probability of Unhealthy air (API > 100) within 24 h
- shows an 80% prediction range
- explains why, in plain-language drivers: the station's own level and trend, neighbouring stations, regional haze, nationwide haze, season
HazeAgent turns these into a decision per station: ALERT, WATCH, CLEAR or INSUFFICIENT DATA. It declines to forecast when recent data is missing. It labels each episode as a widespread (transboundary-haze) signature or local build-up, and writes a state-by-state bulletin.
The app replays any hour from 2014 to May 2022. Every 2019–2022 forecast comes from a model that never saw that period.
How we built it
- Data: 3.8 million station-hours of official hourly DOE APIMS data (2013 – May 2022, data.gov.my CC BY).
- Features: 36 leakage-free features per station-hour: own lags and trends, three nearest stations, regional and nationwide haze signals, season.
- Models: an ensemble of LightGBM and Ridge regression, trained to predict the change from the current reading (trees can't extrapolate record haze levels), plus a LightGBM alert classifier.
- Uncertainty: normalised split-conformal intervals that widen with recent volatility.
- Explanations: exact contributions, from TreeSHAP for LightGBM and coefficient × feature for Ridge.
- Validation: walk-forward only (2013–18 → 2019, 2013–19 → 2020, 2013–20 → 2021–22). Hyper-parameters, ensemble weights and the alert threshold were fixed in advance. The 20% threshold comes from a 4:1 miss-vs-false-alarm cost ratio.
- Testing: 11 pytest unit tests, including leakage tests.
Results (out-of-sample)
- +24 h MAE: 6.70 API points, vs 7.35 for persistence (8.8% skill), 6.81 for Ridge, 6.88 for LightGBM, 7.08 for an MLP, and 13.96 for climatology.
- Unhealthy-alert PR-AUC: 0.84, 0.23 and 0.36 for the three test periods, vs 0.67, 0.18 and 0.25 for persistence and 0.47, 0.03 and 0.07 for an "API ≥ 80" rule. ECE ≤ 0.005.
- Haze onsets in 2019: 159 of 169 warned in advance, median 19 h ahead, at the same alert budget as the rule.
- 80% range coverage: 78.7% overall.
- Speed: all 67 stations forecast in 0.79 s on a 2-core CPU.
Challenges we ran into
- Early stopping on a calibration window that straddled the 2019 haze stopped one model after 12 trees. We switched to tree counts fixed in advance.
- LightGBM alone did worse than persistence on 2019's record haze, because it cannot extrapolate. Predicting changes and ensembling with Ridge fixed this.
- Prediction ranges were far too narrow during haze. Volatility-scaled conformal intervals helped, but coverage during haze is still below target, and we report that.
Accomplishments that we're proud of
An honest evaluation: walk-forward splits, seven baselines, calibration, onset lead times, and a "near miss" scenario built into the demo.
What we learned
During an established haze, "tomorrow ≈ today" is very hard to beat. The value of ML is in ranking risk, in calibrated probabilities, and in explaining why.
What's next
- Add wind, rainfall and fire-hotspot (MODIS/VIIRS) inputs so the model can see haze coming before it reaches the first station.
- Add pollutant-level data (PM2.5 and others) for true source attribution.
- Run on a live APIMS feed with Telegram/WhatsApp alerts for schools.
Responsible AI
This is an experimental research forecast, not an official DOE product, and it uses no personal data. Limitations (composite index only, under-coverage during haze, no live feed) are stated in the README and in the app.
AI tools used
Claude (Anthropic) was used for research, code and documentation. Every number comes from train.py runs in the repo.
Links
- Live demo: https://hazecast-my.streamlit.app
- Code: https://github.com/ShermaineYap/neural-storm
- Problem statement: GP-01 (Green Planet)
Built With
- conformal-prediction
- lightgbm
- machine-learning
- numpy
- pandas
- plotly
- pytest
- python
- scikit-learn
- shap
- streamlit
- time-series

