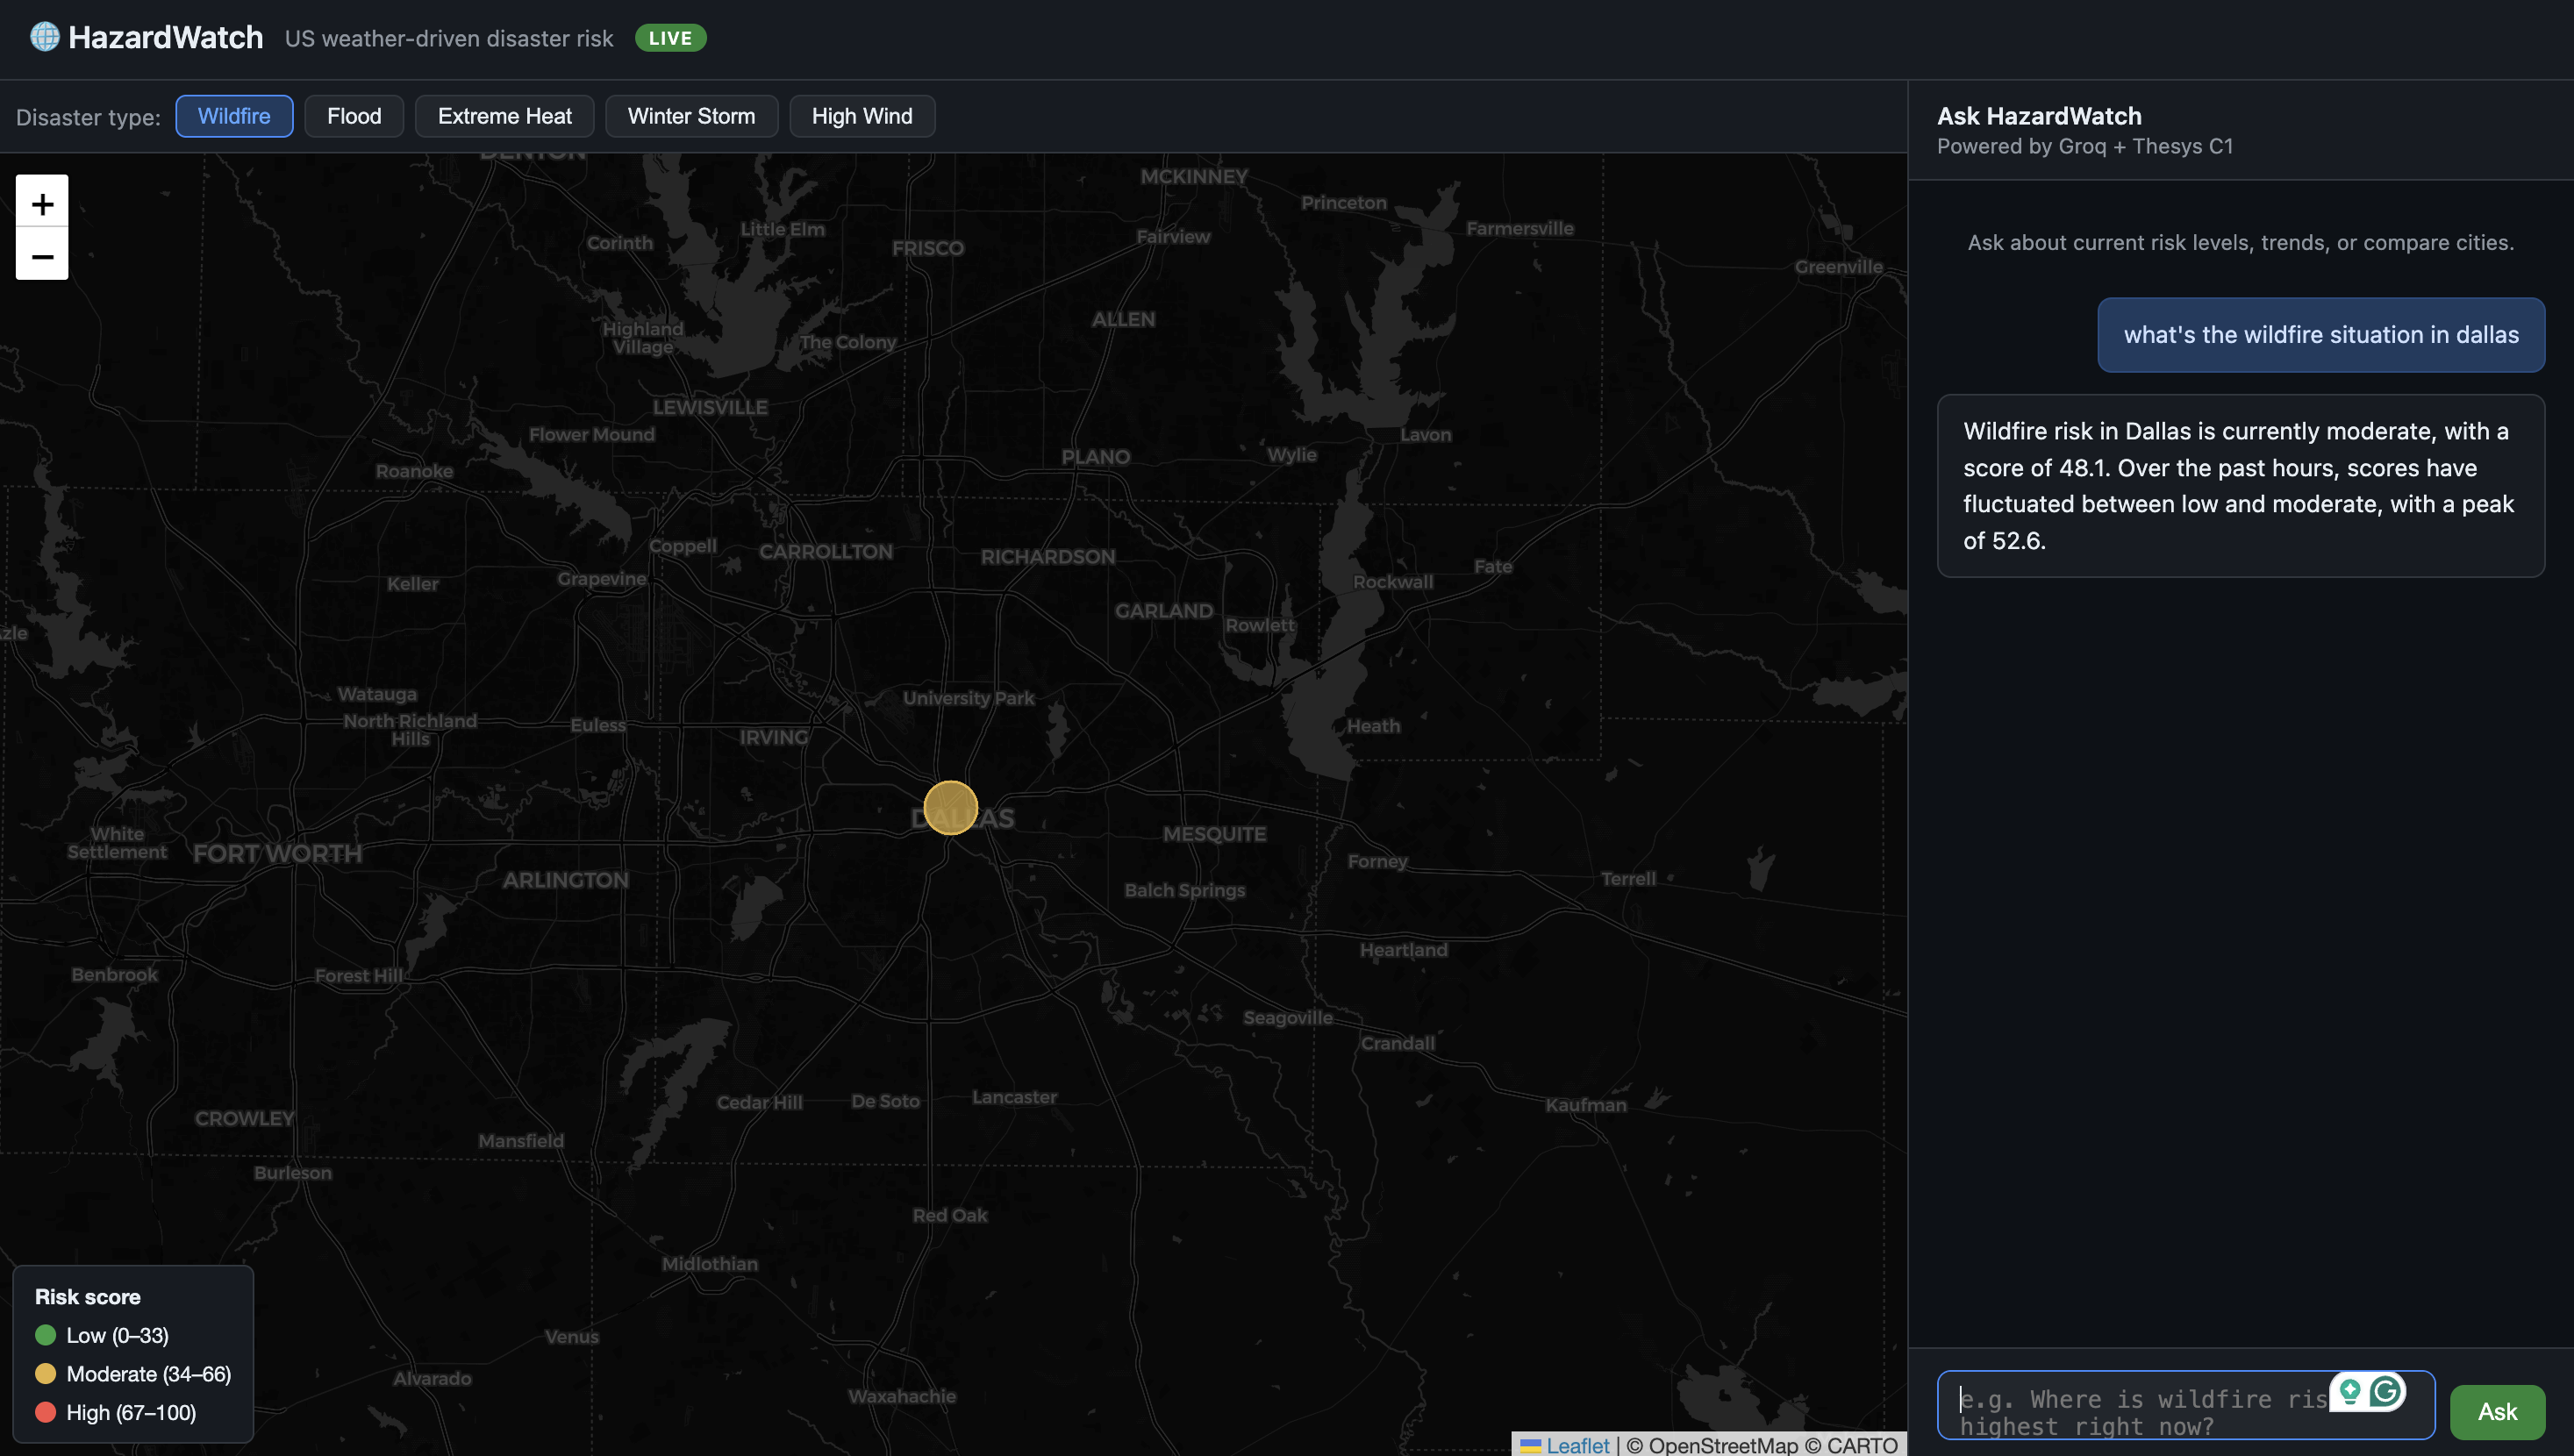
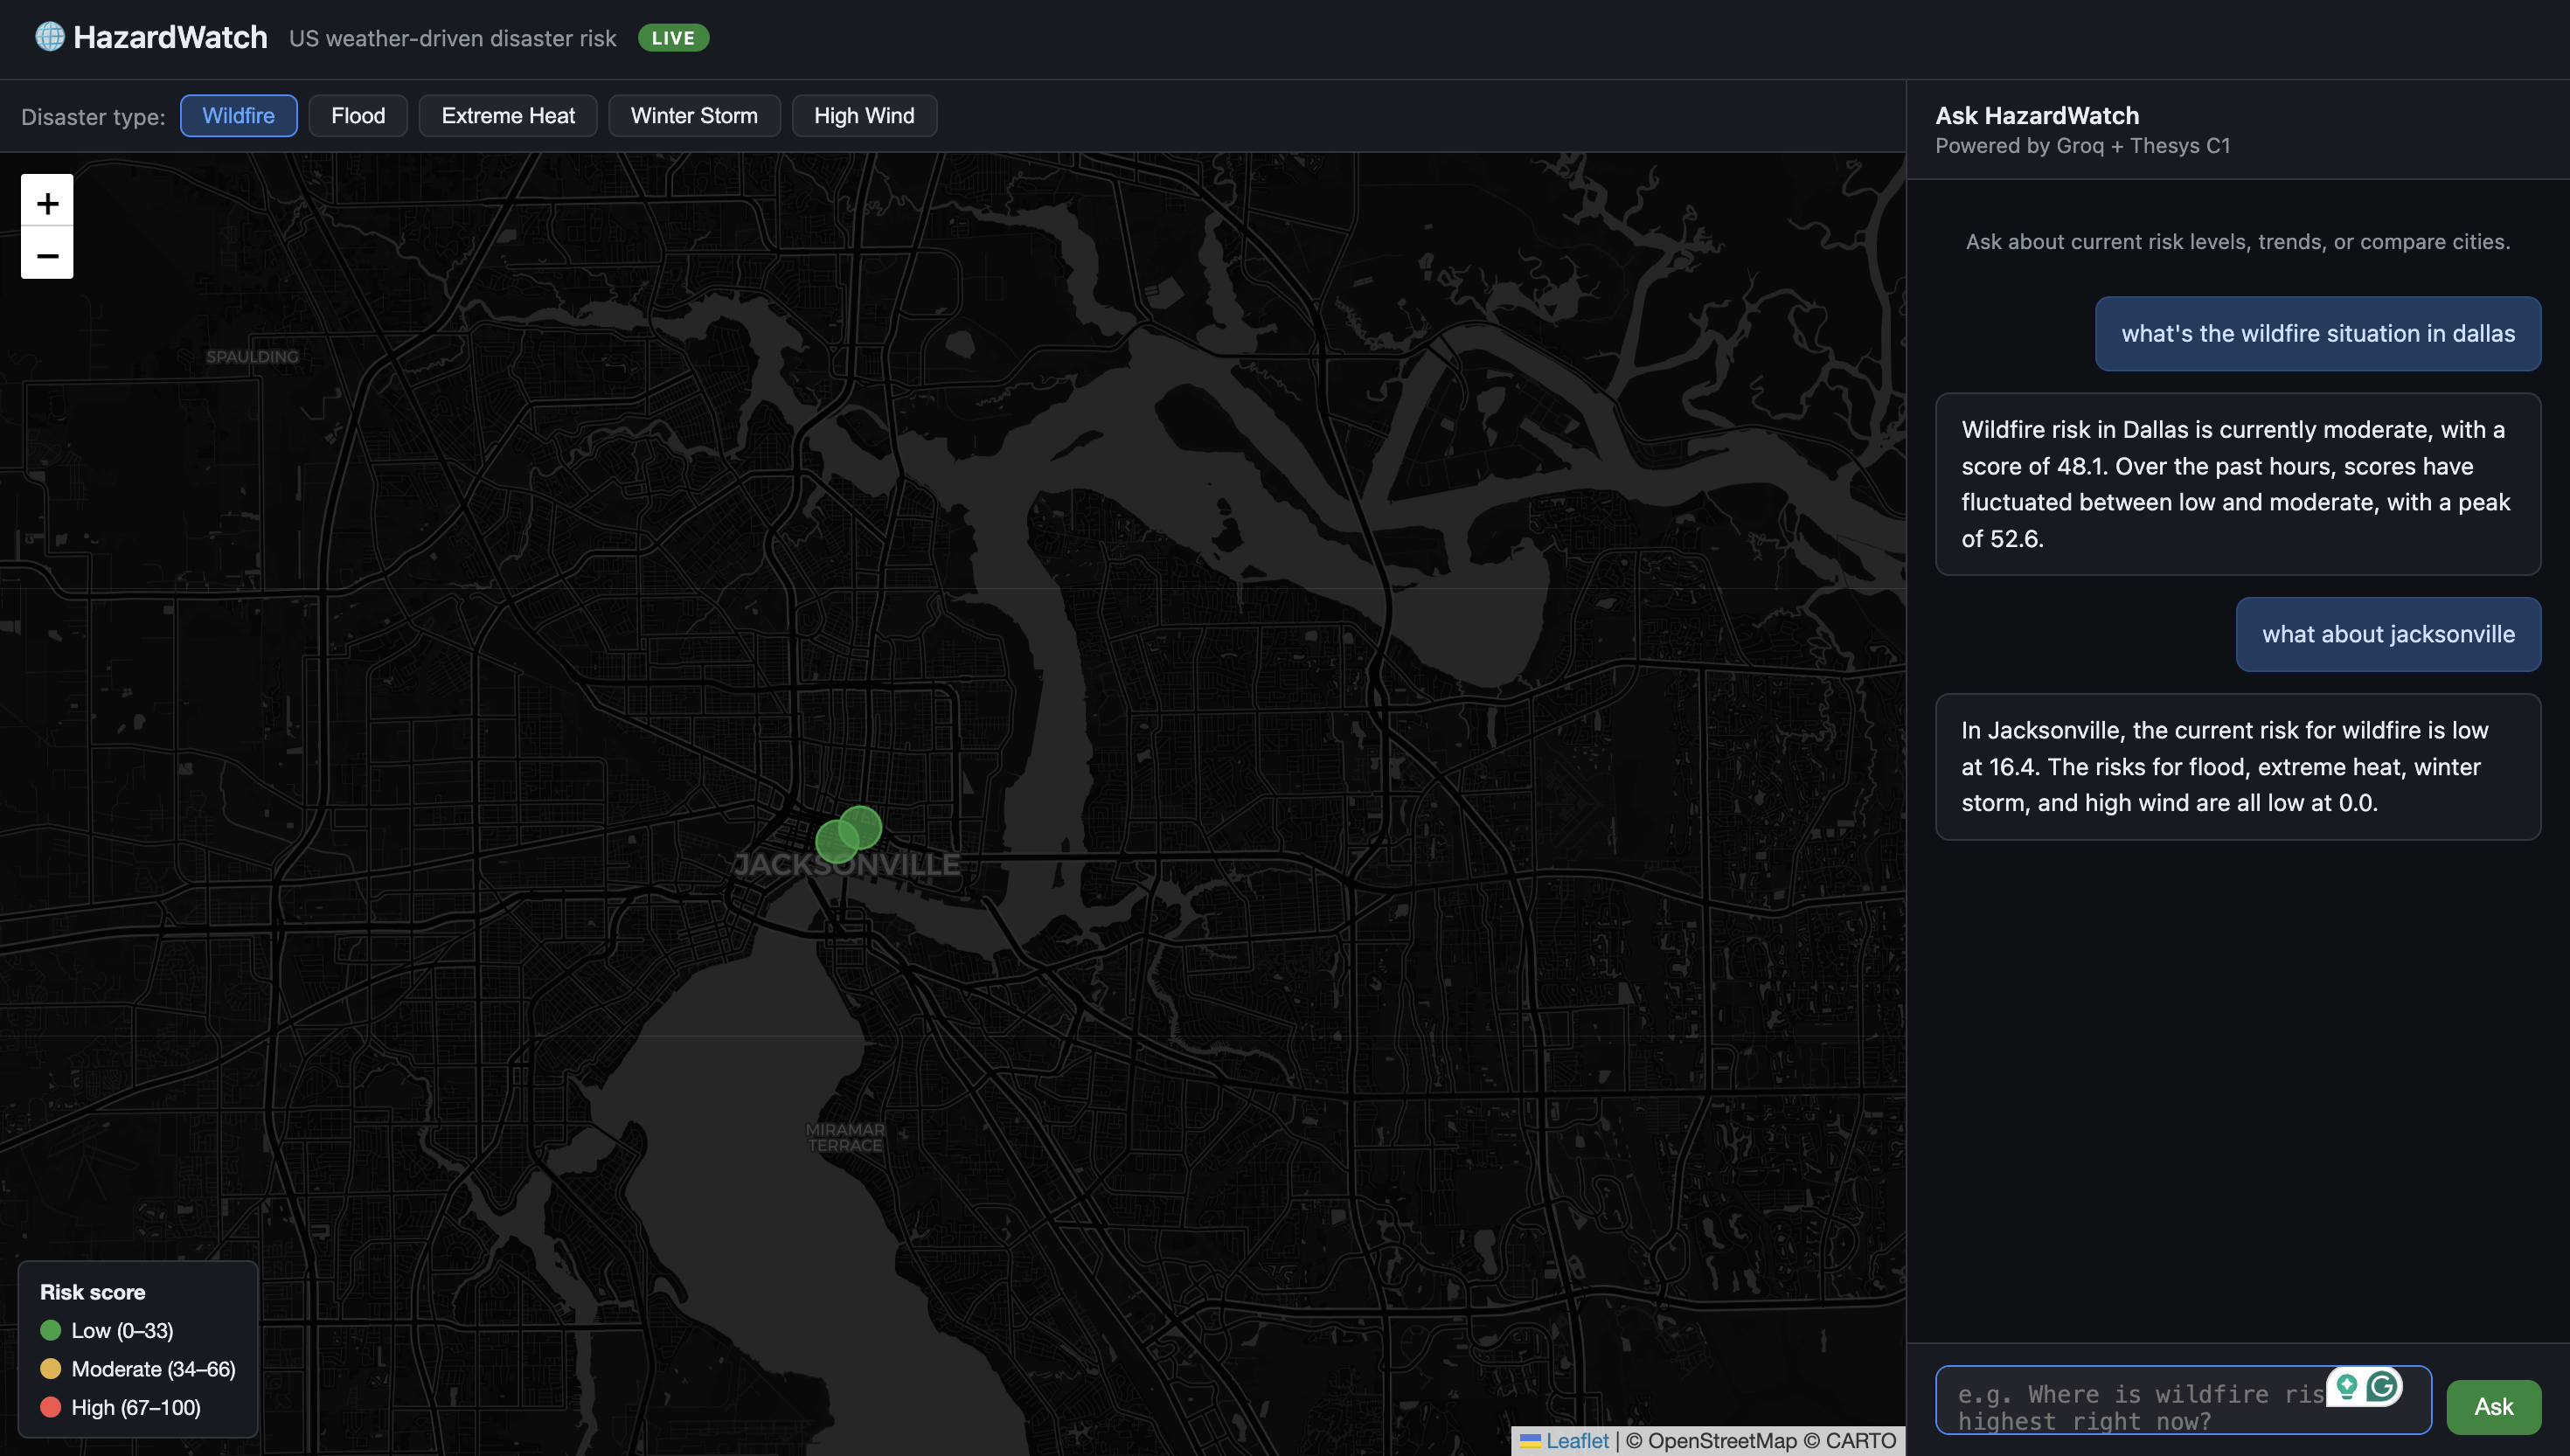
HazardWatch is a real-time weather risk dashboard that helps understand disaster risk before it peaks.
## What it does
Every hour, it pulls live forecasts from Open-Meteo across 20 US cities and computes risk scores (0–100) for five disaster types: wildfire,
flood, extreme heat, winter storm, and high wind. Scores are stored in ClickHouse and visualized on an interactive Leaflet map — color-coded
circles that update automatically.
## How it works
Two AI agents power the intelligence layer:
- Monitor agent — runs after every ingest, reasons about dangerous variable combinations and rising trends, and fires alerts
- Q&A analyst — answers natural-language questions on demand. Type "Is Miami at flood risk today?" and it geocodes the location, checks
for fresh data, fetches a live forecast if needed, and responds in plain English
The whole system is observable end-to-end via Langfuse — every tool call, LLM generation, and token usage traced across both agents.
## How to use it
- Open the map and pick a disaster type (wildfire, flood, heat, wind, winter storm)
- Watch the color-coded risk circles across US cities — green to red by severity
- Ask the chat panel anything: city name, disaster type, timeframe — the agent figures out the rest
Built With
- clickhouse
- langfuse
- render

Log in or sign up for Devpost to join the conversation.