Inspiration
Every year, drought, floods, and food crises push millions across the Horn of Africa to the brink of starvation. Early warning systems exist — but they are fragmented across agencies, buried in PDF reports, and arrive too late for the communities that need them most. We built Hazard Graph to close the gap between data and action: a real-time, AI-powered early warning system that fuses satellite rainfall data, IPC food security phases, market prices, climate forecasts, and causal models into a single intelligence graph. No more silos. No more delays. Just actionable alerts delivered in the languages people speak.
What it does
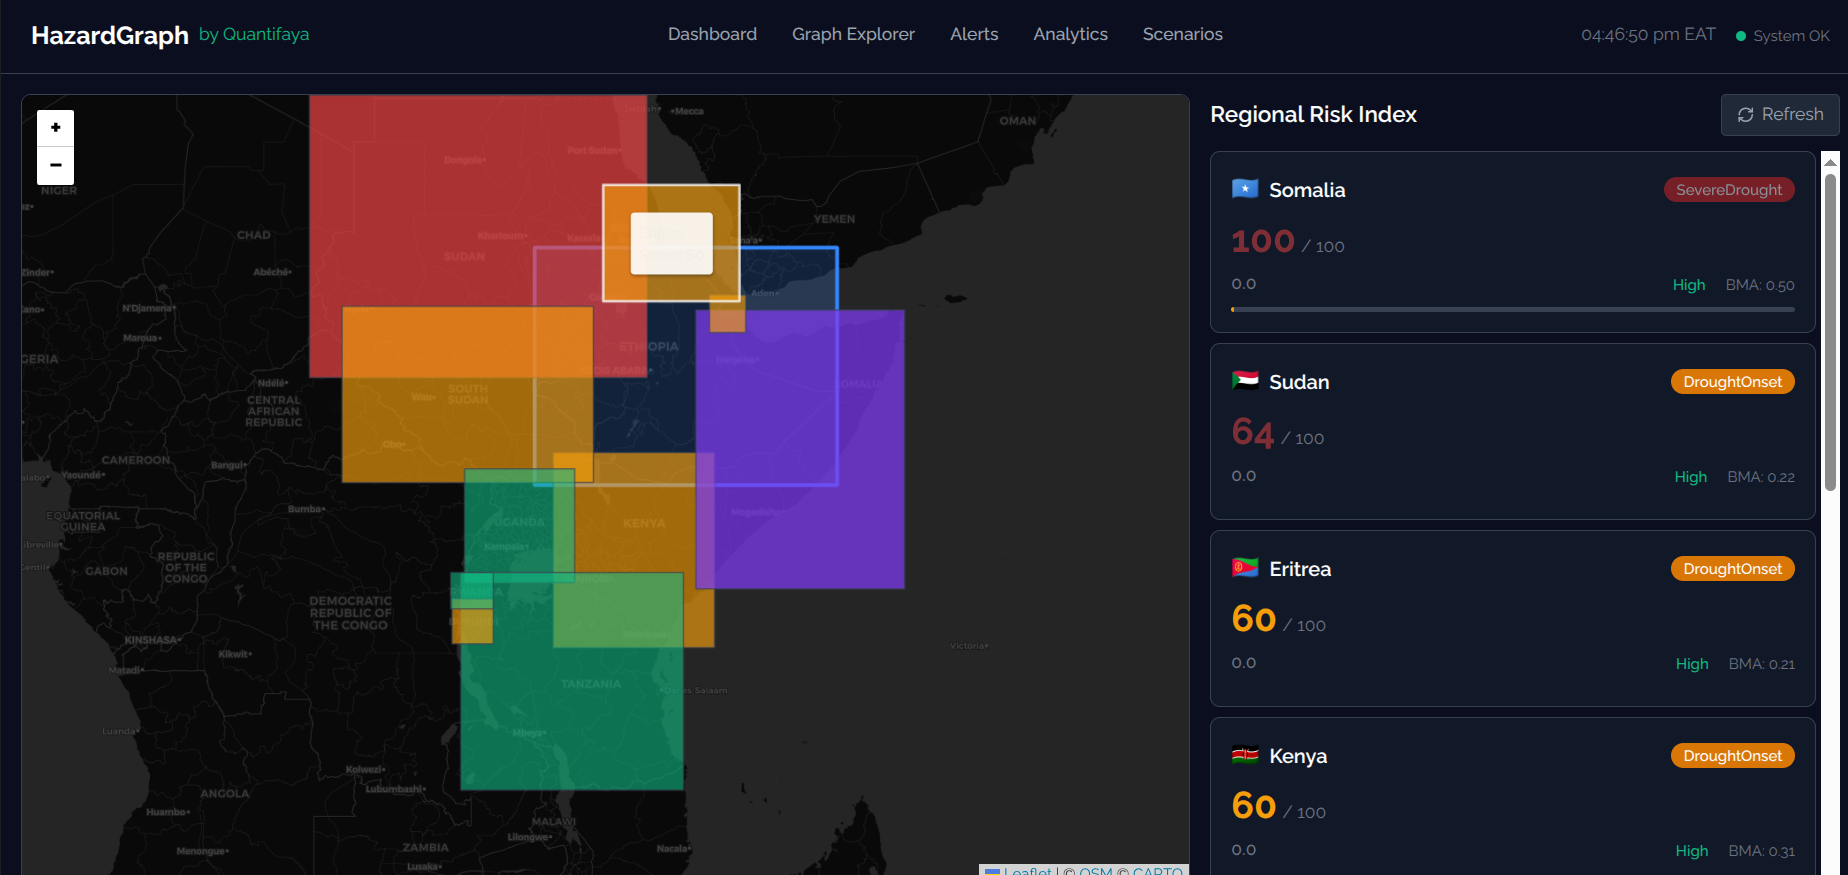
Hazard Graph is a food security early warning and decision-support platform for the IGAD region (11 countries). It ingests data from 7+ sources — CHIRPS v3.0 rainfall, ICPAC RSS forecasts, FEWS NET IPC phases, WFP DataBridges market prices, stochastic rainfall SDEs, CNN/ViT vegetation indices, and LSTM time-series forecasts — and fuses them into a Neo4j knowledge graph with causal edges discovered via VARLiNGAM (linear non-Gaussian acyclic causal discovery).
The system then:
- Detects hazard regimes (Baseline, Drought Onset, Severe Drought, Flood Watch, Flood Emergency) using Hidden Markov Models on SPI-30 signals
- Computes dynamic risk scores per region using Bayesian Model Averaging over 5 ensemble models, weighted by Kelly Criterion for optimal resource allocation
- Generates localized SMS alerts via Africa's Talking API in Somali, Amharic, Swahili, Arabic, and English
- Simulates contagion cascades (e.g., how a drought in Somalia propagates to Kenya through trade and migration networks)
- Trains a deep RL policy (PPO + Graph Neural Network) to recommend optimal intervention strategies
- Exposes everything through a REST API and a React dashboard with interactive force-directed graph, risk choropleth map, and alert review queue
How we built it
Backend: Python / FastAPI with async SQLAlchemy (Supabase/PostgreSQL), Neo4j 6.x graph database, Redis (Upstash) for caching and rate limiting, and APScheduler for periodic data ingestion.
Machine Learning Stack:
- PyTorch for GNN-based RL policy and LSTM drought forecasting
- scikit-learn for XGBoost food crisis prediction and Kalman filtering
- hmmlearn for Hidden Markov Model regime detection
- lingam (VARLiNGAM) for causal discovery from time-series data
- NeuralProphet for ensemble time-series forecasting
Data Pipeline:
- CHIRPS v3.0 rainfall data via HTTP API
- ICPAC RSS feed parsing with feedparser
- FEWS NET API with JWT authentication
- WFP DataBridges v2 with OAuth2 client credentials
- Stochastic differential equations for rainfall simulation
Frontend: React 18 + TypeScript, Vite, TailwindCSS, react-force-graph-2d, react-leaflet, Recharts, TanStack Query
Infrastructure:
- Render (Docker) — FastAPI backend
- Vercel — React frontend
- Neo4j Aura — managed graph database
- Supabase — PostgreSQL with asyncpg
- Upstash — serverless Redis
- Groq API — LLM-powered advisory generation
- Africa's Talking — SMS delivery to 11 countries
Challenges we ran into
- Async driver compatibility — SQLAlchemy's async engine required
asyncpg, but Supabase uses PgBouncer which doesn't support prepared statements. Solved by settingstatement_cache_size=0 - Neo4j 6.x API changes —
fetch()was removed in favor of async iteration, requiring a rewrite of all query result handling - CORS in production — The Vercel frontend couldn't talk to the Render backend until we properly configured
CORS_ORIGINSandVITE_API_URLacross both environments - FEWS NET authentication — Required reverse-engineering a JWT-based auth flow against their undocumented API endpoints
- WFP DataBridges v2 — The new OAuth2-based API required a complete rewrite of the market price fetcher
- RL training stability — The PPO agent's reward function was sensitive to GNN embedding dimensions and required careful tuning of the action space
- Time-series alignment — Merging dekadal (10-day) CHIRPS data with monthly IPC phases and weekly market prices required careful temporal resolution management
Accomplishments that we're proud of
- End-to-end pipeline running in production across 3 cloud providers (Render, Vercel, Neo4j Aura, Supabase, Upstash)
- 11 IGAD countries seeded with realistic risk signals, causal edges, and pending alerts
- 5 languages supported for SMS alerts — Somali, Amharic, Swahili, Arabic, English
- Deep RL + GNN running on a real graph database to recommend intervention strategies
- Bayesian Model Averaging with Kelly-optimal resource allocation — a first in food security early warning systems
- Causal discovery from real time-series data using VARLiNGAM, not just correlation-based heuristics
- Contagion cascade simulations modeling how food crises propagate through trade and migration networks
- Fully containerized Docker deployment that cold-starts in under 60 seconds on Render free tier
What we learned
- Graph databases are the right abstraction for food security — the domain is inherently relational (regions affect regions, hazards cascade through networks, interventions have dependencies)
- Causal discovery beats correlation — VARLiNGAM revealed lagged causal relationships (e.g., SPI-30 → IPC phase at 21-day lag) that simple correlation would miss
- RL for policy recommendation is hard but tractable — the GNN + PPO combination can learn sensible intervention strategies, but the reward function needs careful domain expertise
- Productionizing ML is 90% infrastructure — the real work was not building models, but connecting data sources, handling auth, managing schemas, and deploying reliably
- Async Python with FastAPI is production-ready — asyncpg, aioredis, and neo4j async drivers all work well together at scale
- PgBouncer + asyncpg requires explicit configuration — the
statement_cache_size=0lesson was learned the hard way after hours of debugging
What's next for Hazard Graph
- Sub-national admin levels — expand from 11 country-level regions to 200+ district-level (admin-2) regions for granular risk scoring
- Real-time CHIRPS ingestion — automated daily pipeline that fetches and processes the latest dekadal rainfall data
- Mobile app — React Native companion app for field officers to acknowledge alerts and submit ground-truth feedback
- Multi-modal LLM advisories — use Groq's vision models to analyze satellite imagery alongside text forecasts
- Public API — expose risk scores, causal edges, and forecasts as a public REST API for humanitarian organizations
- CI/CD pipeline — automated testing with GitHub Actions, Docker build, and deployment to Render + Vercel on every push
- Dashboard live demo — deploy a fully interactive demo showing the force-directed graph, risk map, and alert queue in real-time


Log in or sign up for Devpost to join the conversation.