-
-
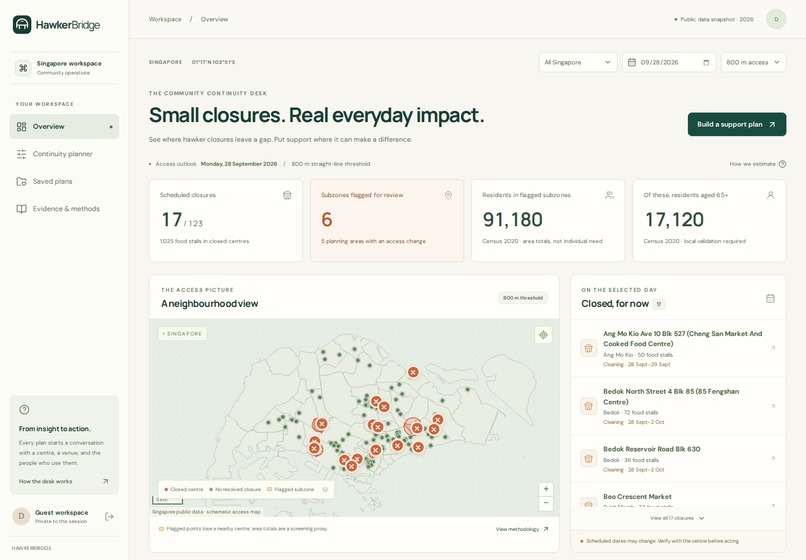
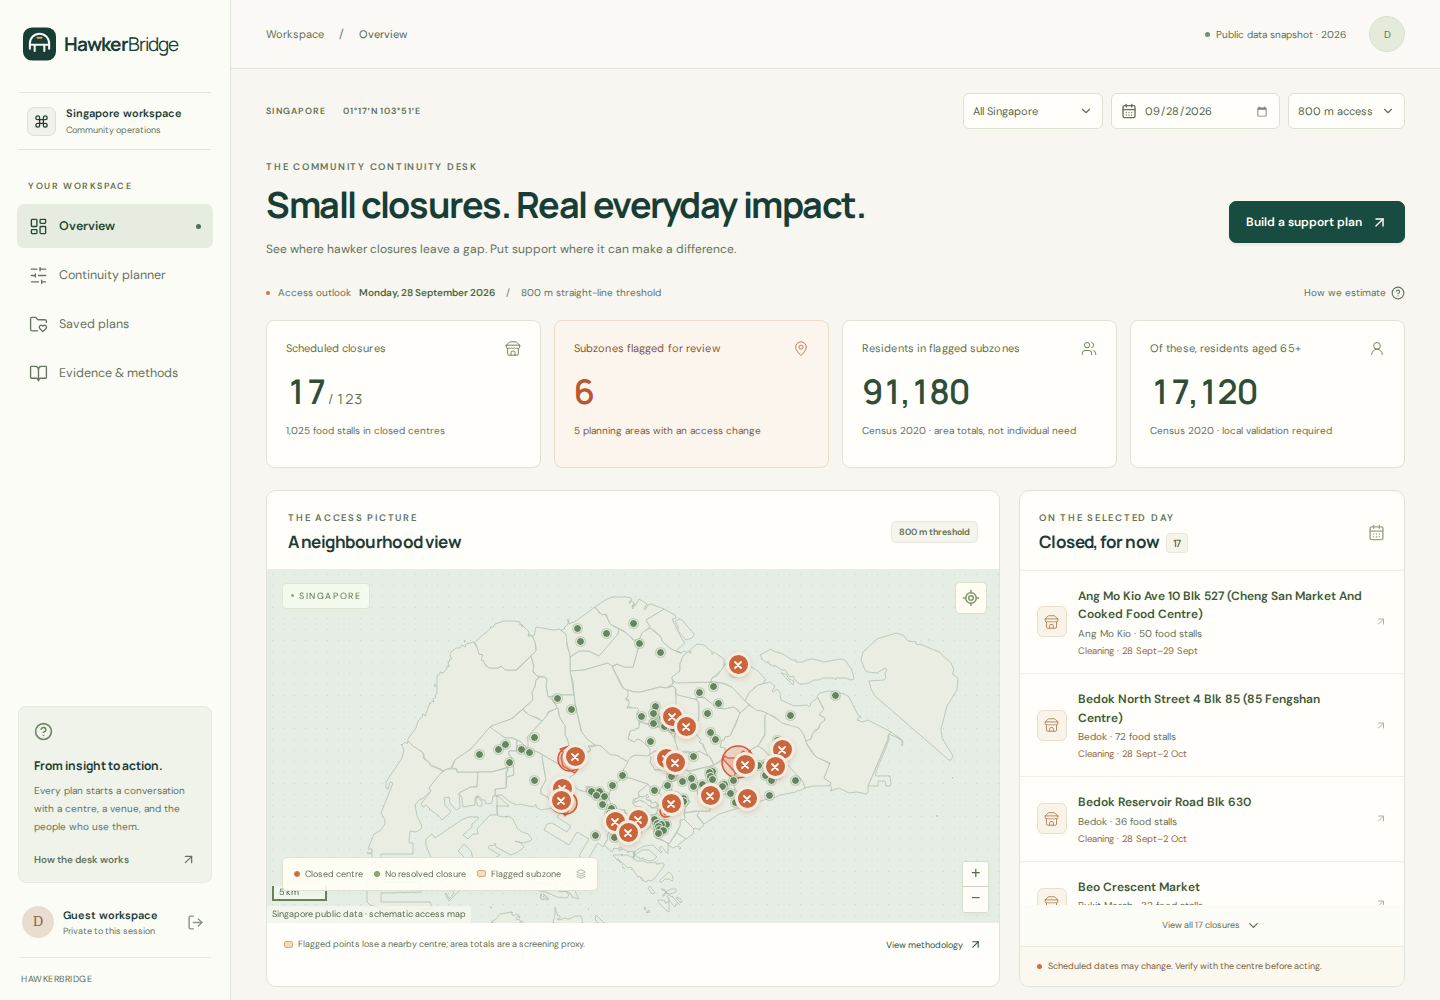
28 September 2026: 17 scheduled closures and six census subzones flagged for local investigation.
-
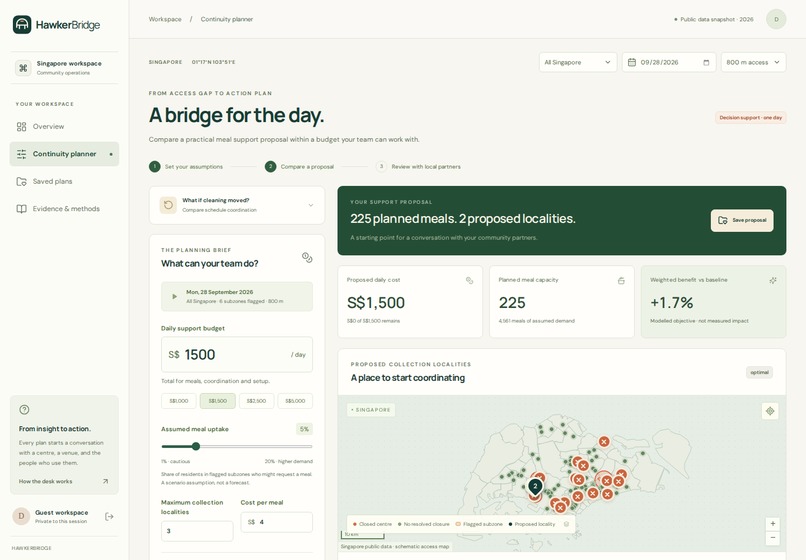
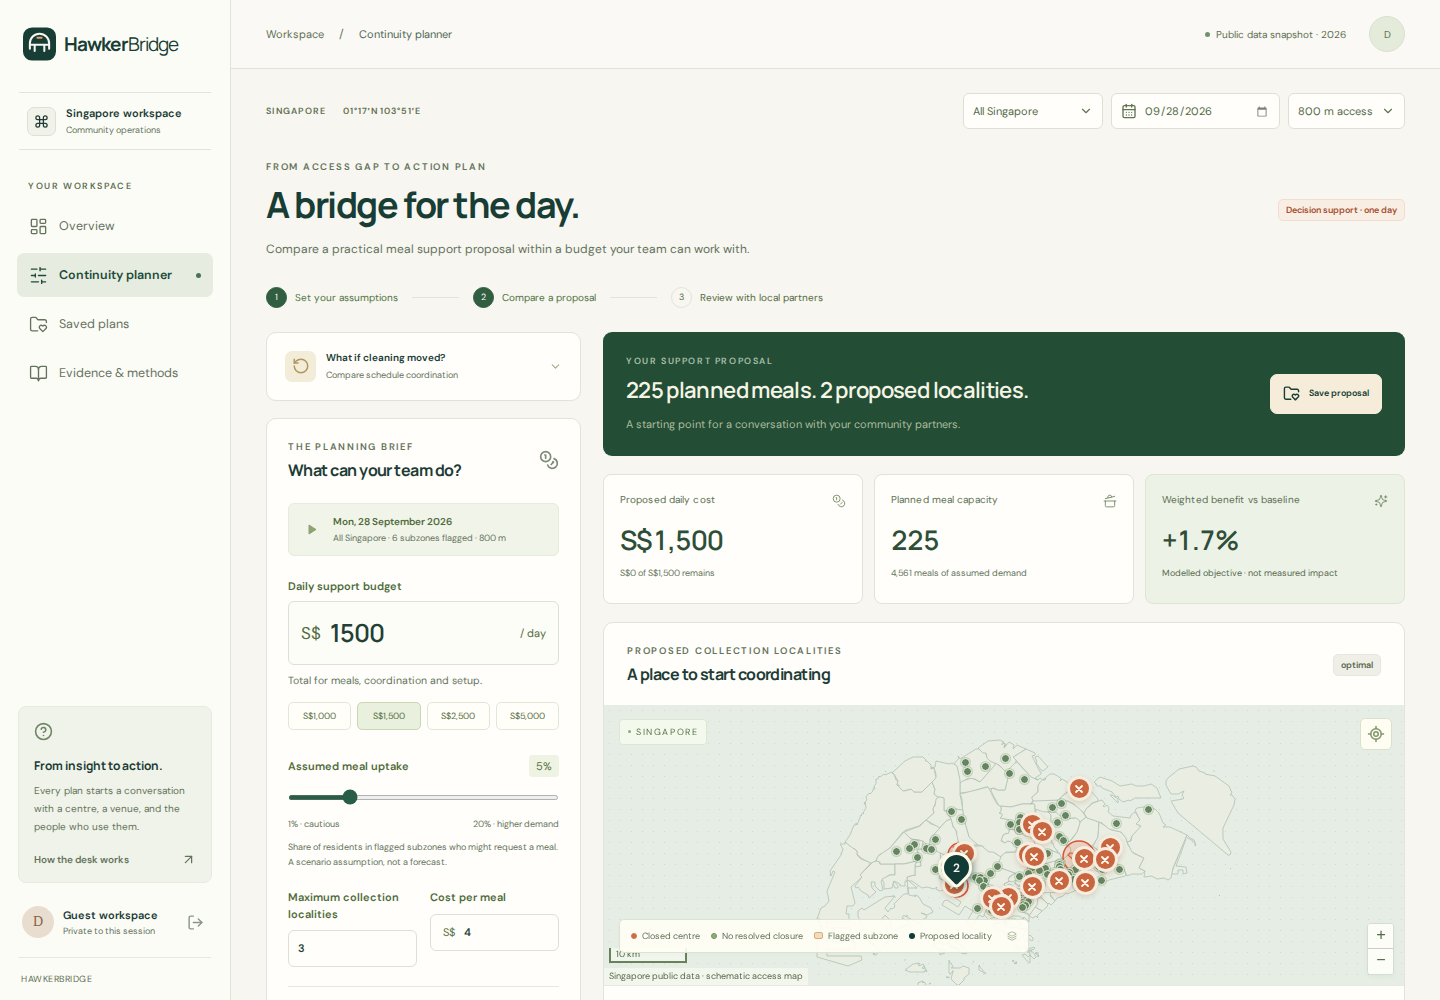
S$1,500 plans 225 meals across two proposed localities, using explicit costs and capacity assumptions.
-
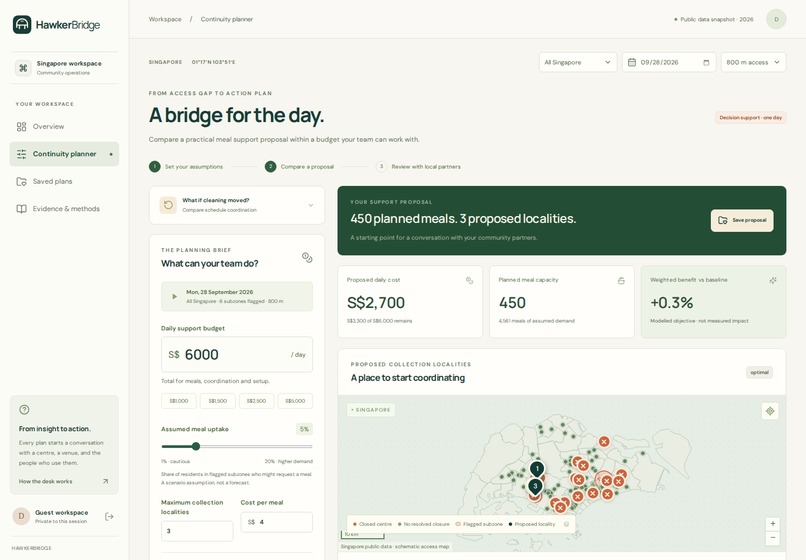
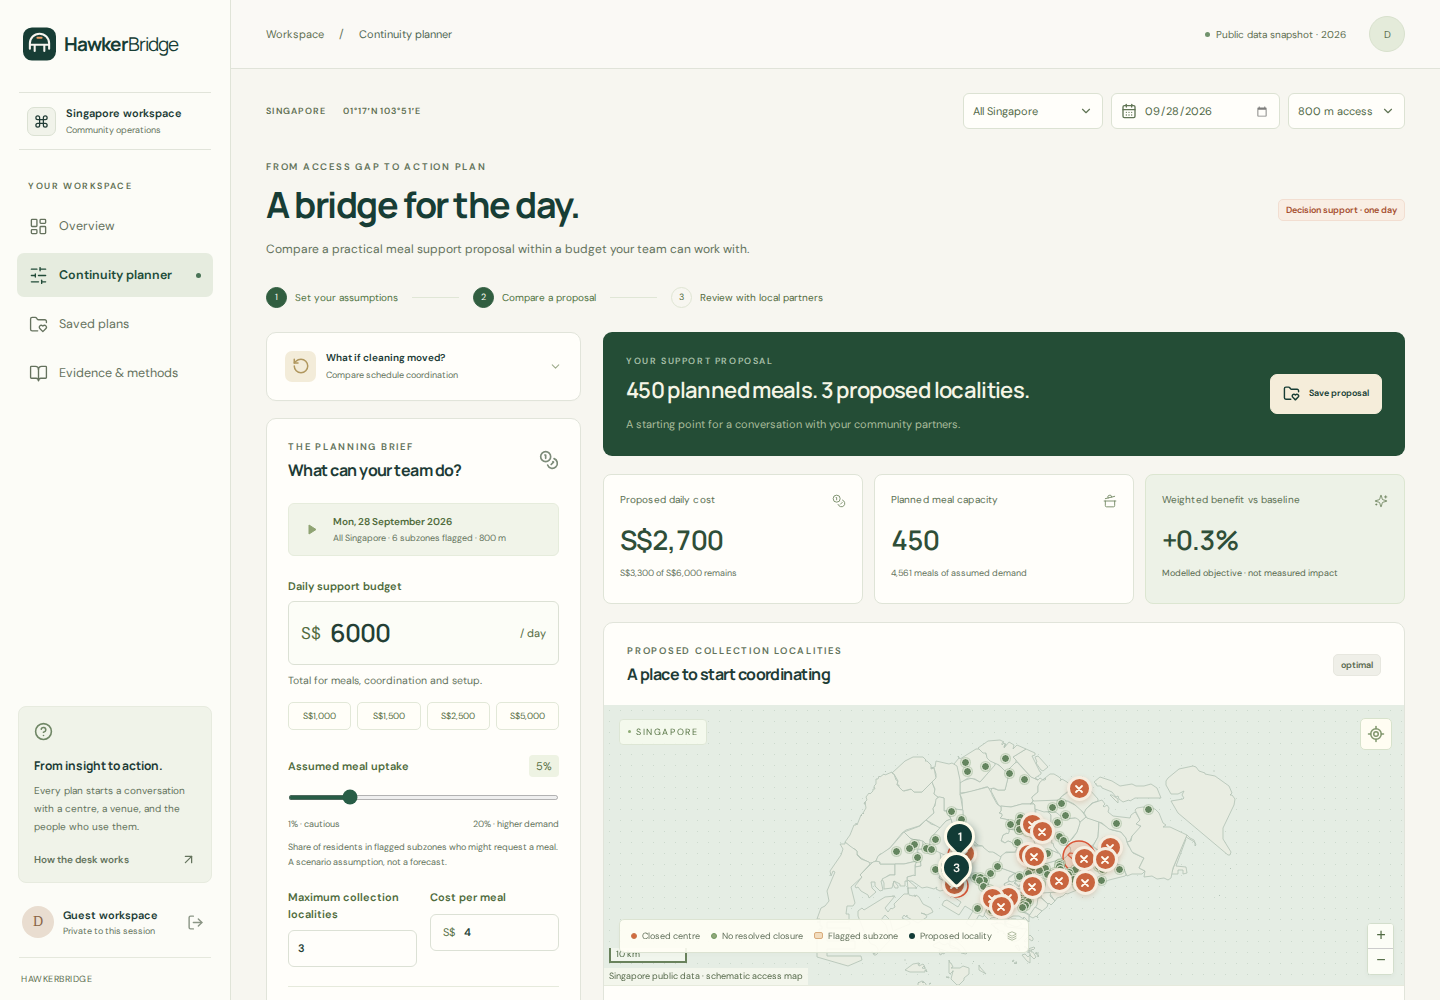
S$6,000 still plans 450 meals: three localities at 150 meals each limit the proposal to S$2,700 spending.
-
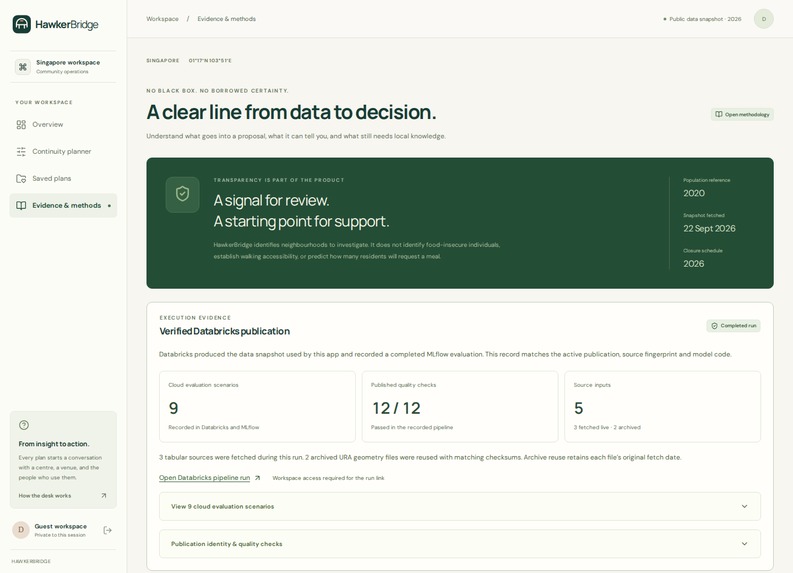
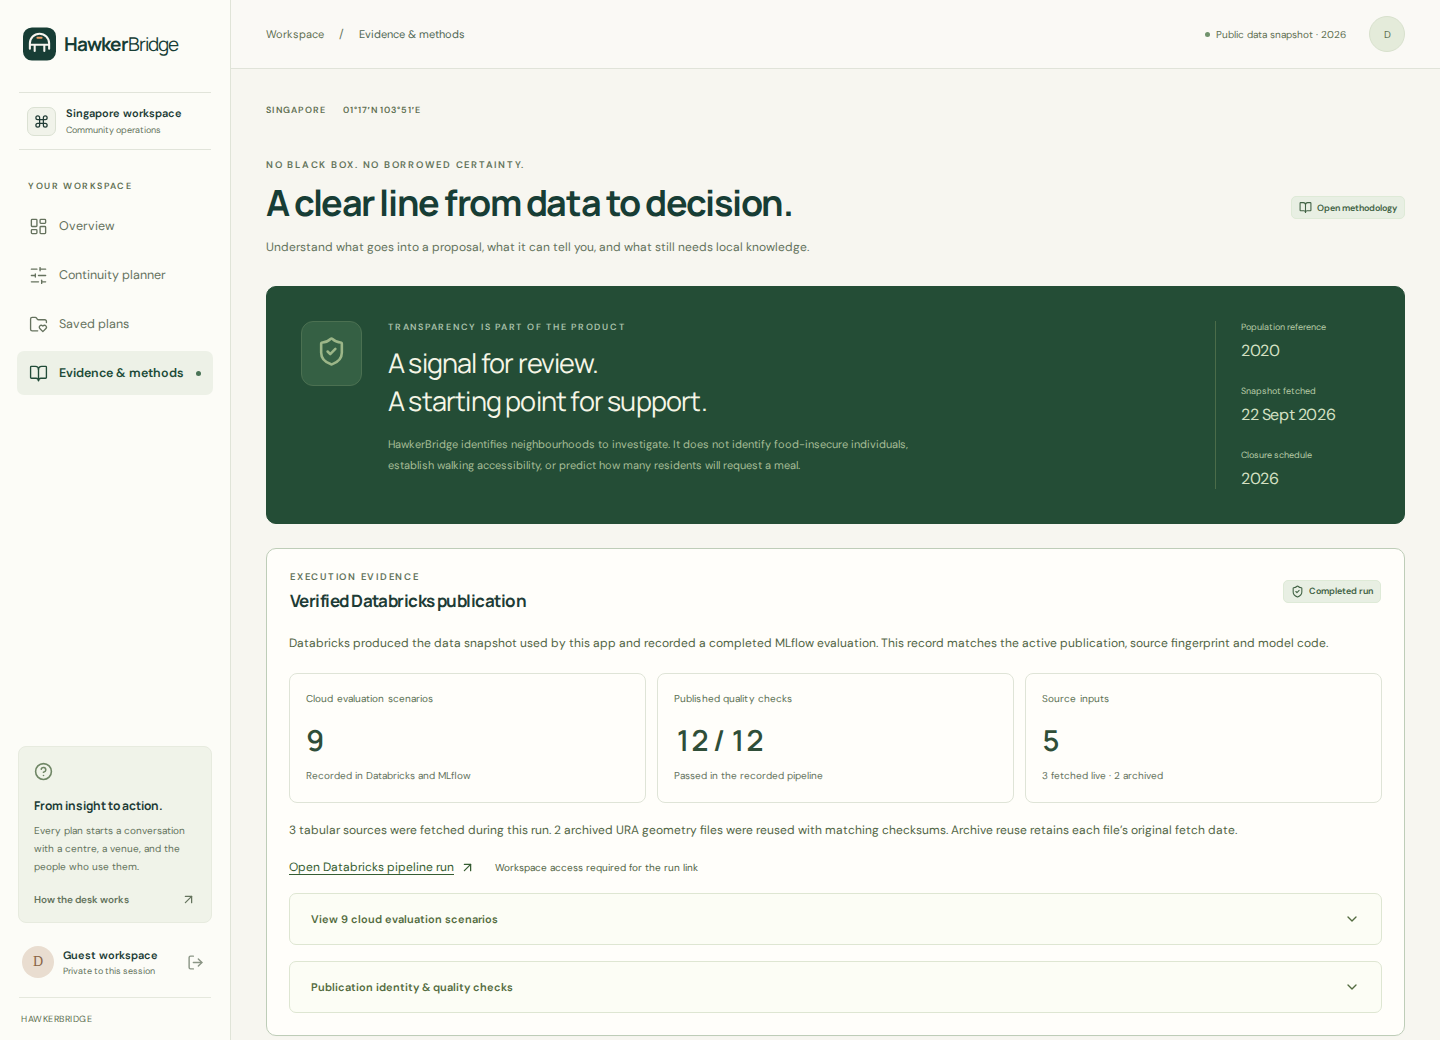
Verified Databricks publication: nine cloud scenarios, twelve passing quality checks and five preserved sources.
-

The actual 320px mobile planner keeps every budget preset visible and supports the full planning workflow.

Inspiration
A hawker centre closes for cleaning or repairs. The notice tells residents when it will close. A community coordinator still has to work out which neighbourhoods lose a nearby option, where temporary support could go, and what the available budget can achieve.
That gap inspired HawkerBridge: a practical continuity desk for Singapore's community teams. It addresses C3: KopilamAI. The goal is to help a coordinator make a clear, reviewable decision before a familiar daily routine is disrupted.
What it does
Pick a date, inspect scheduled closures and see which census subzones lose nearby hawker coverage. Compare a hypothetical cleaning-date change. Then enter a budget and explicit cost, capacity and participation assumptions to generate a meal-support proposal.
The most useful moment in our demonstration is simple. For 28 September 2026, the archived NEA schedule lists 17 centre closures. At an 800-metre straight-line threshold, six subzones are flagged for investigation. With the stated assumptions, S$1,500 plans 225 meals. S$3,000 plans 450. Double the budget to S$6,000, and the result stays at 450, with S$2,700 allocated. The limit is three localities with capacity for 150 meals each. More funding alone does not solve that constraint.
A coordinator can save a private proposal, inspect its assumptions, record review notes, and export a PDF brief, CSV or complete JSON record. The app does not book venues, move official closure dates or dispatch meals. Proposed localities and capacity require an operator's verification.
How we built it
HawkerBridge combines five Singapore national open datasets: NEA hawker centre closures and inventory, SingStat Census 2020 subzone age counts, URA planning-area boundaries, URA subzone boundaries and national waste statistics. Waste figures provide context, not a centre-level waste estimate.
The Python pipeline preserves source bytes, dates and checksums, normalises closure intervals, quarantines ambiguous dates and validates geographic joins. A completed Databricks serverless Lakeflow Job published Bronze/Silver/Gold Delta tables under Unity Catalog and recorded nine scenario comparisons in MLflow. All twelve publication quality checks passed. Three tabular sources were fetched live; two URA geometry archives were reused with their original dates and verified checksums.
A transparent geospatial screen feeds a mixed-integer allocation model using SciPy and HiGHS. It respects budget, setup costs, meal costs, capacity, geographic reach and a declared senior-priority weight. React, TypeScript and Leaflet provide the interface; FastAPI serves the same planning engine and exports.
The public interface is available at hawkerbridge-sg.web.app, with Firebase Authentication, Cloud Firestore and a Python API on Cloud Run in Singapore. Private proposals survive application instances. Server-verified sessions, owner checks, optimistic edit revisions and resumable deletion protect the workflow. The application checks source and model fingerprints before displaying cloud execution evidence.
Databricks execution and the public release are verified. The final hosted run passed all four browser journeys, six accessibility scans, 180 backend tests and 30 frontend tests. Checks cover managed sign-in, private plans, the 225/450/450 comparison, all exports, stale-edit rejection, map navigation and 320px/390px layouts. A saved account and proposal also survived a container rollout. Hosted verification and Databricks evidence are available in the public repository.
Challenges we ran into
The data describes centres and census areas, not observed meal demand. We could not honestly train a hunger predictor or claim that every flagged resident needs support. The screen therefore uses subzone representative points and clearly labelled participation assumptions. Census 2020 totals are historical area counts, and straight-line distances are not accessible walking routes.
Closure records also contain unknown dates and staggered works. We preserve these in quarantine instead of silently treating them as confirmed open. Geographic scope must retain relevant alternatives across planning-area boundaries. Saved proposals must preserve their own source evidence, even when the active data changes.
Moving from a local app to public hosting exposed another practical challenge: accounts and plans must survive server restarts and remain private across users. That required durable managed authentication and storage, explicit session handling, and tests against the hosted service.
Accomplishments that we're proud of
We built a complete source-to-decision workflow with reproducible public data, constrained allocation, saved proposals and usable exports. The model explains when money helps and when capacity is the real constraint.
The local robustness benchmark covers 15 unique scenarios on the published snapshot, all passing an independently reconstructed feasibility audit. Across its nine primary budget scenarios, the policy-weighted objective improves 0.3% to 9.2% over a largest-demand-first baseline. Tiny-instance exhaustive checks and adversarial tests examine the mathematics and failure handling.
The nine actual Databricks evaluations are a separate set: 22 September, 5 October and 14 December, each at S$600, S$1,500 and S$3,000, with 800-metre reach. Their policy-weighted objective improvement is 2.8% to 9.2%. The September 28 demonstration is an API recomputation using the published data. These are model comparisons under stated assumptions, not observed meal demand, predictive accuracy or measured social impact.
What we learned
A useful planning tool must make uncertainty visible at the point of decision. A convincing map alone is not enough. The coordinator needs to know which dates are uncertain, what a population count means, why a proposal stops growing, and which facts still need local verification.
We also learned that commercial value depends on a recurring operational task. Public data and an optimiser alone are easy to copy. Verified venue capacity, trustworthy records and integration into a coordinator's workflow would have to earn repeat use.
What's next for HawkerBridge
The next step is one operator and one scheduled closure. A four-to-six-week pilot would compare preparation time, factual omissions, venue feasibility, uptake and cost with the existing process. A proposed 30% preparation-time reduction is a pilot target, not an achieved result.
Our buyer hypothesis is an estate operator or funded community organisation managing repeated disruptions. We would test a S$1,000 scoped pilot and a S$250 to S$500 monthly organisation subscription. These are pricing hypotheses; there are no claimed customers, interviews, partnerships or revenue. Residents would not pay for essential assistance information. Commercial operation requires suitable paid infrastructure.
Testing instructions
Open HawkerBridge and choose Explore as a guest. No API key or shared password is needed. Select 28 September 2026, All Singapore and 800 m access. In Continuity planner, compare budgets 1,500, 3,000 and 6,000 with the defaults: 5% participation, S$4 per meal, S$300 setup, three localities and 150 meals each. Expect 225 / 450 / 450 planned meals. Save a draft, inspect its review checklist, and export PDF, CSV or JSON. Open Evidence & methods to inspect the verified publication and source limitations. Use synthetic notes and delete test plans afterwards. Full testing instructions.
Project owner: Shivam Gupta. Course: Computer Science. Shivam initiated the brief, set the product goals and owns the project. Research, implementation, testing and presentation preparation used AI assistance. Sources, software and visual credits are documented in the repository.
Built With
- databricks
- fastapi
- firebase
- google-cloud
- leaflet.js
- mlflow
- python
- react
- scipy
- typescript

Log in or sign up for Devpost to join the conversation.