-
-
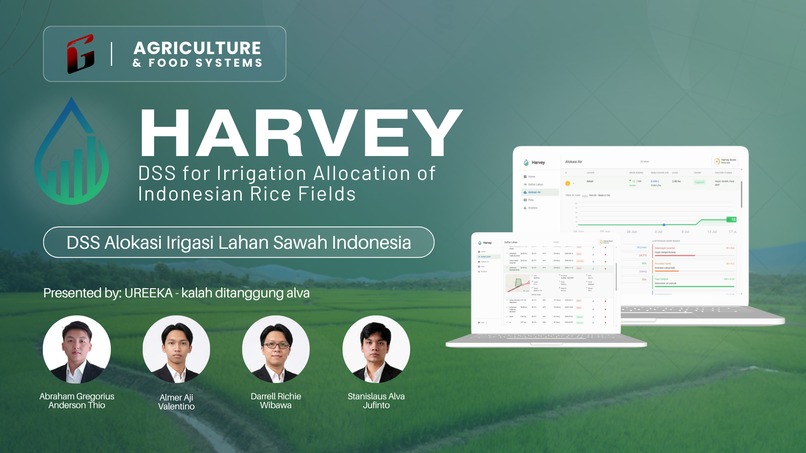
Harvey App
-
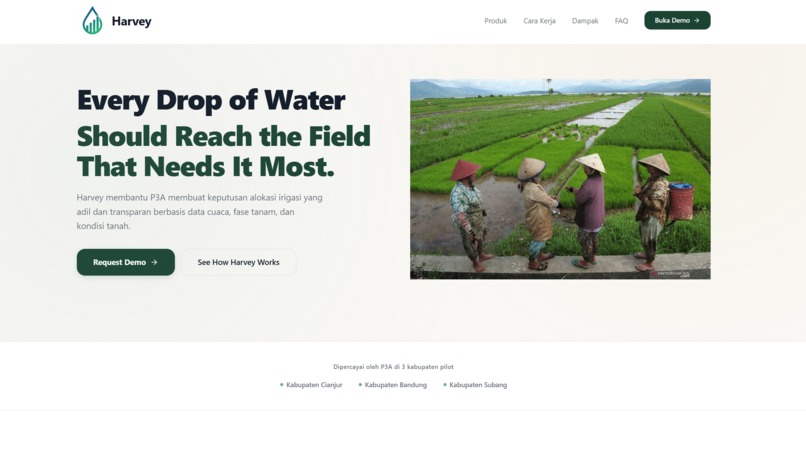
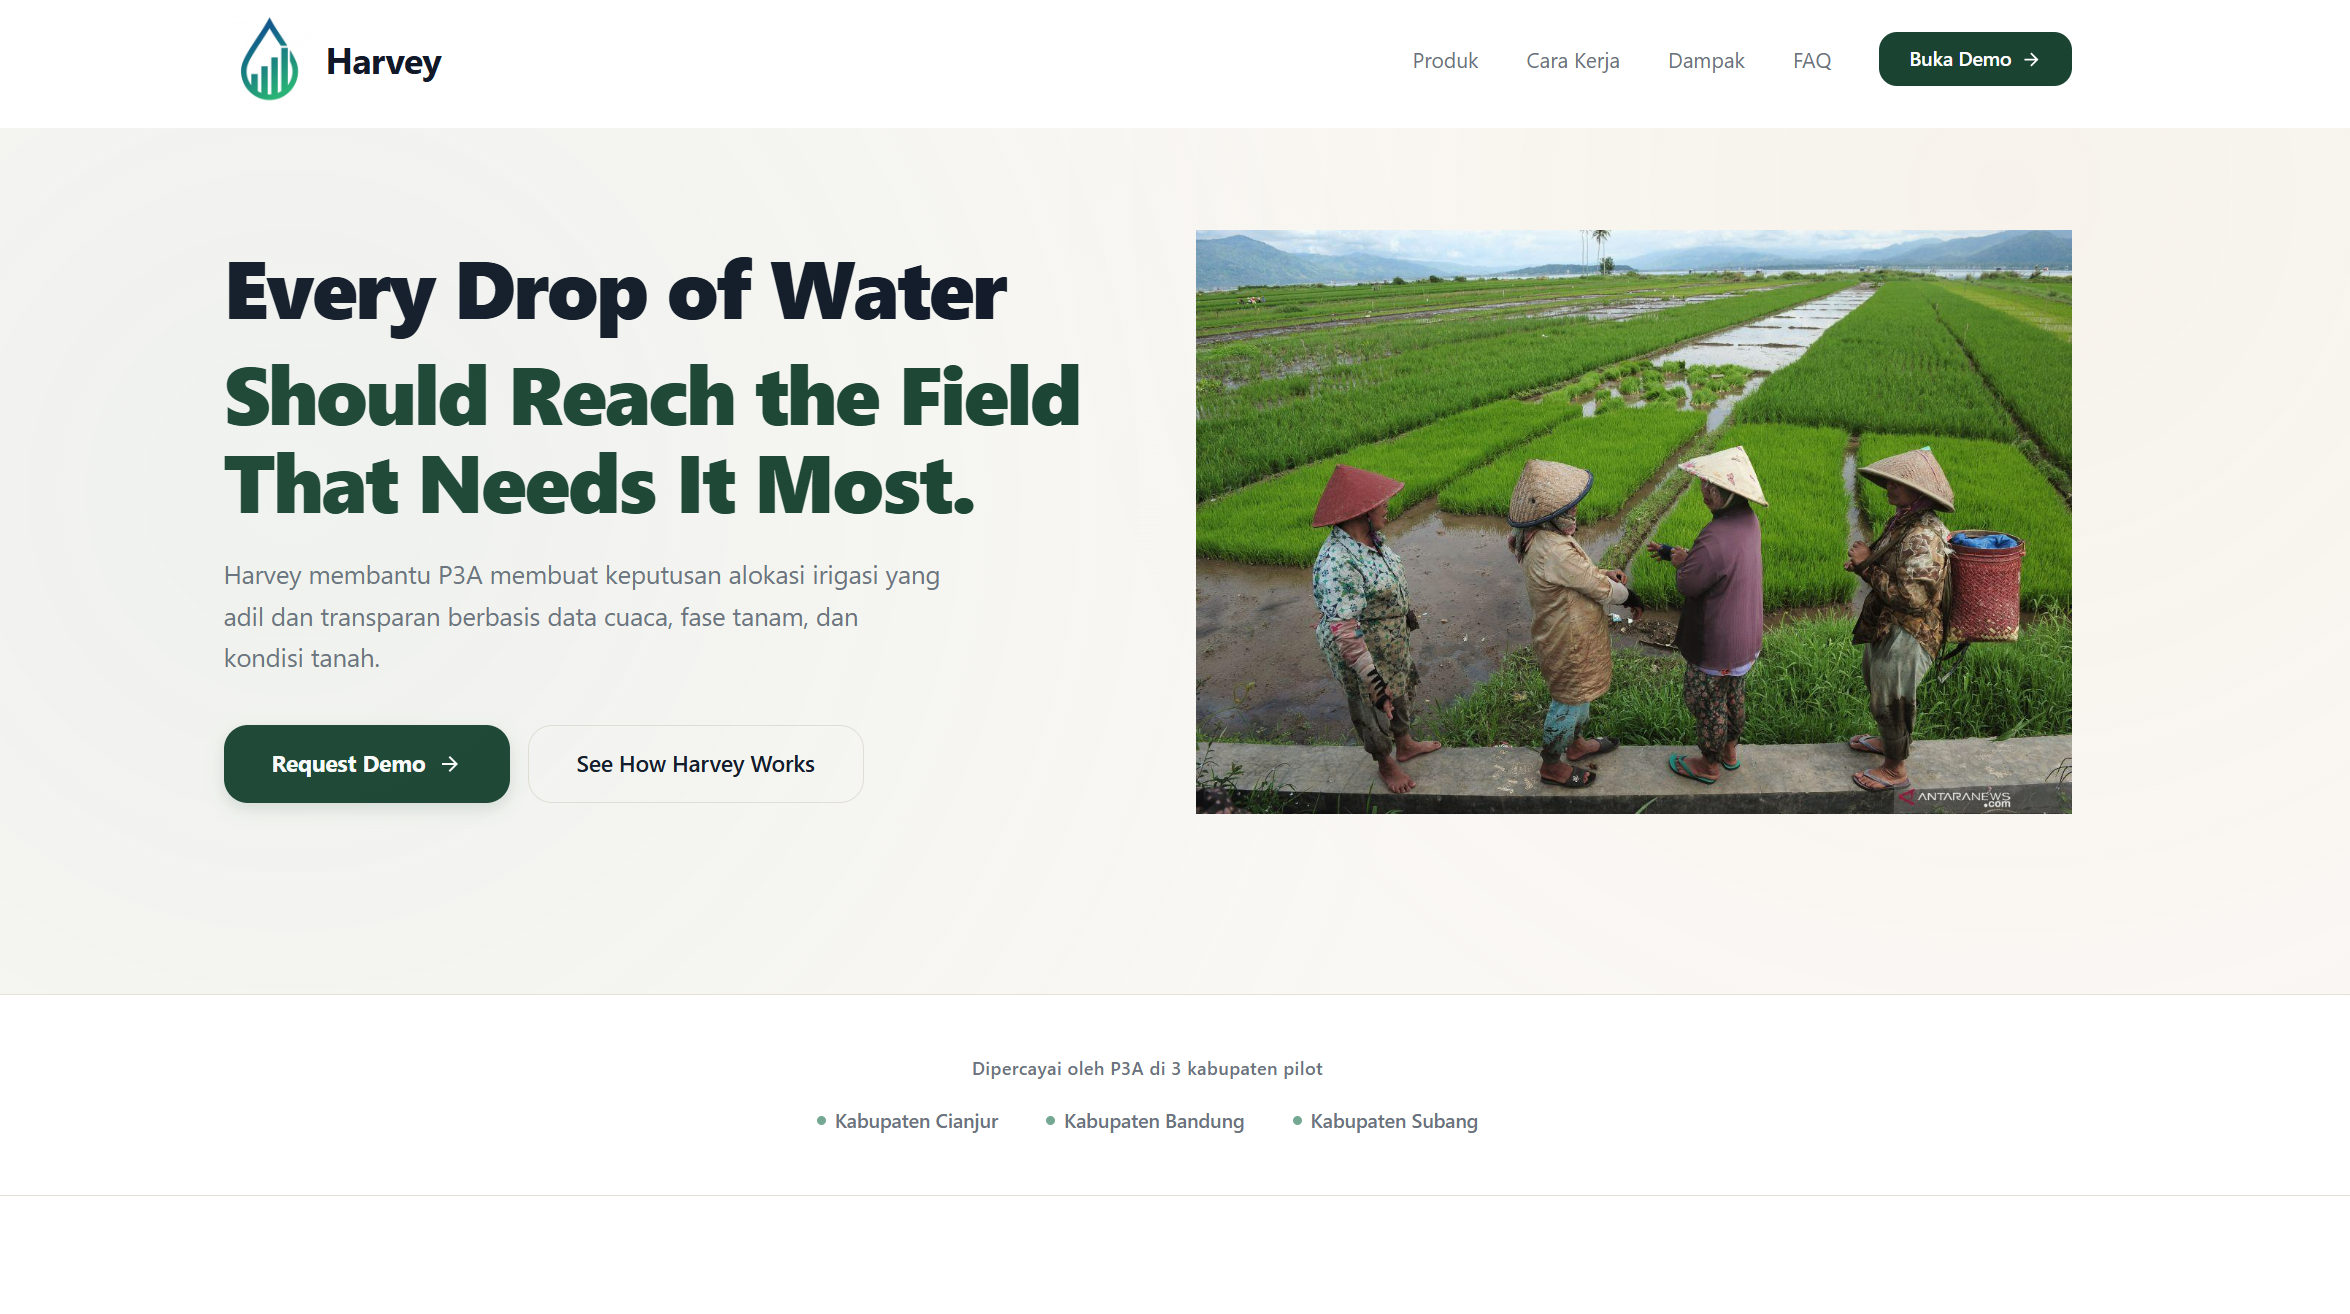
Landing Page
-
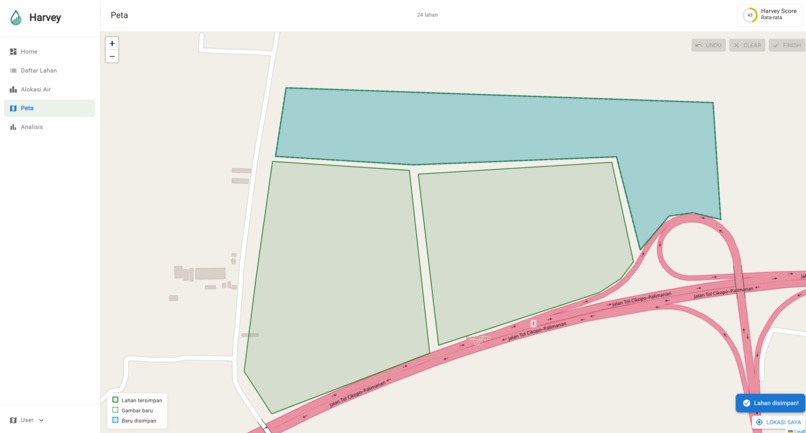
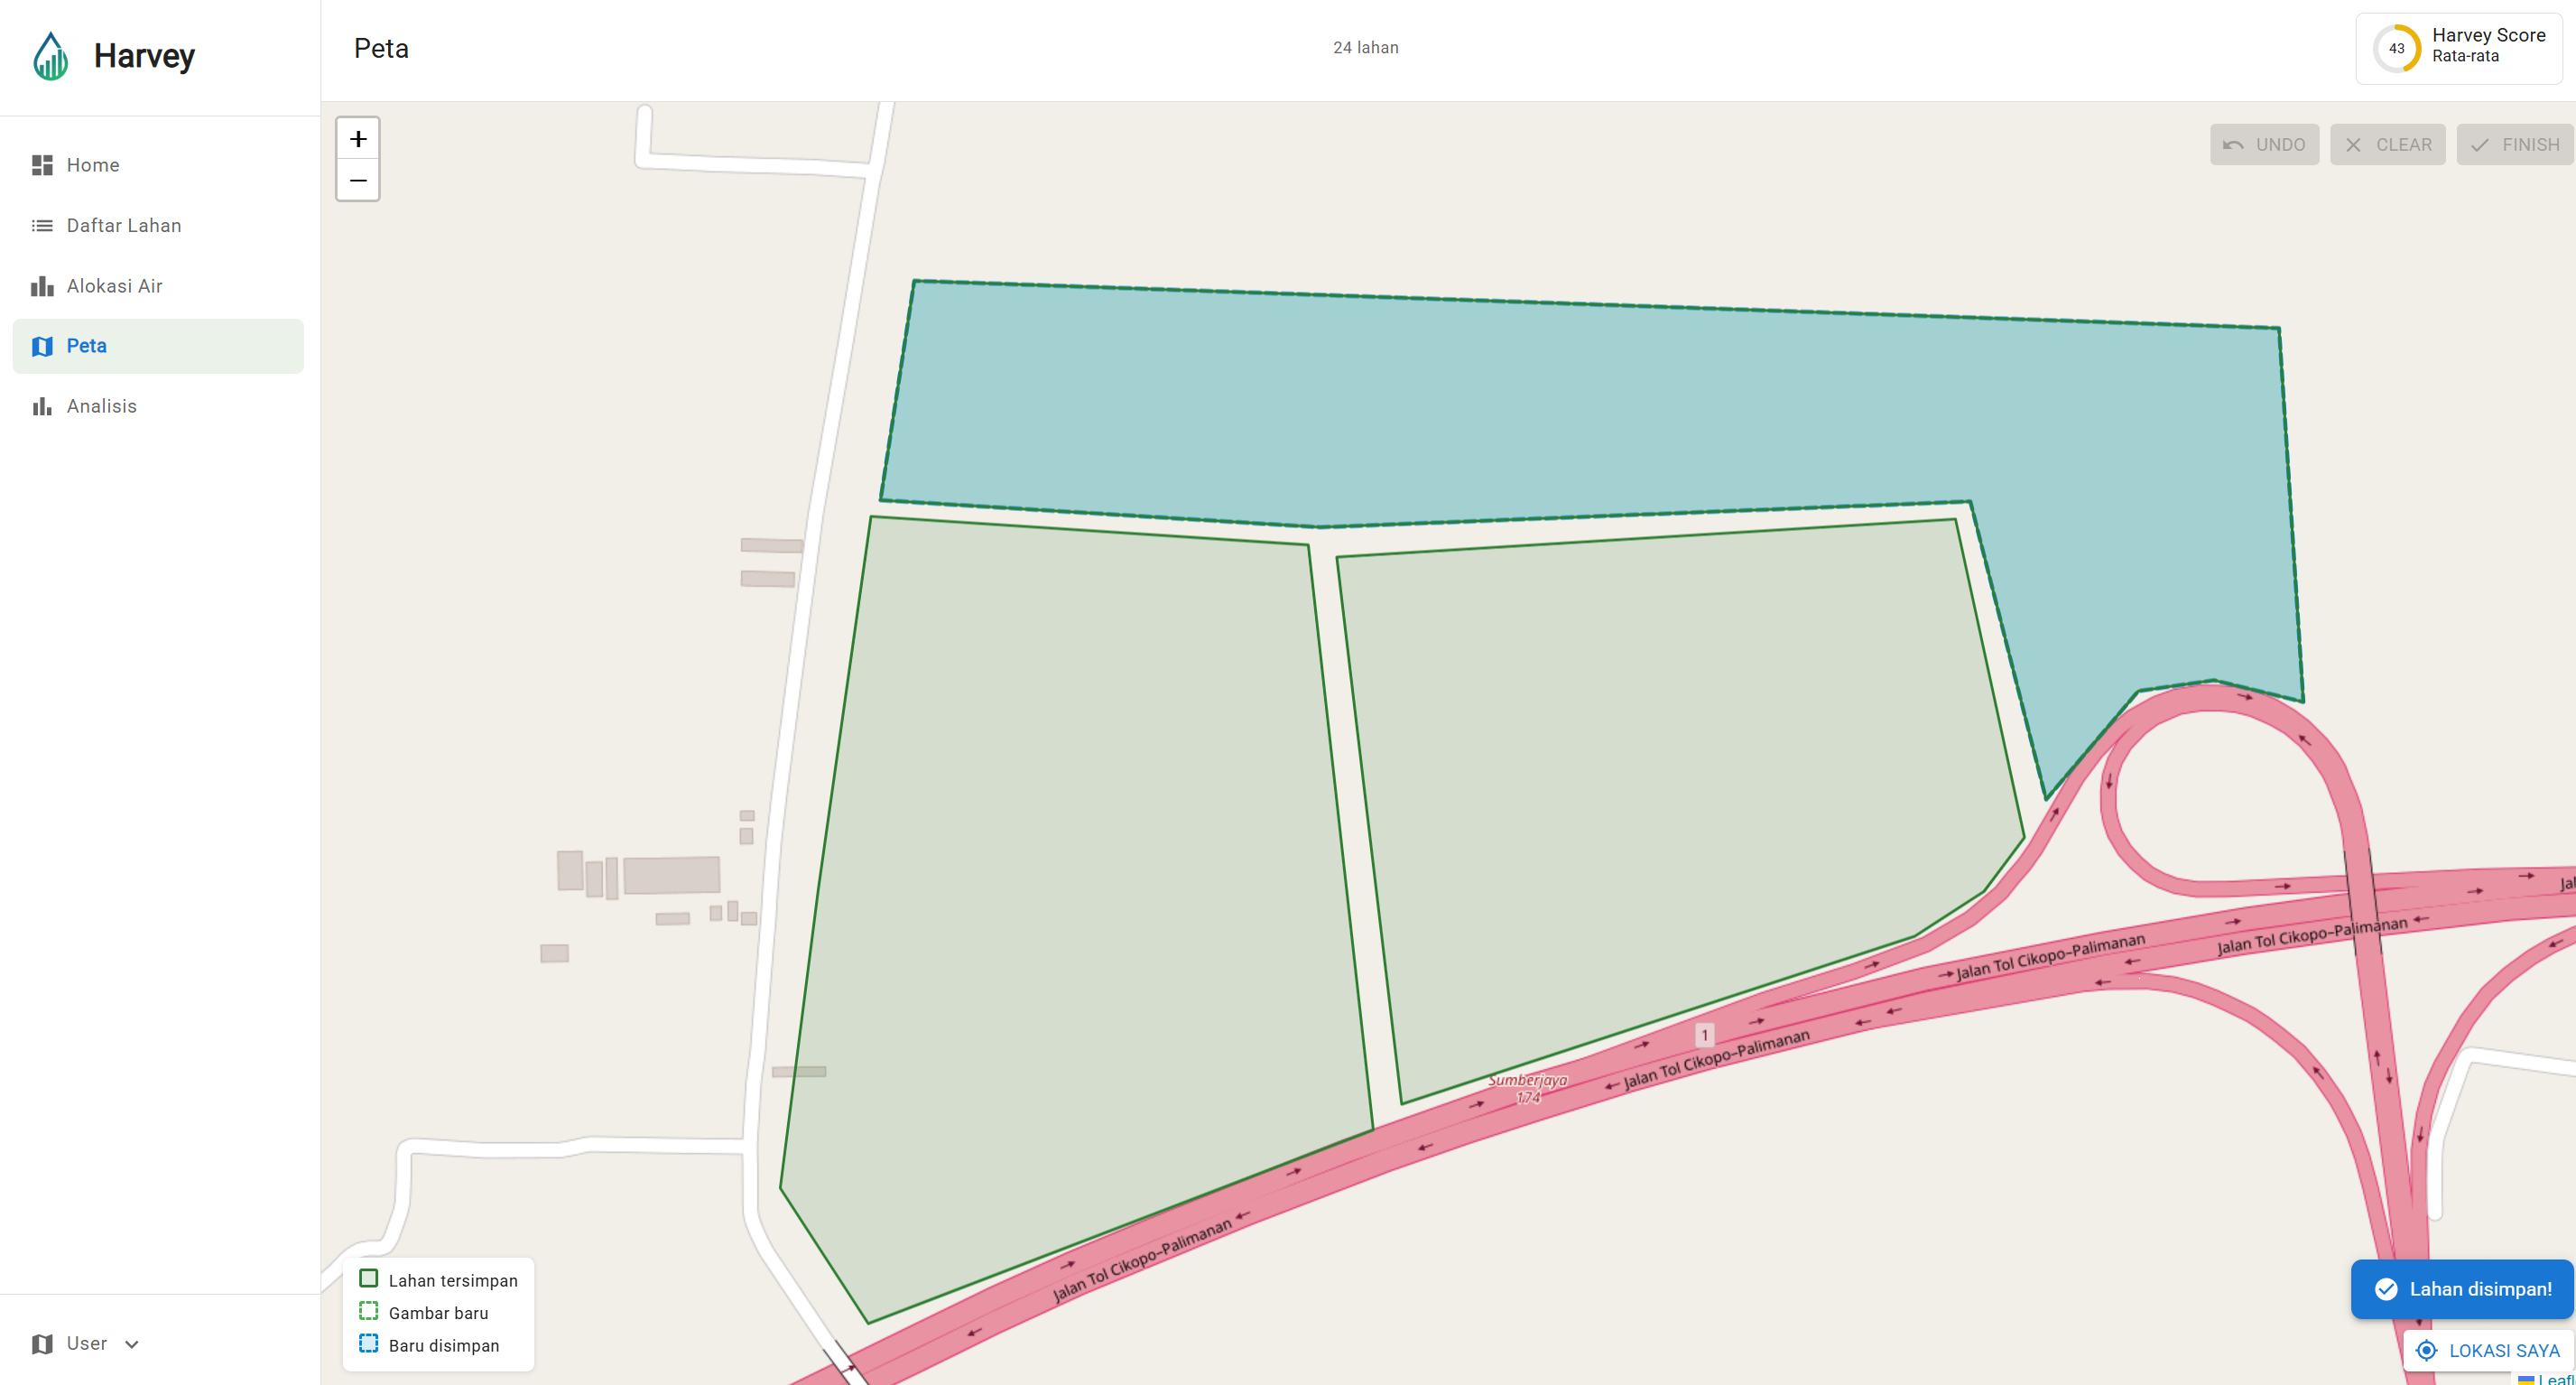
Land Selection
-
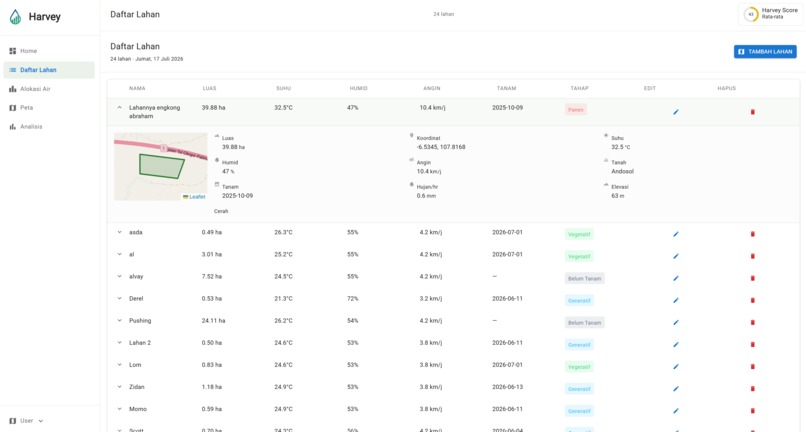
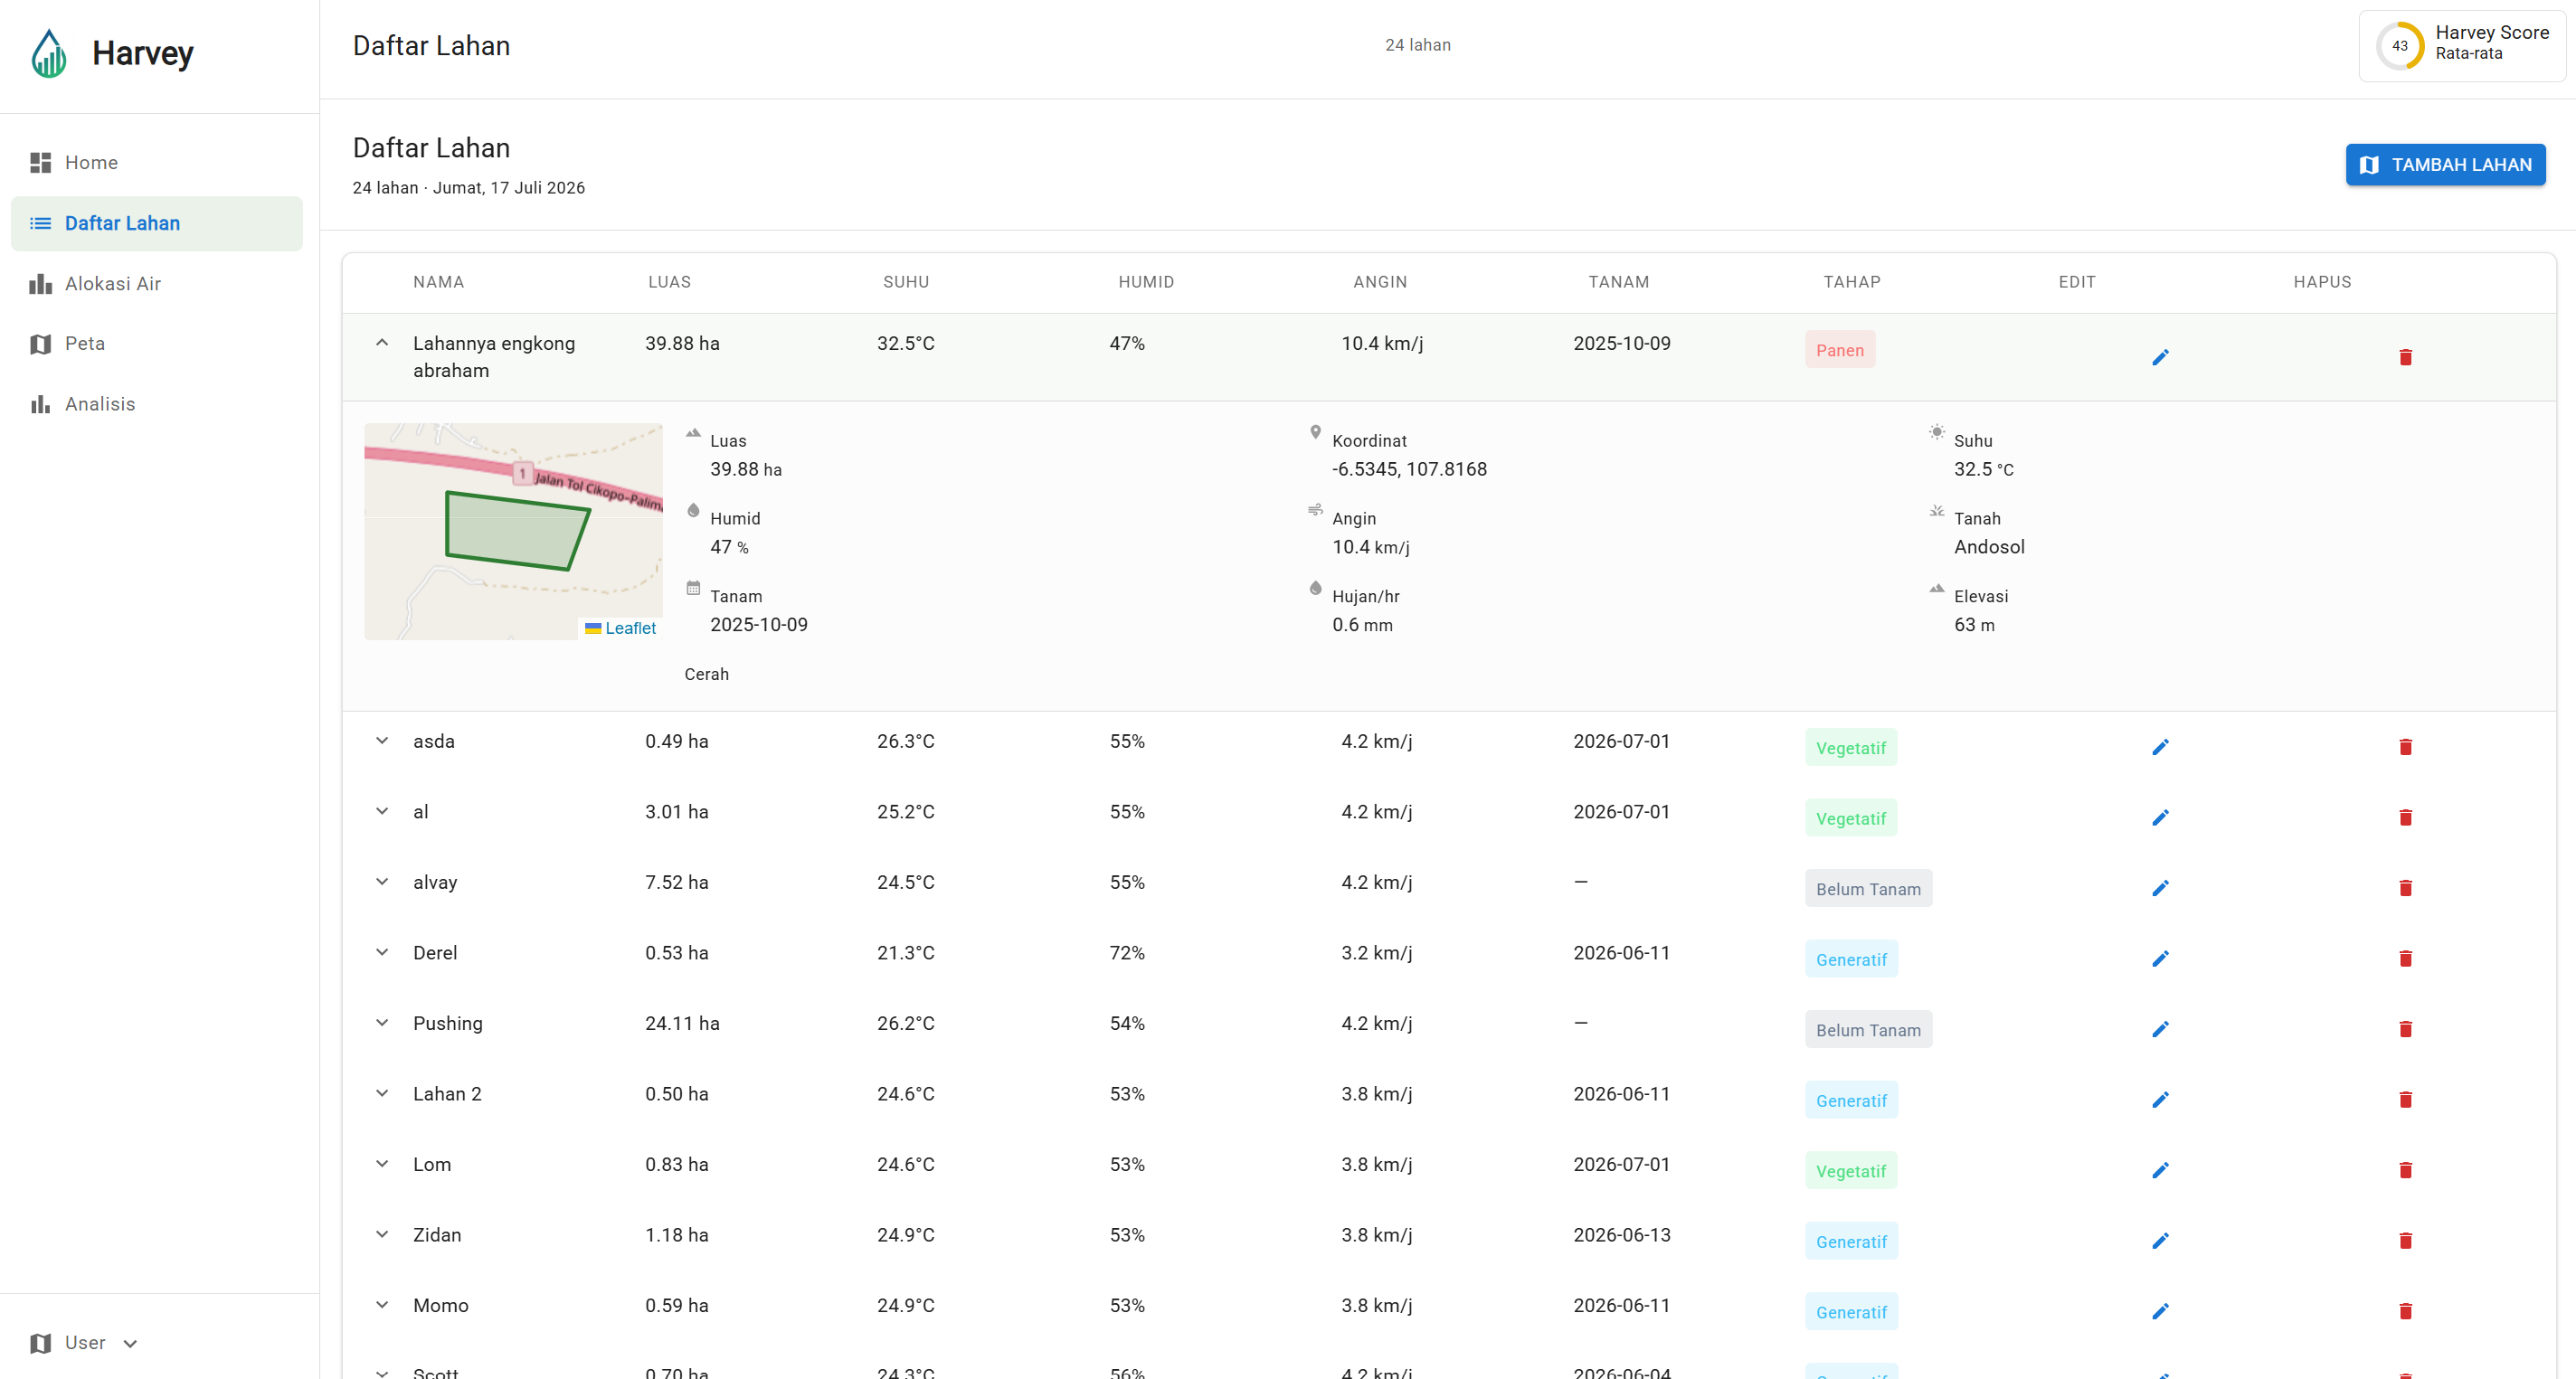
Land Management
-
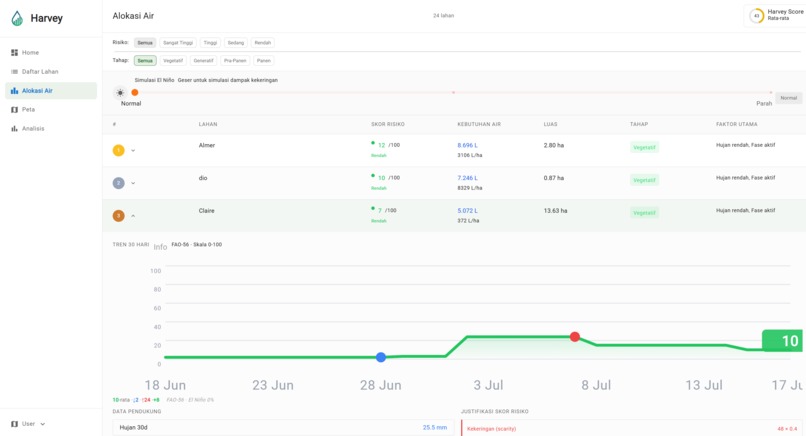
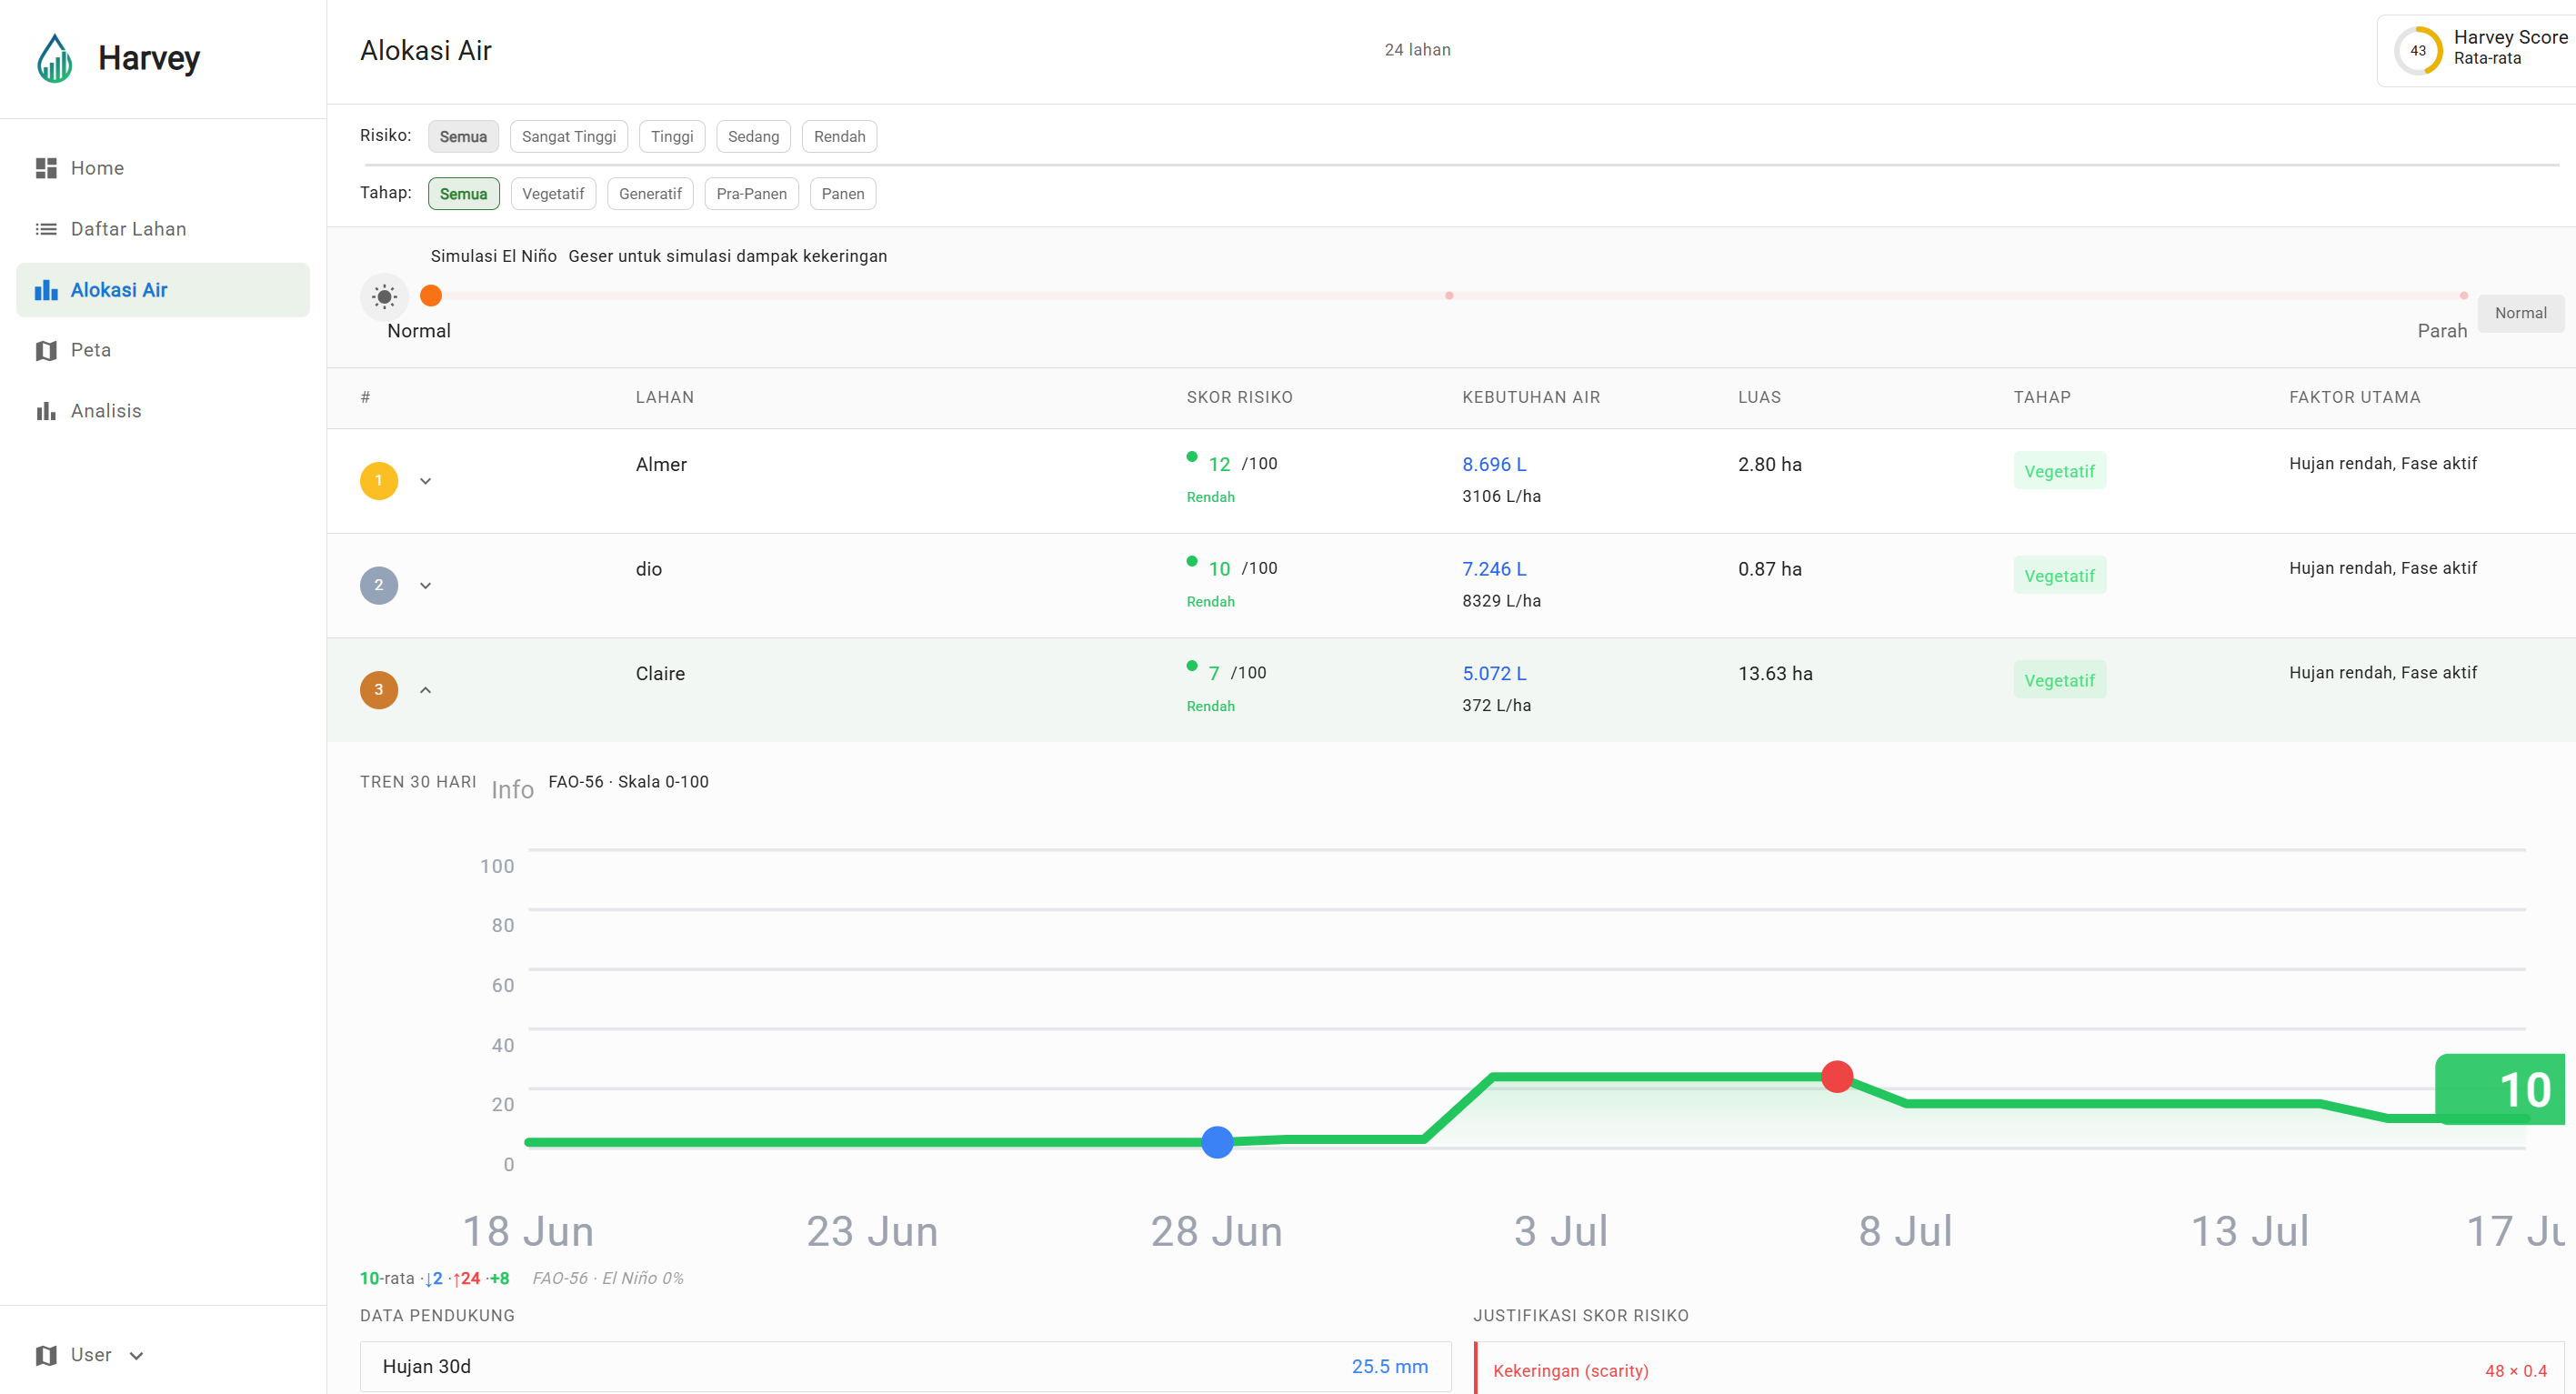
Water Allocation
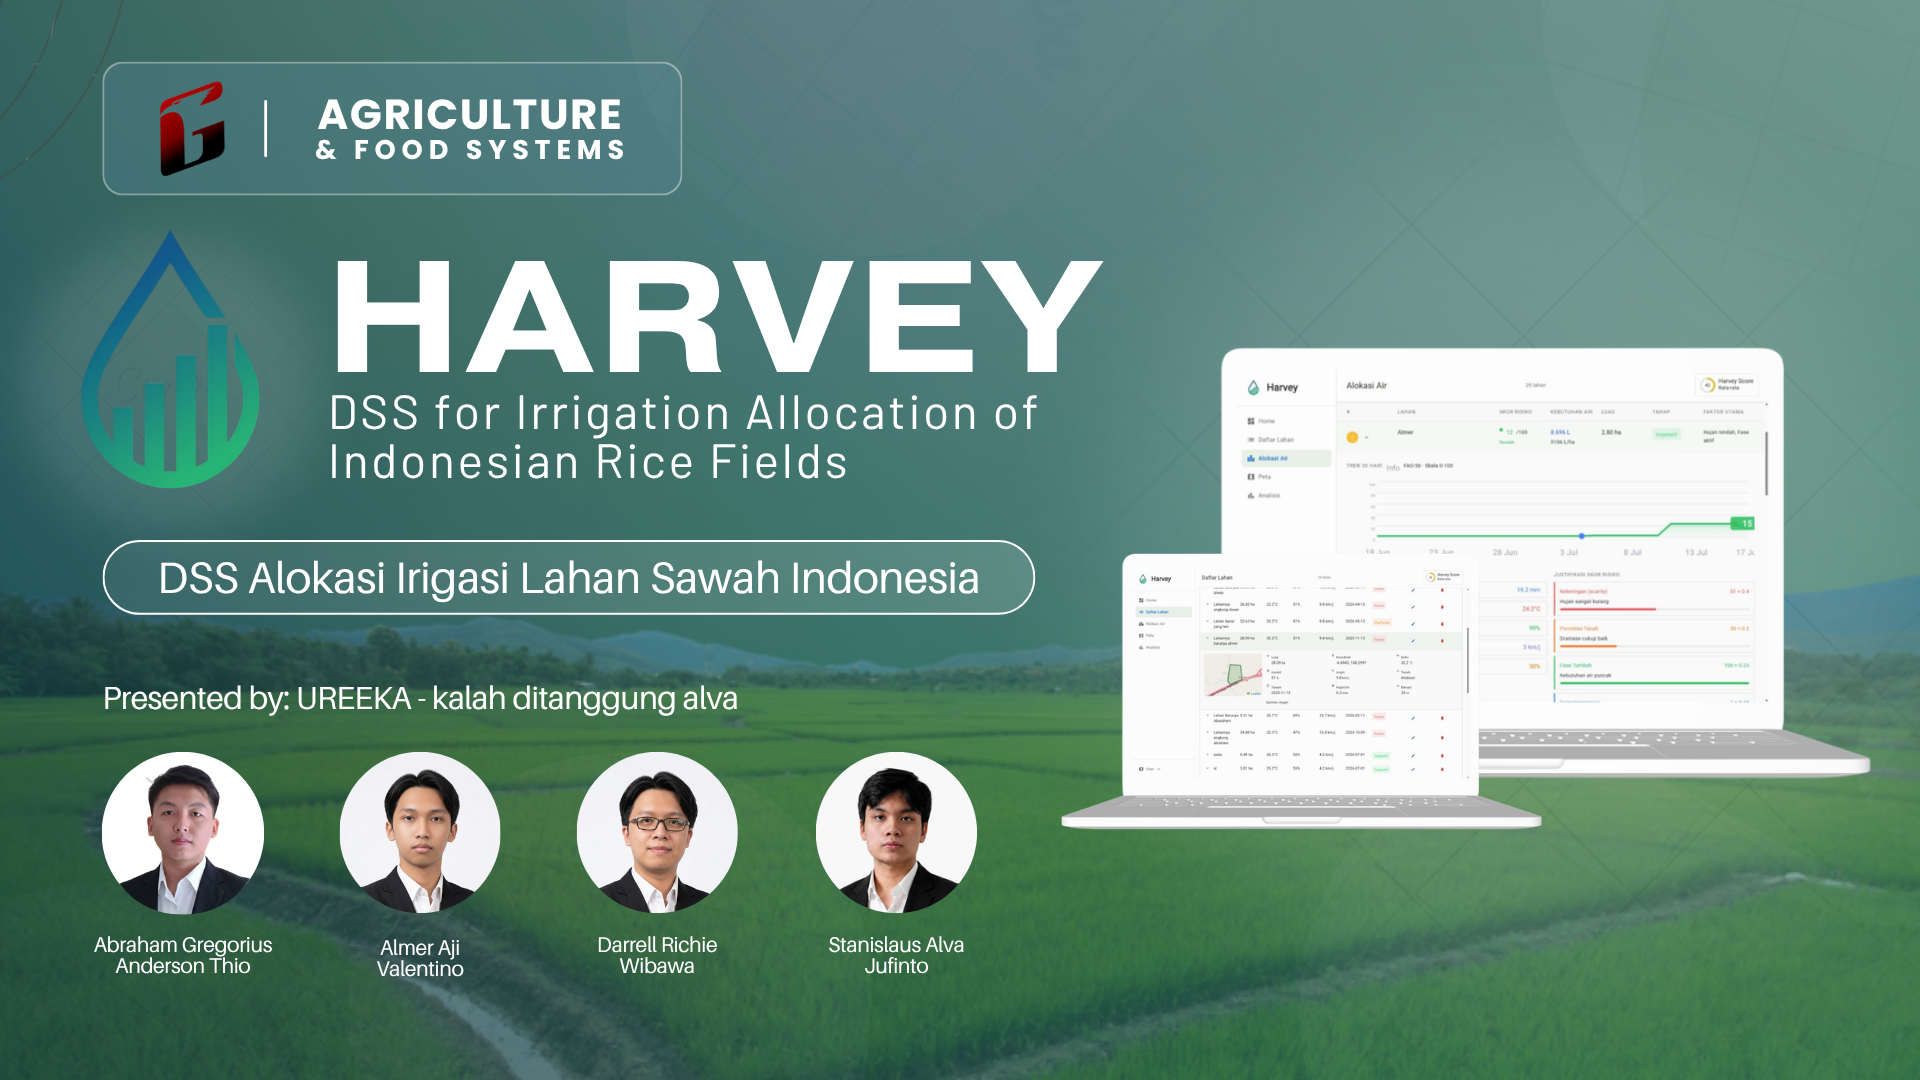
Inspiration
Indonesia has 23+ million farming households. When El Niño struck in 2023–2024, millions of tons of rice production were lost and hundreds of thousands of hectares suffered drought. BMKG projects the strong El Niño will persist through early 2027, with 80%+ of Indonesia receiving below-normal rainfall during July–October 2026, the critical second planting season.
At the P3A (farmer group) level, when water becomes scarce, leaders must decide: which fields get priority? They do this with no predictive data, no structured comparison of risk across their cluster, and no data trail to justify the decision afterward. Existing agri-tech tools serve one farmer, one field. Nobody was building for the group-level decision problem.
"P3A leaders don't need a tool that replaces their decision. They need a tool that gives them information to make a better, defensible decision."
What it does
Harvey is a Decision Support System that helps P3A leaders rank which fields need irrigation water most urgently when supply is limited. It takes a cluster/group perspective, not individual farmer and produces a Priority Ranking based on:
- Weather data (real-time + 5-day forecast)
- Crop growth phase (Vegetatif / Generatif / Pra-Panen / Panen), calculated automatically from planting date
- Soil type and texture (clay/sand/silt percentages)
- 30-day rainfall history
- Land irrigation priority scoring
What we're proud of
- We didn't want to invent a risk formula out of thin air, so the scoring engine is grounded in FAO-56 (Crop Evapotranspiration, Guidelines for Computing Crop Water Requirements), the standard reference the agricultural world already uses for crop water needs. That means it's not just explainable to a jury in plain language. It's also something we can actually defend if someone with an agronomy background pushes back on it. Fields in critical growth phases, with sandy soil and low recent rainfall, genuinely bubble to the top of the ranking, which is exactly what you'd expect if the underlying logic is sound.
- We pulled in remote sensing and GIS data as real inputs, not just decoration, soil texture, geometry (area, centroid, slope via Turf.js), and weather/rainfall layers all feed directly into the risk scores instead of sitting on the side as a map you look at once.
What we learned
- The group-level angle is a genuinely empty niche. Every competitor we looked at optimizes for one farmer, one field. Nobody's solving the "who gets water first" problem at the cluster level, and it's a real problem.
- You don't need sensors to start. Hardware is expensive and slow to roll out. Weather API plus manual soil input got us far enough for a working MVP, and we could build it a lot faster this way.
- The decision history itself might be worth more later than we first thought, risk scores plus a record of what was decided and why is essentially credit data that smallholder farmers have never had. That's a door into parametric insurance and financial access down the line, not something we're solving now, but worth keeping in mind.
Challenges we ran into
- Claude's tokens limit
What's next for Harvey
- Keep a field history per season as a proper decision audit trail
- Add a calendar view for recommended irrigation timing
Built With
- express.js
- gis
- leaflet.js
- react
- supabase
- tailwind
- turf
- vite


Log in or sign up for Devpost to join the conversation.