-
-
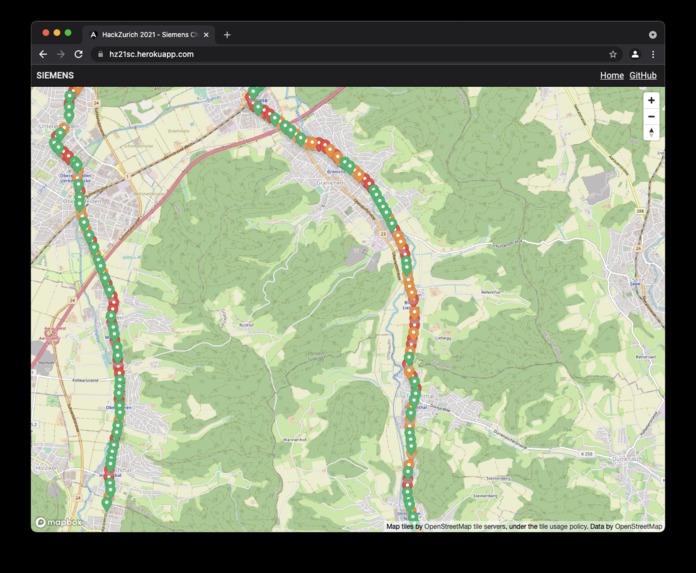
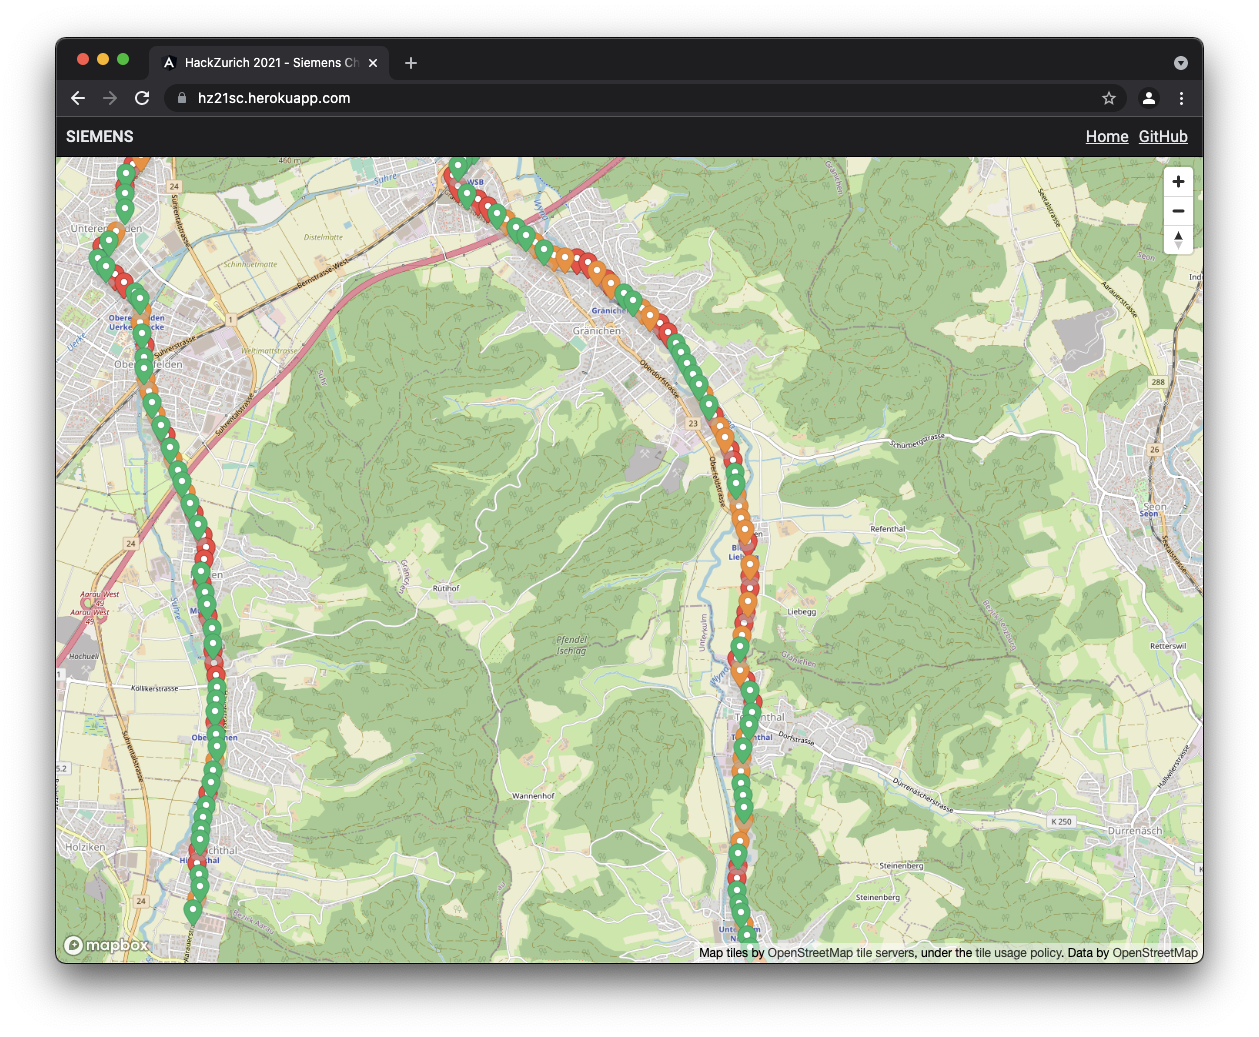
Overview of the track (with forecasted track health indicators)
-
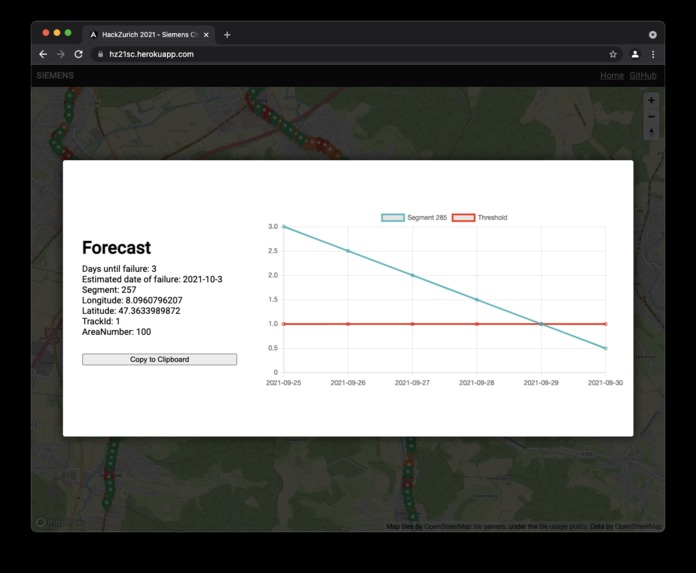
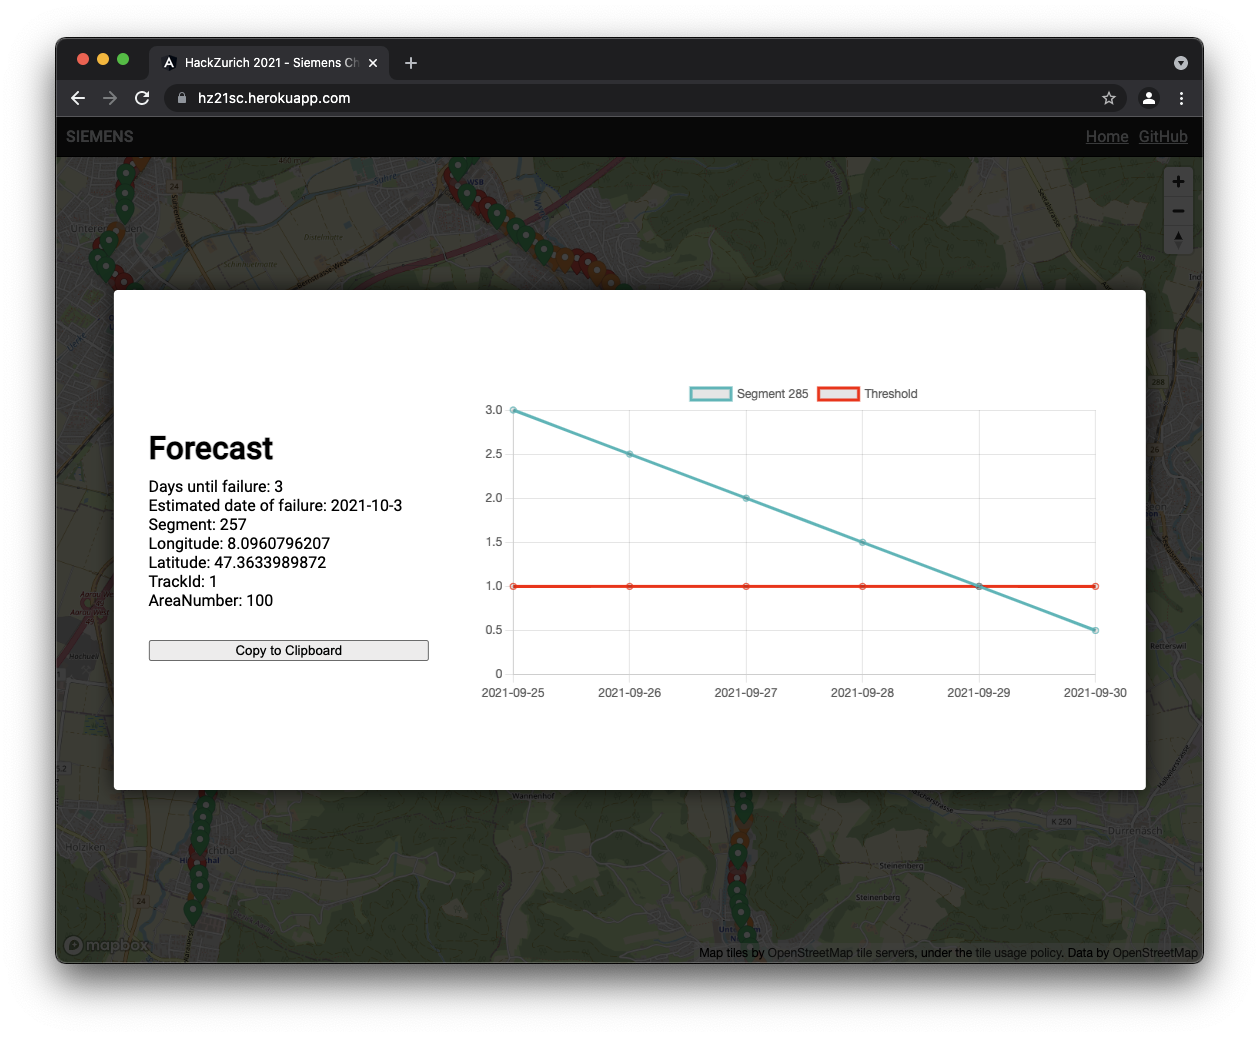
Forecast of a train track segment
-
-
Inspiration
The data received by the protection system are often faulty and this can lead to some serious issues and many lives can be lost in the process. so a system that can forecast the points of failure can help to tackle this issue
What it does
To deal with this issue we have created a system that detects the faulty points that are received by the protection system and displays them on a map such that preventive maintenance can be performed before it is too late.
How we built it
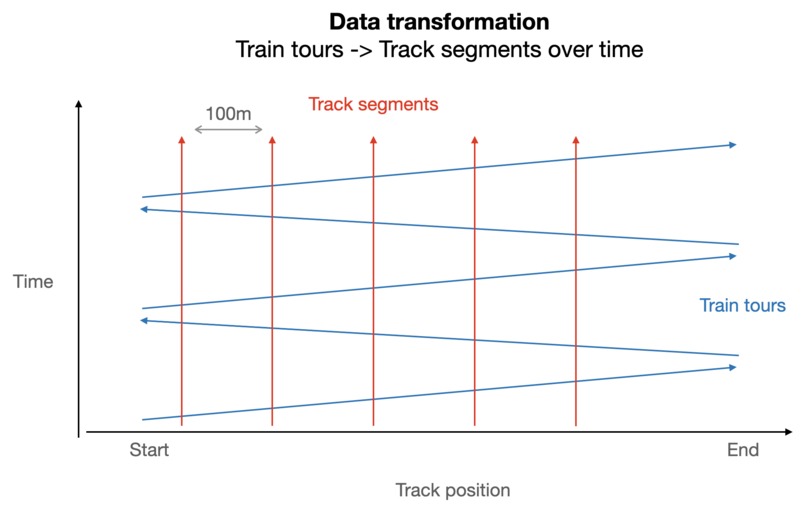
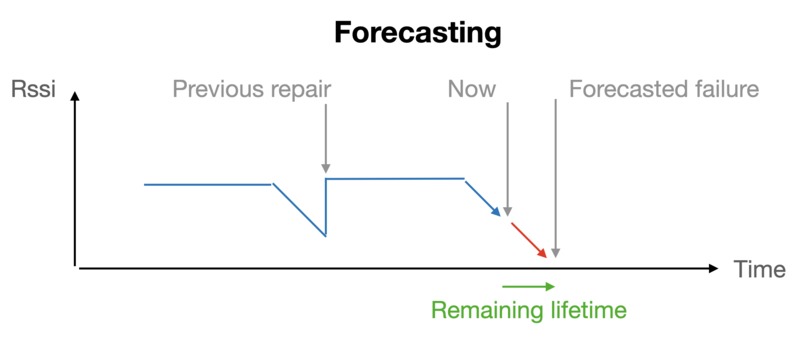
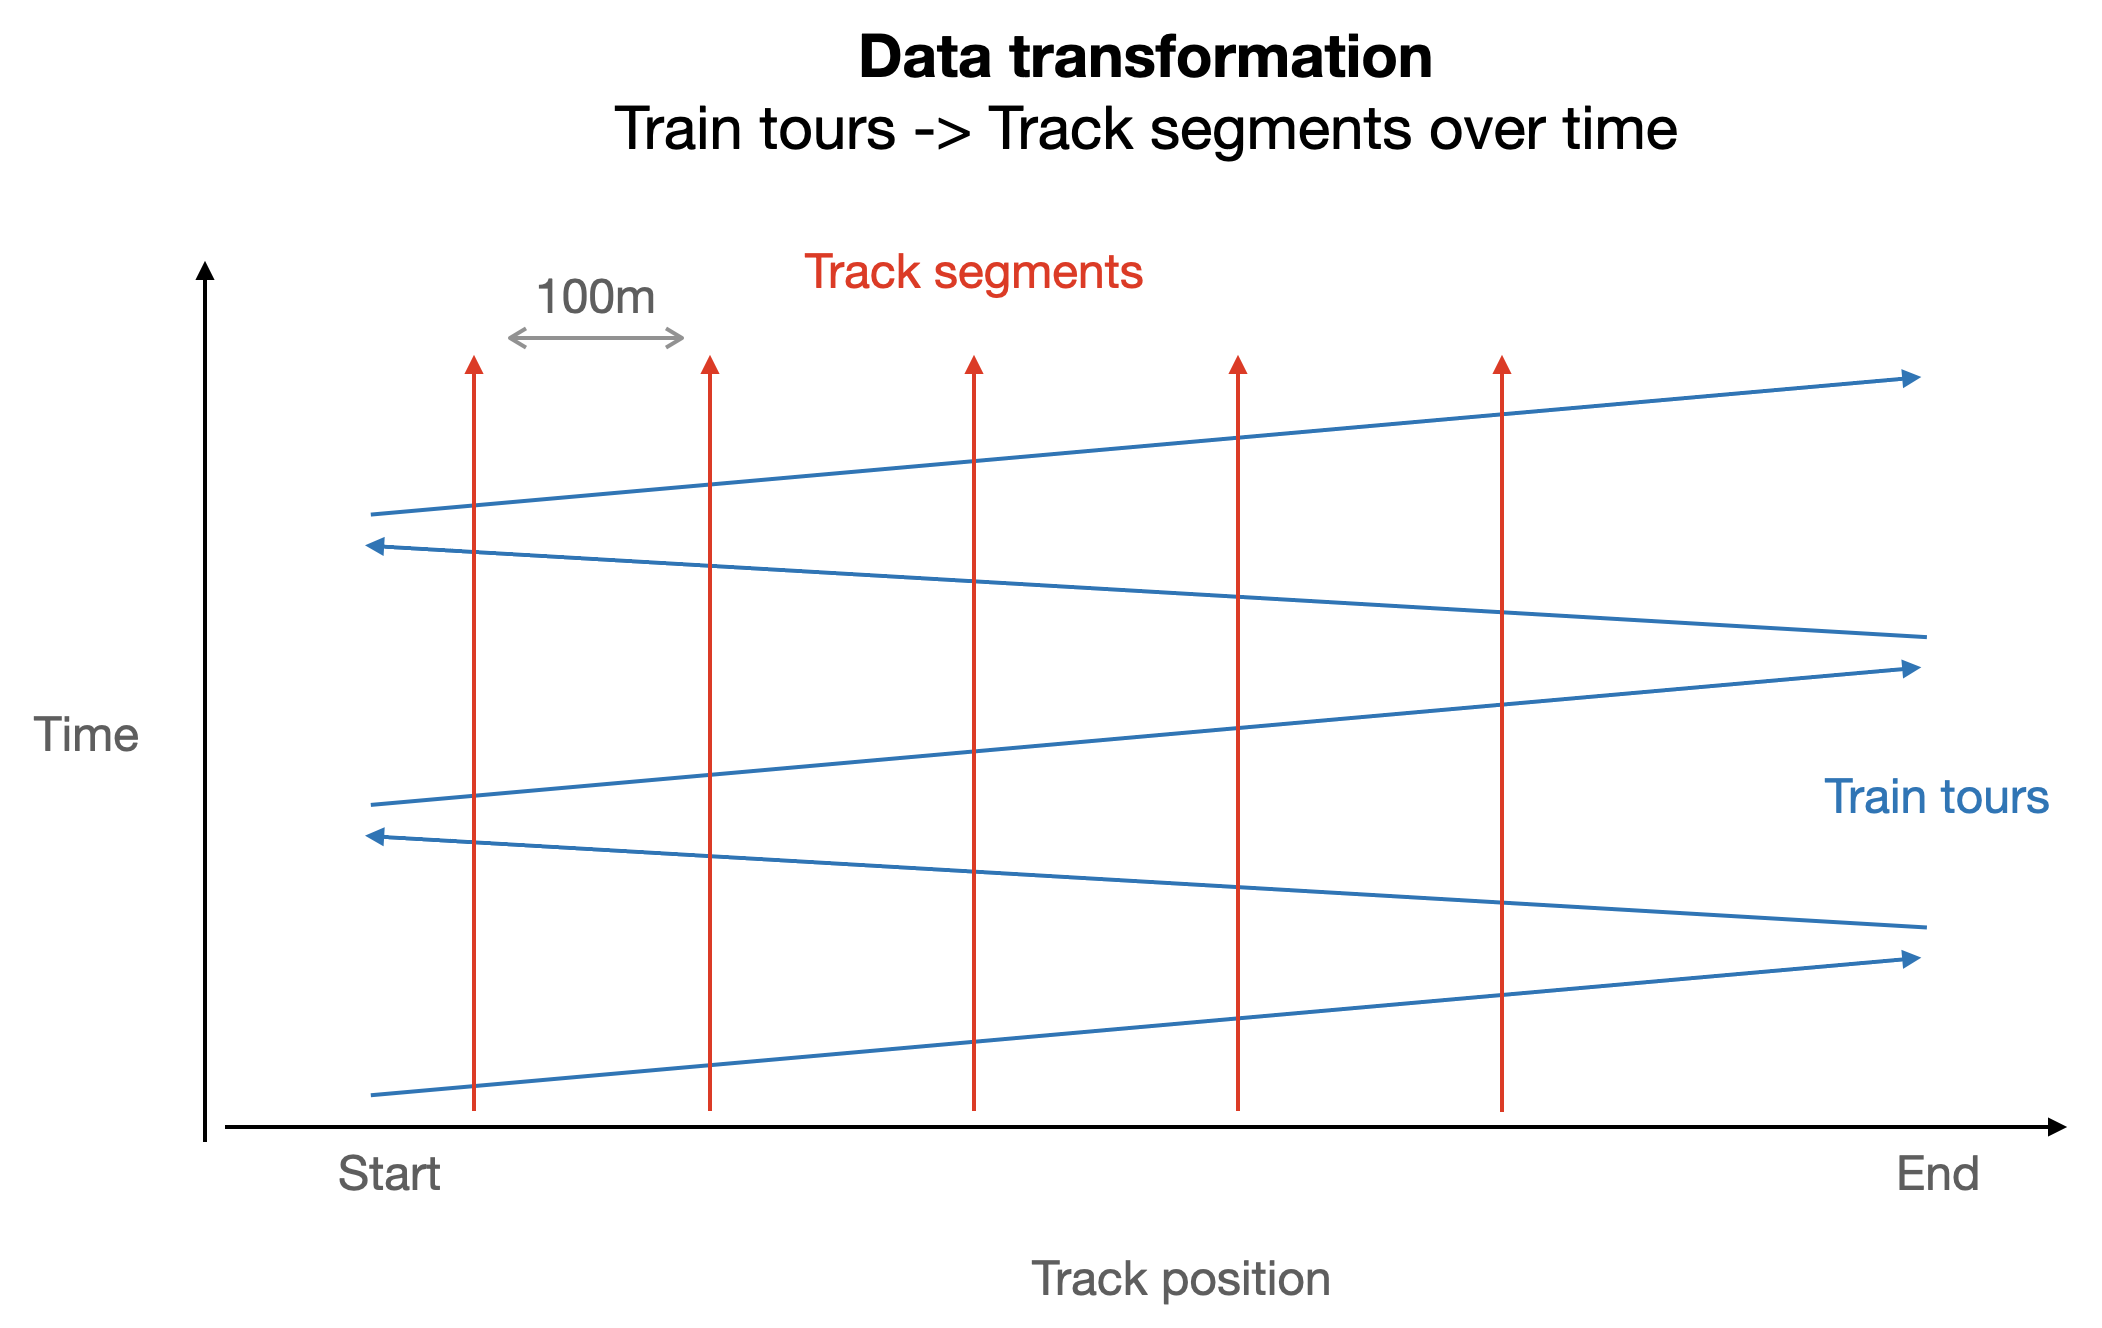
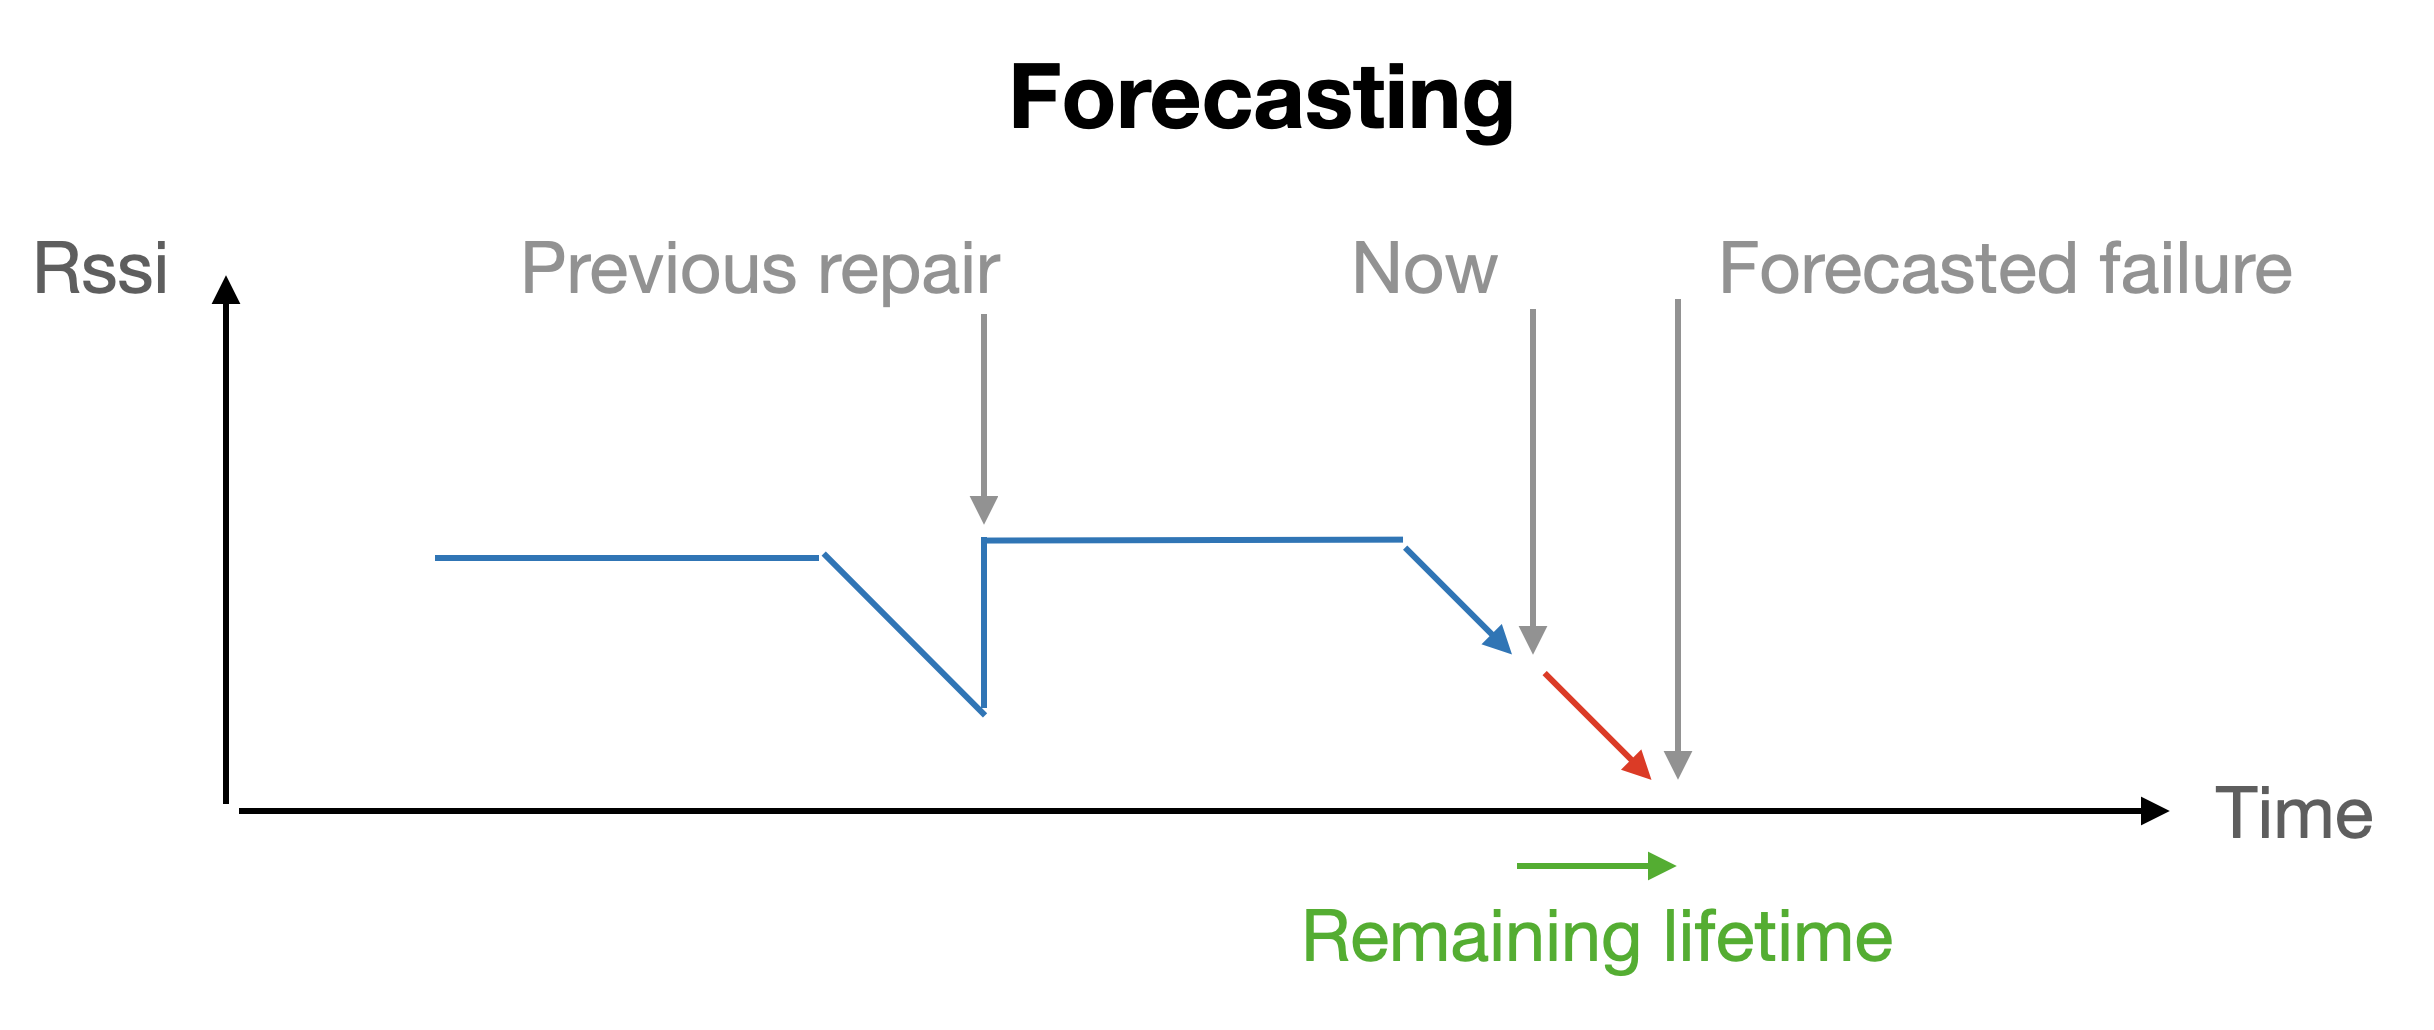
Instead of looking at the data based on train rides, we transformed it into track segments. Because actually, this is what we are interested in. So now we can see how the signals change on each part of the track over time. Based on the data that we had processed we have trained a deep learning model to predict the RSSI values for the next month. from the forecast, we determine if a point is faulty based on a threshold for RSSI and then report the point to the frontend.
What is next for Happy Tracks
After fully connecting all parts of the application together into one smoothly working system, we'd add a review functionality. This allows the maintenance engineer to review the forecasted weak track points and add them to a TODO list of sorts. This would improve the engineer his/her workflow.
Built With
- angular.js
- keras
- matplotlib
- python
- tensorflow
- typescript


Log in or sign up for Devpost to join the conversation.