-
-
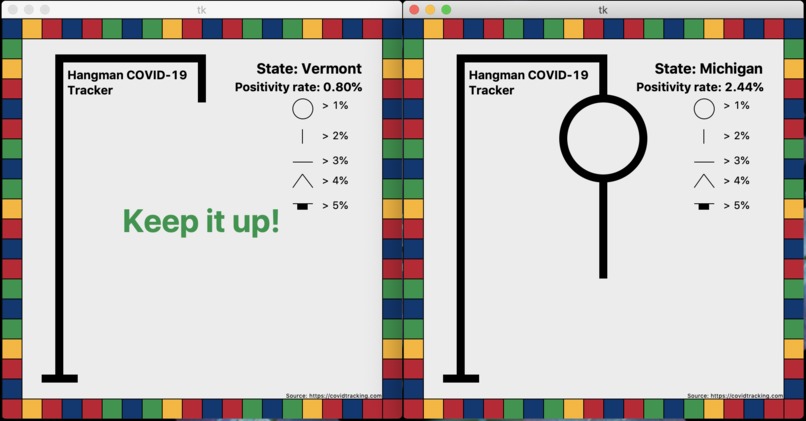
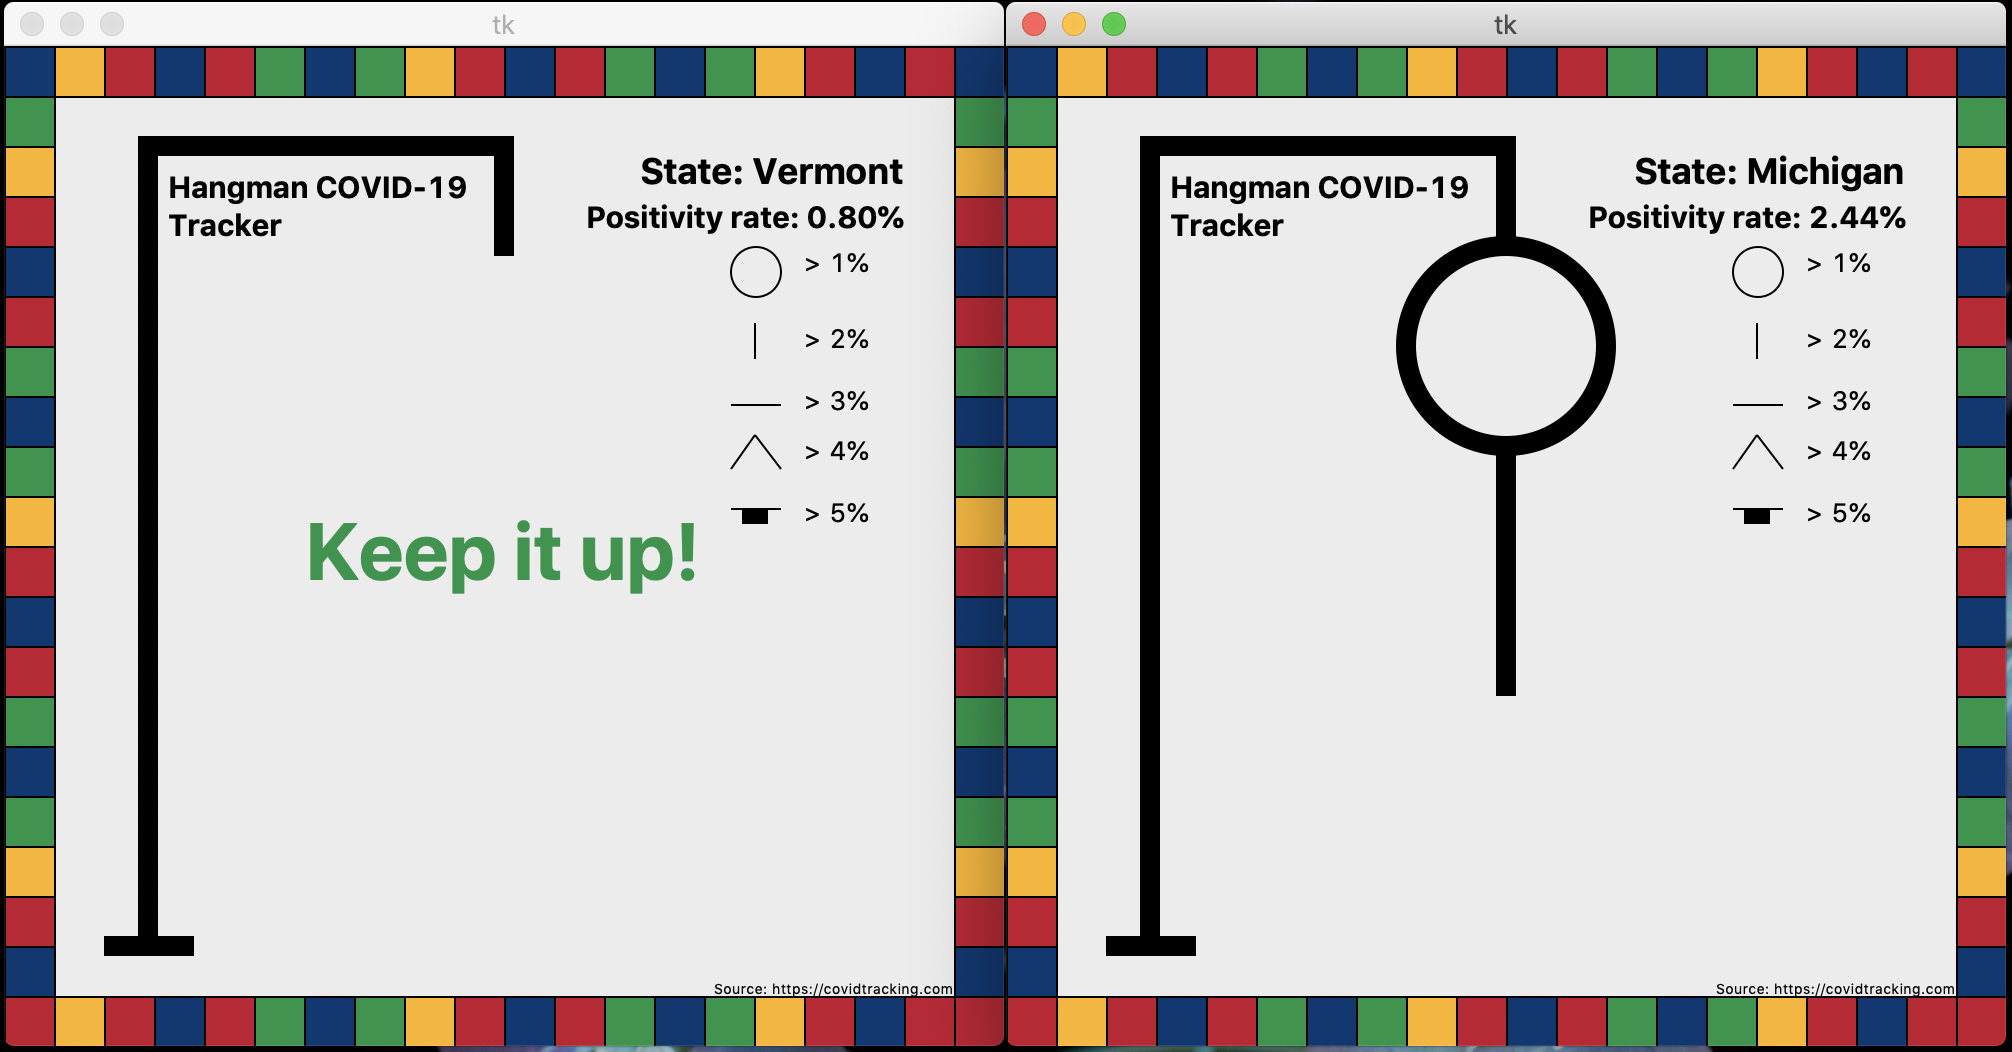
These are lower severity cases, with an encouraging message for percentages below 1%.
-
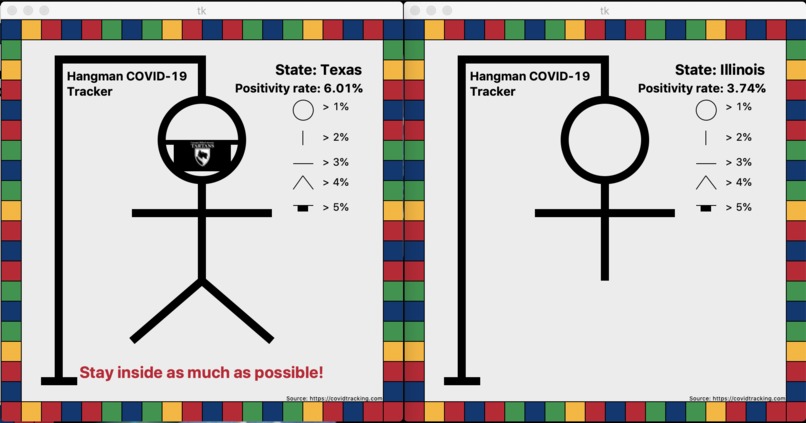
These are some of the more severe cases, including the fully formed figure on the right, and a CMU mask and a caption advising to stay home.
-

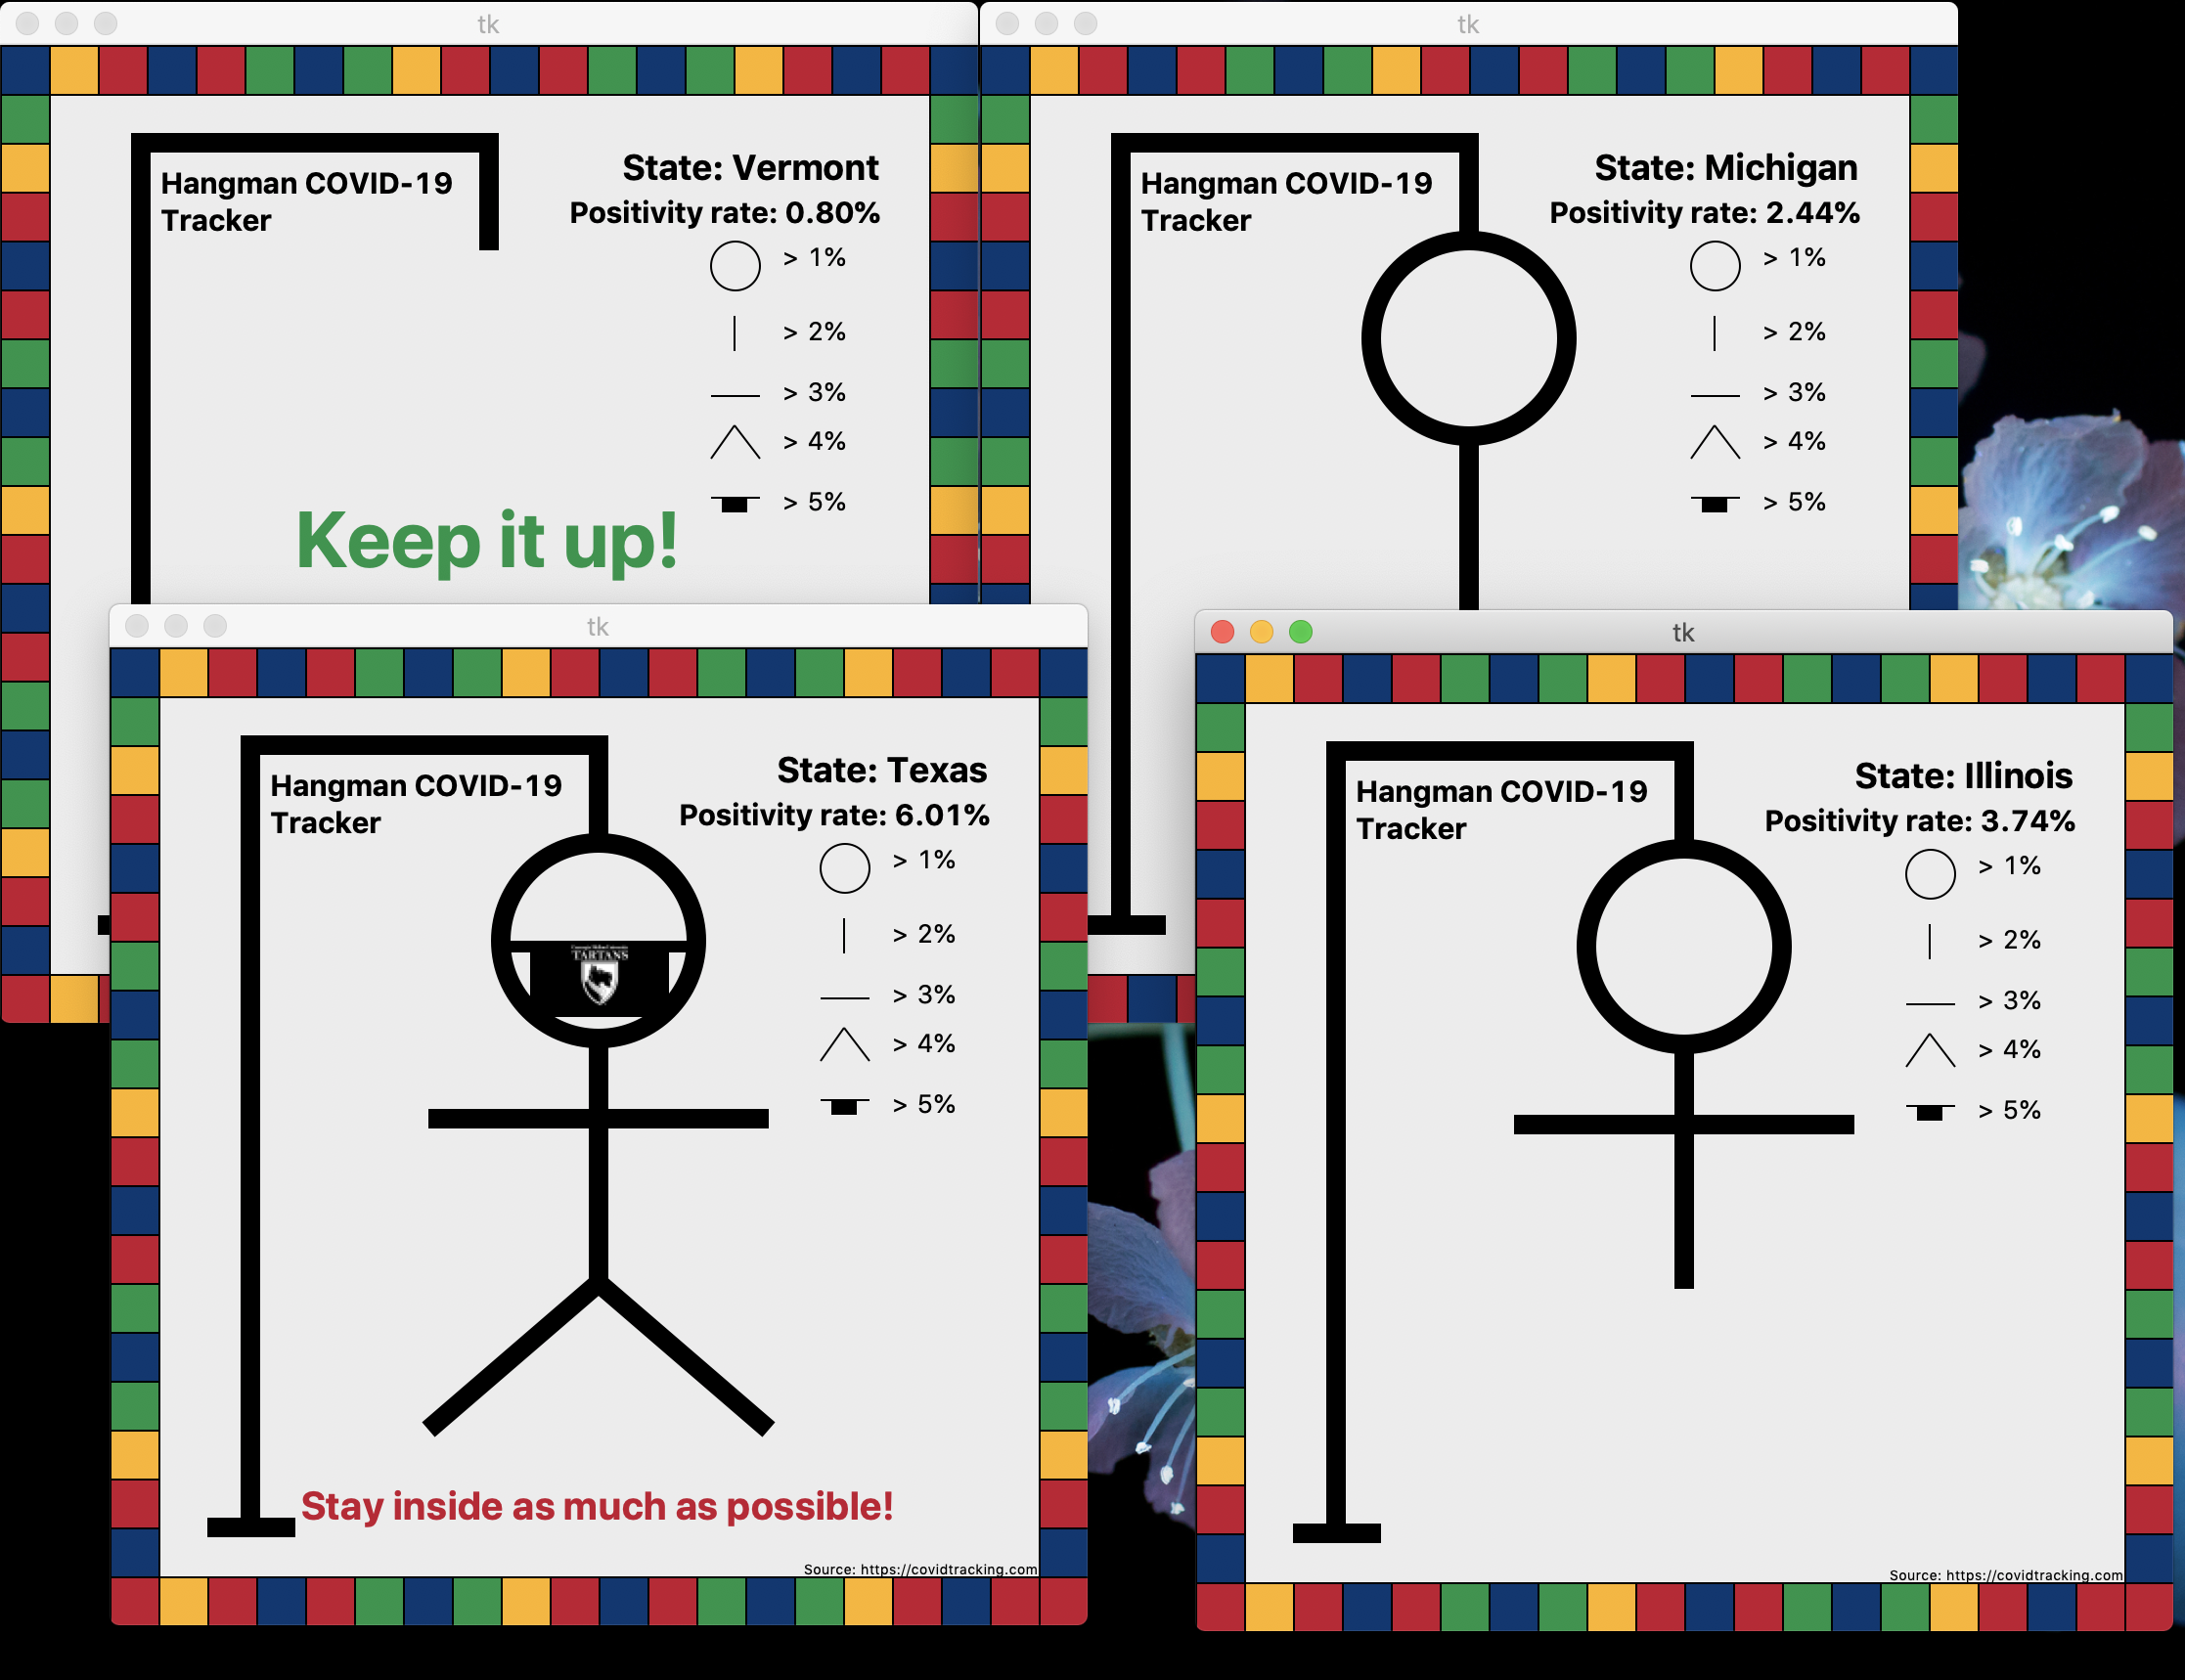
This shows the multiple windows overlapping on the same desktop, for easy comparison of different states.

Inspiration
We were inspired to make this project because we often felt like it was difficult to interpret the various types of ways that each state presented its COVID-19 data. Even when the numbers or graphs were presented, it was always hard to guage what numbers were bad or good. So we wanted to make an app that simplified all of this.
What it does
Our project takes the relative percentage for increase in positive tests compared to the total test increase for each state/U.S. territory. Then it takes the percentage and outputs the tkinter canvas drawing of hangman, each time the percentage increases by 1%, it outputs a new part of the body(ie: 1% --> head, 2% --> body, 3% --> arms, etc.) Once a state reaches 5%, it will have the entire hangman body and presents a message telling you to continue efforts to stay home as much as possible and continue social distancing.
How we built it
We built this using python and tkinter graphics. We started by defining functions that created each portion of the canvas image. Then we defined one large function, drawHangman, that included a library of the state abbreviations to state names, calls all the individual functions, and uses if statements to compare the percentages to what needs to be included in the output.
Challenges we ran into
Some of the challenges that we ran into were through learning new ways to use python. For example, we had to learn how to pull data from online sources to get the percentages, and we also had trouble figuring out how to upload an image into the tkinter canvas so that we could represent Carnegie Mellon Tartans on the mask of the body. Another challenge we ran into was trying to make a prompt text box to input which state you wanted the data for, in the end we decided that it was too much work and not worth our time to implement it into the project.
Accomplishments that we're proud of
It was a great experience to be able to implement skills that we were learning in our introductory cs courses into real world problems. We are very proud of our new skills using graphics through tkinter :))
What we learned
We learned more about coding with tkinter and how to use the requests module to grab data from the internet.
What's next for our Hangman COVID-19 Tracker
Ideally we would scale this out to other countries, have more data sources and move the input from the terminal to a message box or something.


Log in or sign up for Devpost to join the conversation.