
Inspiration
The musical Hamilton swept not only 11 Tony Awards, but also the hearts of millions over the world, including those of our team members. You may not be able to shell out thousands of dollars for a two-hour stay at the Richard Rodgers Theater (and if you are, it never hurts to learn more), so our group is bringing the musical experience directly to your computer screens with Hamilyze!
What it Does
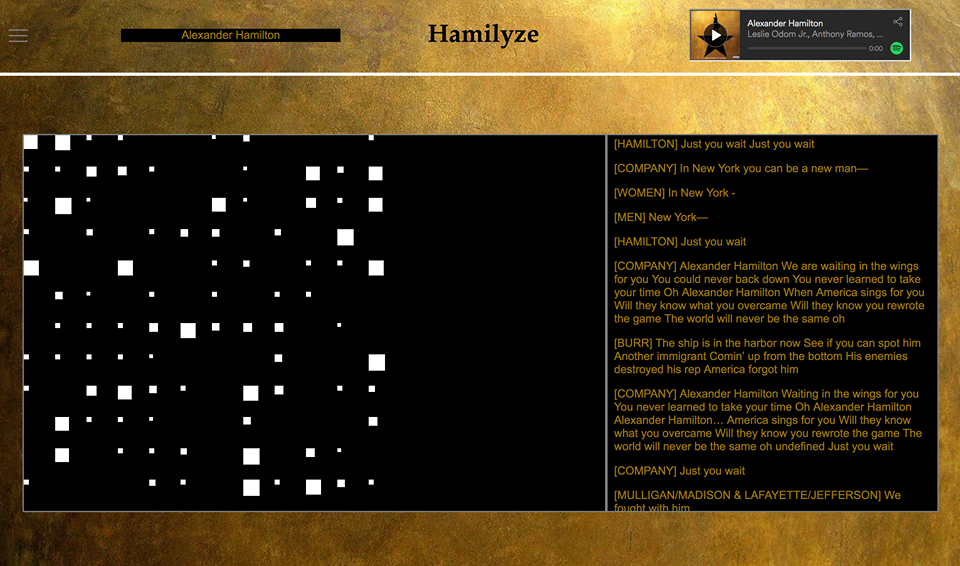
Hamilyze is an interactive musical experience made possible through data visualization! Users can choose from their favorite Hamilton songs to listen to while they browse its lyrics and are treated to an animated display of visualized trends in lyrical data. The application finds motifs throughout all songs from the soundtrack and displays their frequency and presence in the song, meeting our initial standard for design; however, there remains much room for growth in the future through machine learning with sentiment, in which we anticipate our program can identify emotional connections to the lyrics and explain them to the listener, or rhyme scheme, for which our program will be able to learn standard sentence structure and rhyming in order to take user input and rephrase it into a rap lyric with a similar meaning.
How We Built It
We built Hamilyze as a web application using React.js, JavaScript, HTML5, and CSS3. Data analysis programs were scripted primarily in Python while animations used Svg.js, a lightweight library for manipulating Scalable Vector Graphics (SVG). A Spotify play button was also installed through the use of the Spotify API.
Challenges we ran into
It was the first time most of our team had built anything using JavaScript and data visualization programs have a steep learning curve, but we were successful!

 Huang")


Log in or sign up for Devpost to join the conversation.