-
-
Forecast
-
Methodology
-
Validation
-
Scenarios
-
Buildings
-
Copilot
-
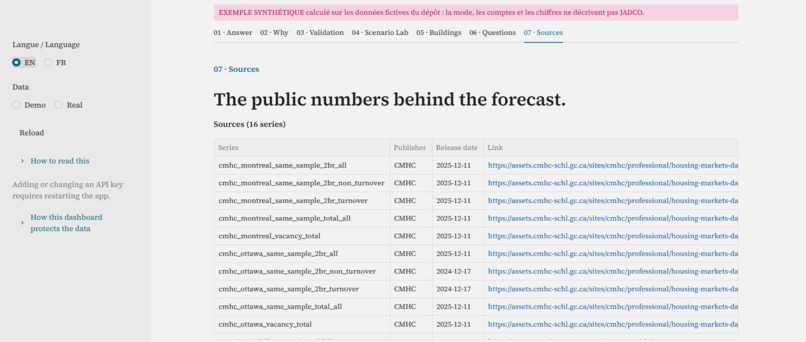
Sources
Inspiration
A rent forecast is more than a percentage. It shapes budgets, expectations, and decisions that people have to live with.
JADCO asked us a simple question: How much will Collection Équinoxe’s rents rise in 2026? But their brief revealed a problem. The yearly median had jumped 10.8% in 2023, even though that increase “didn’t really happen.” New premium buildings had entered the portfolio, making it look as though rents had risen much more than they actually had.
That became our motivation. We wanted to give JADCO a forecast they could understand, question, and confidently use. A forecast that reflects what tenants actually pay, compares the same homes over time, and respects the different rent rules in Québec and Ontario.
What it does
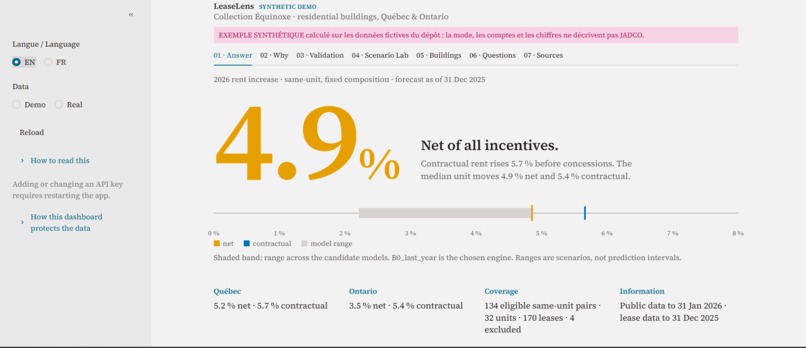
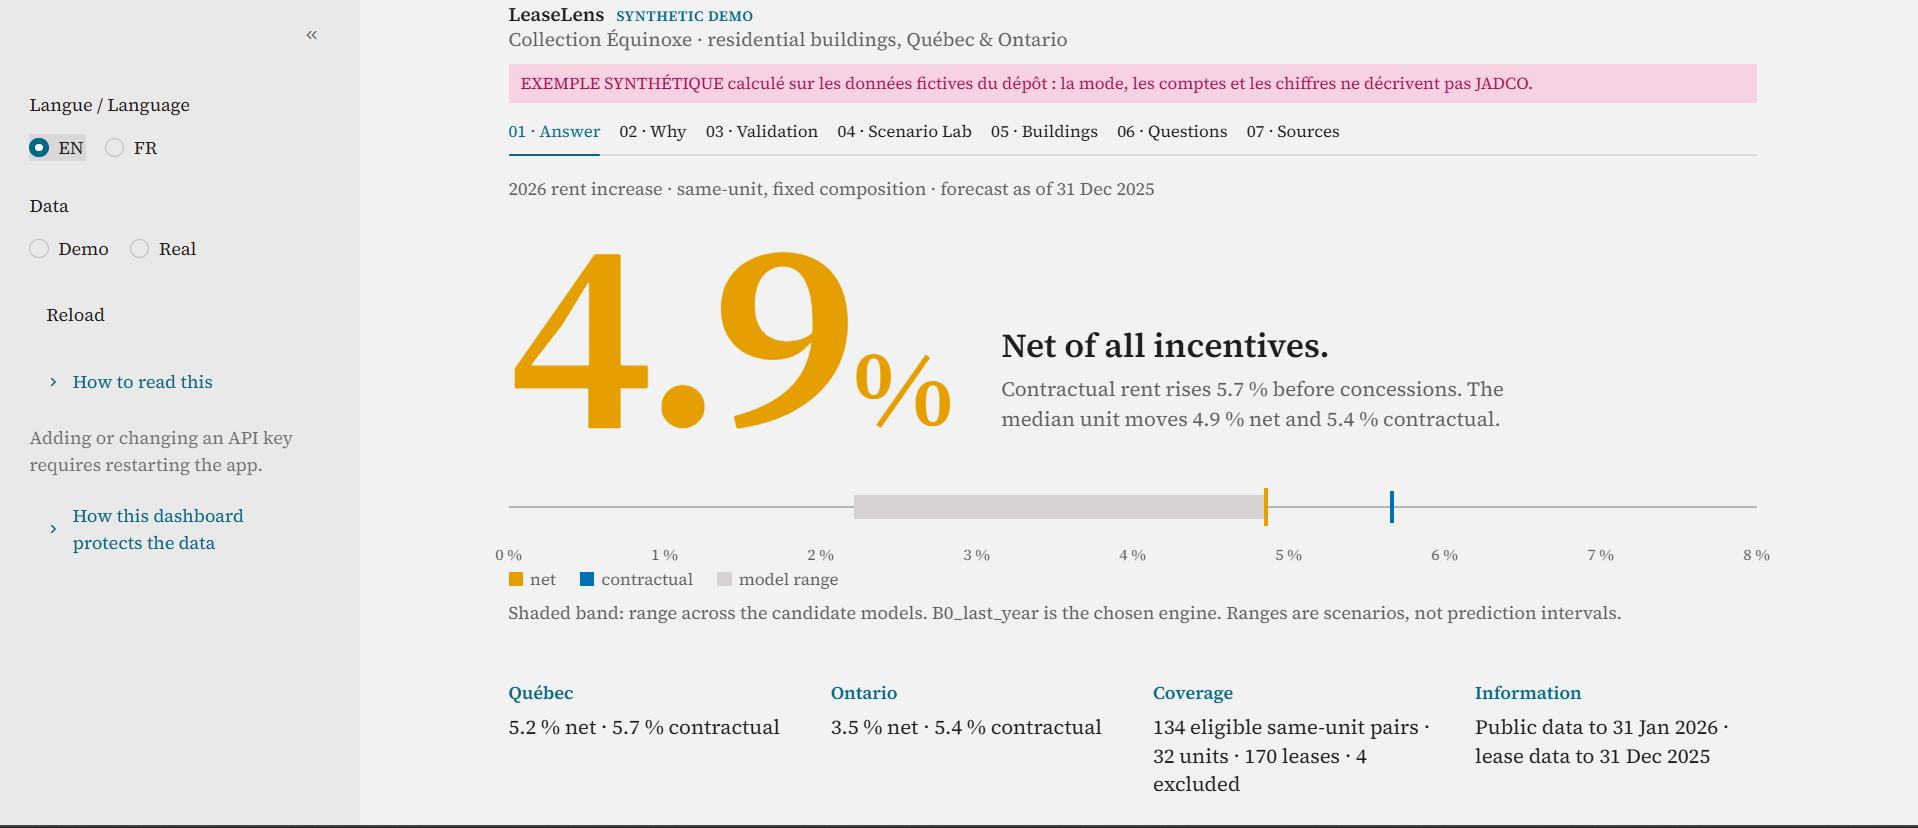
HaloLens helps JADCO see the real rent increase behind the headline number. Our central estimate is a 3.7% increase for 2026, after accounting for incentives, across Collection Équinoxe’s six buildings.
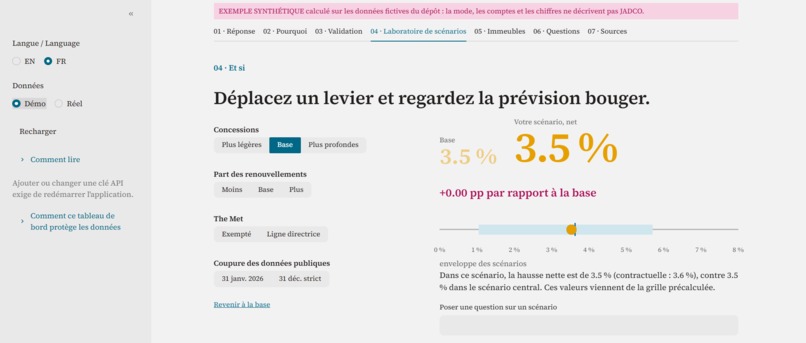
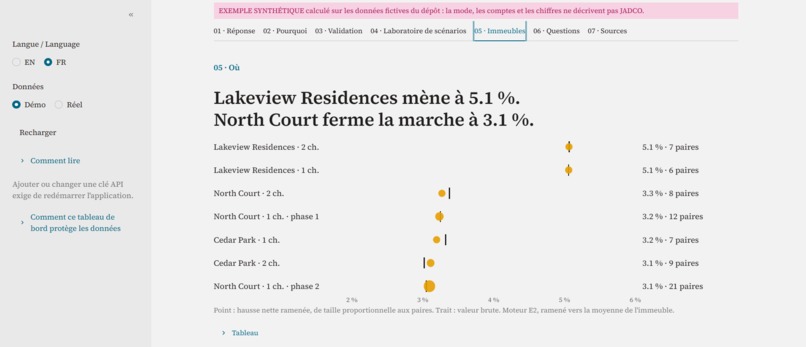
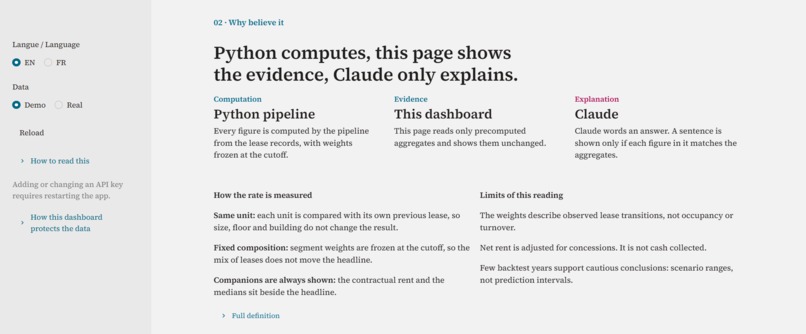
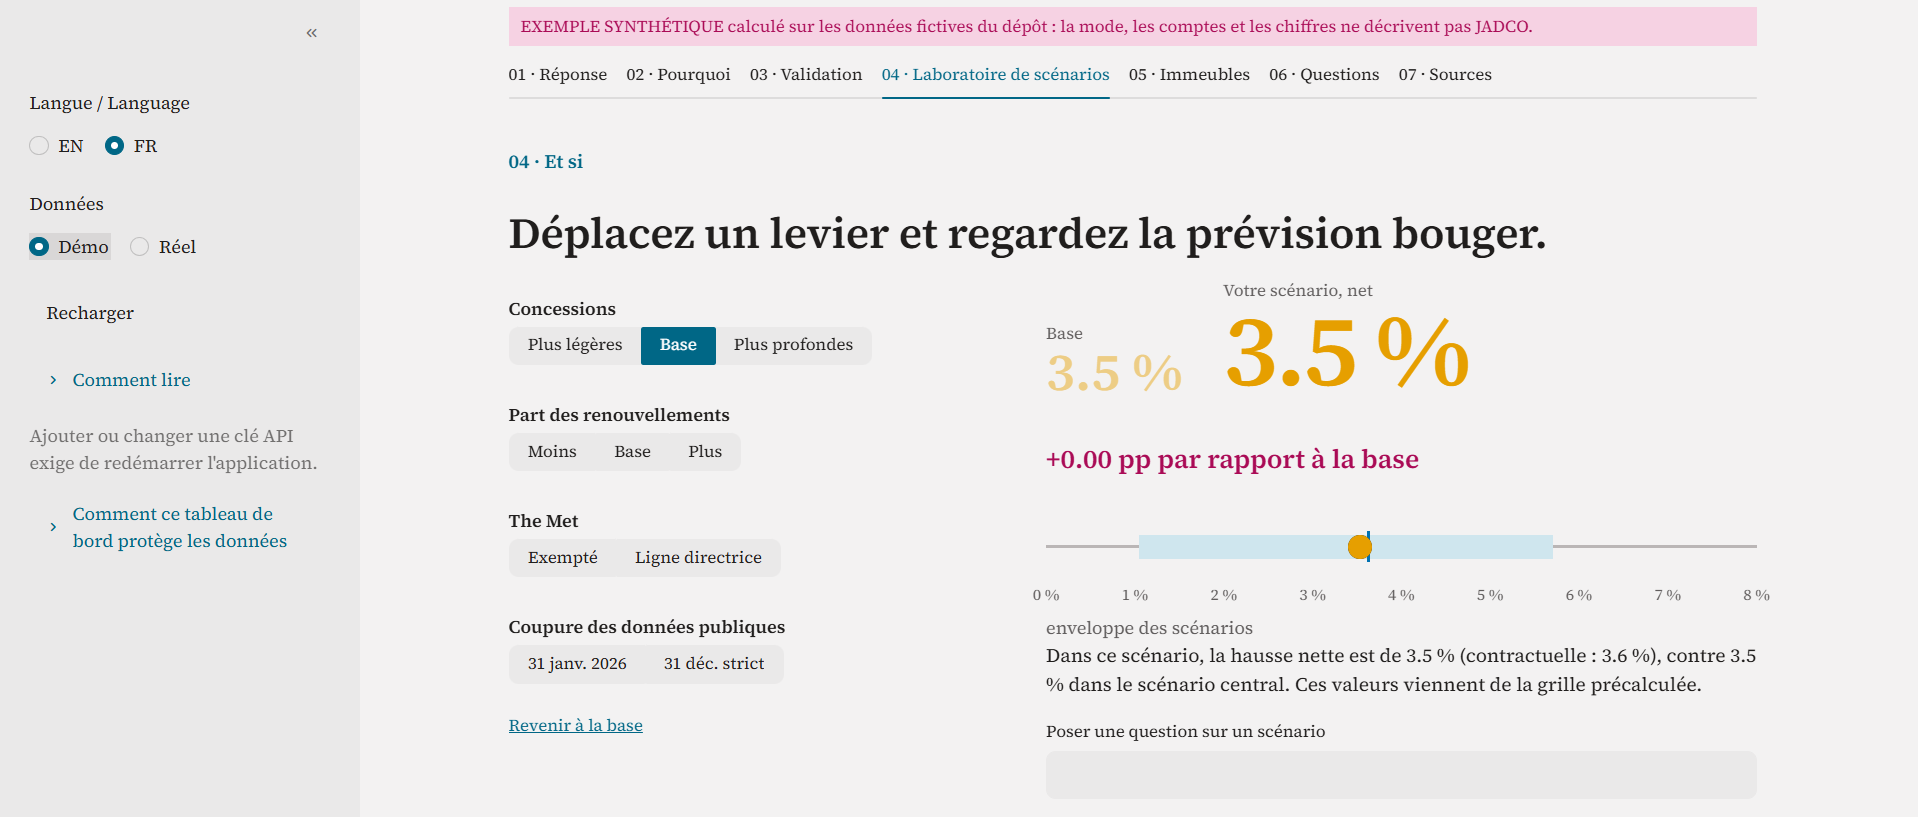
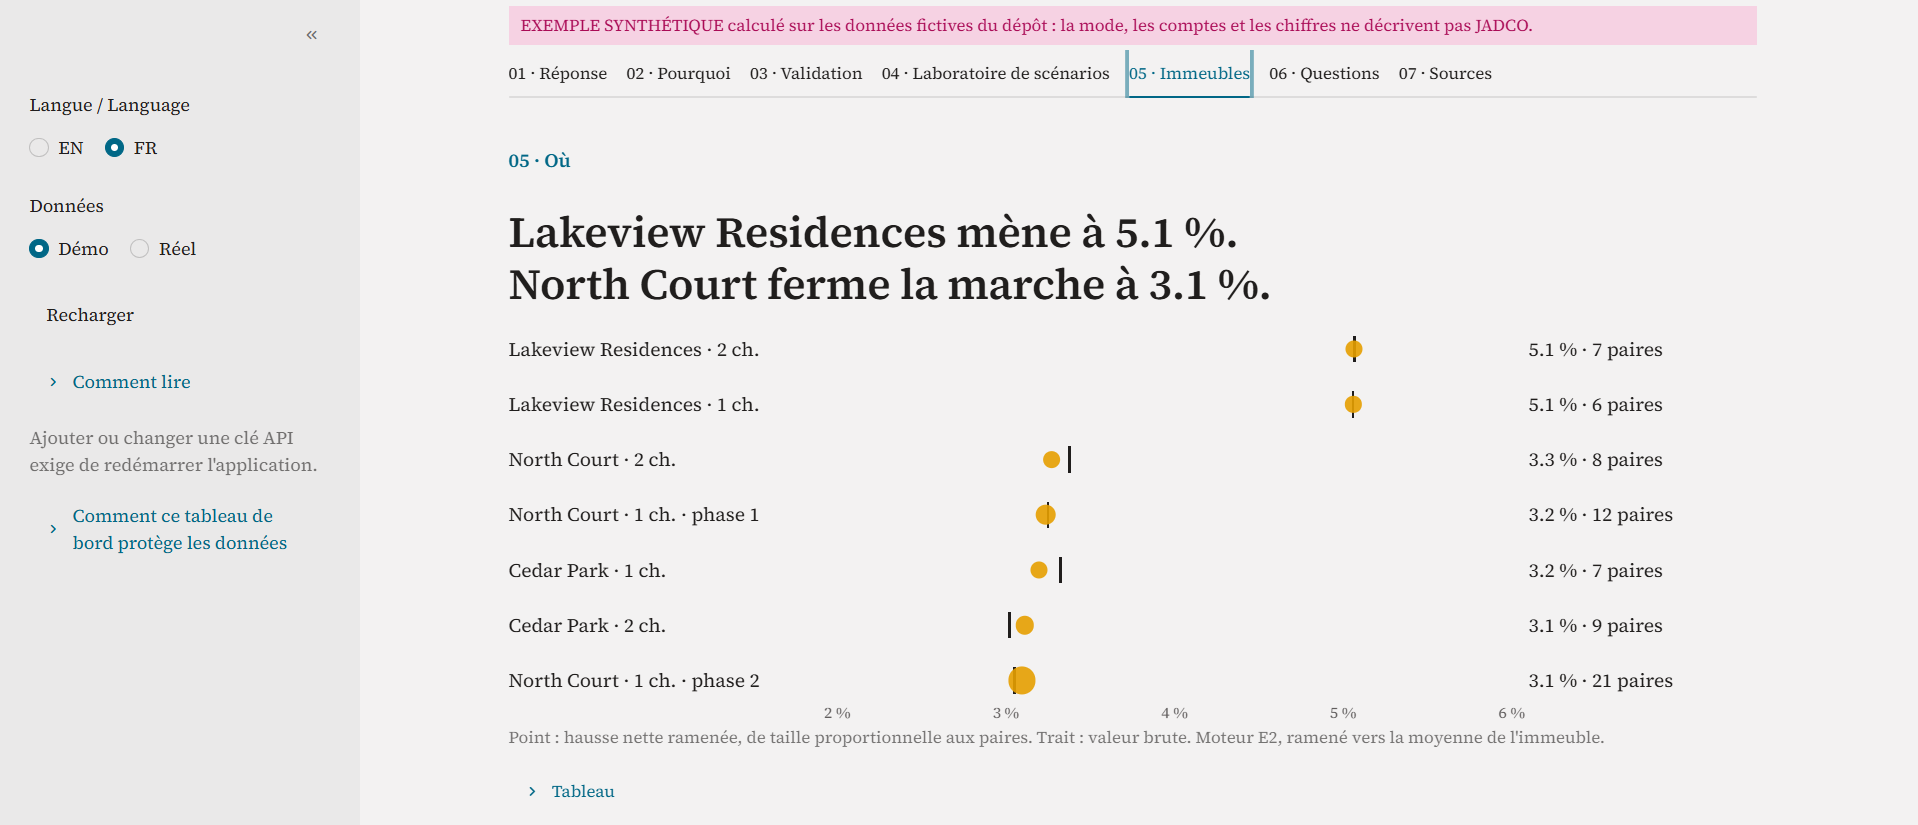
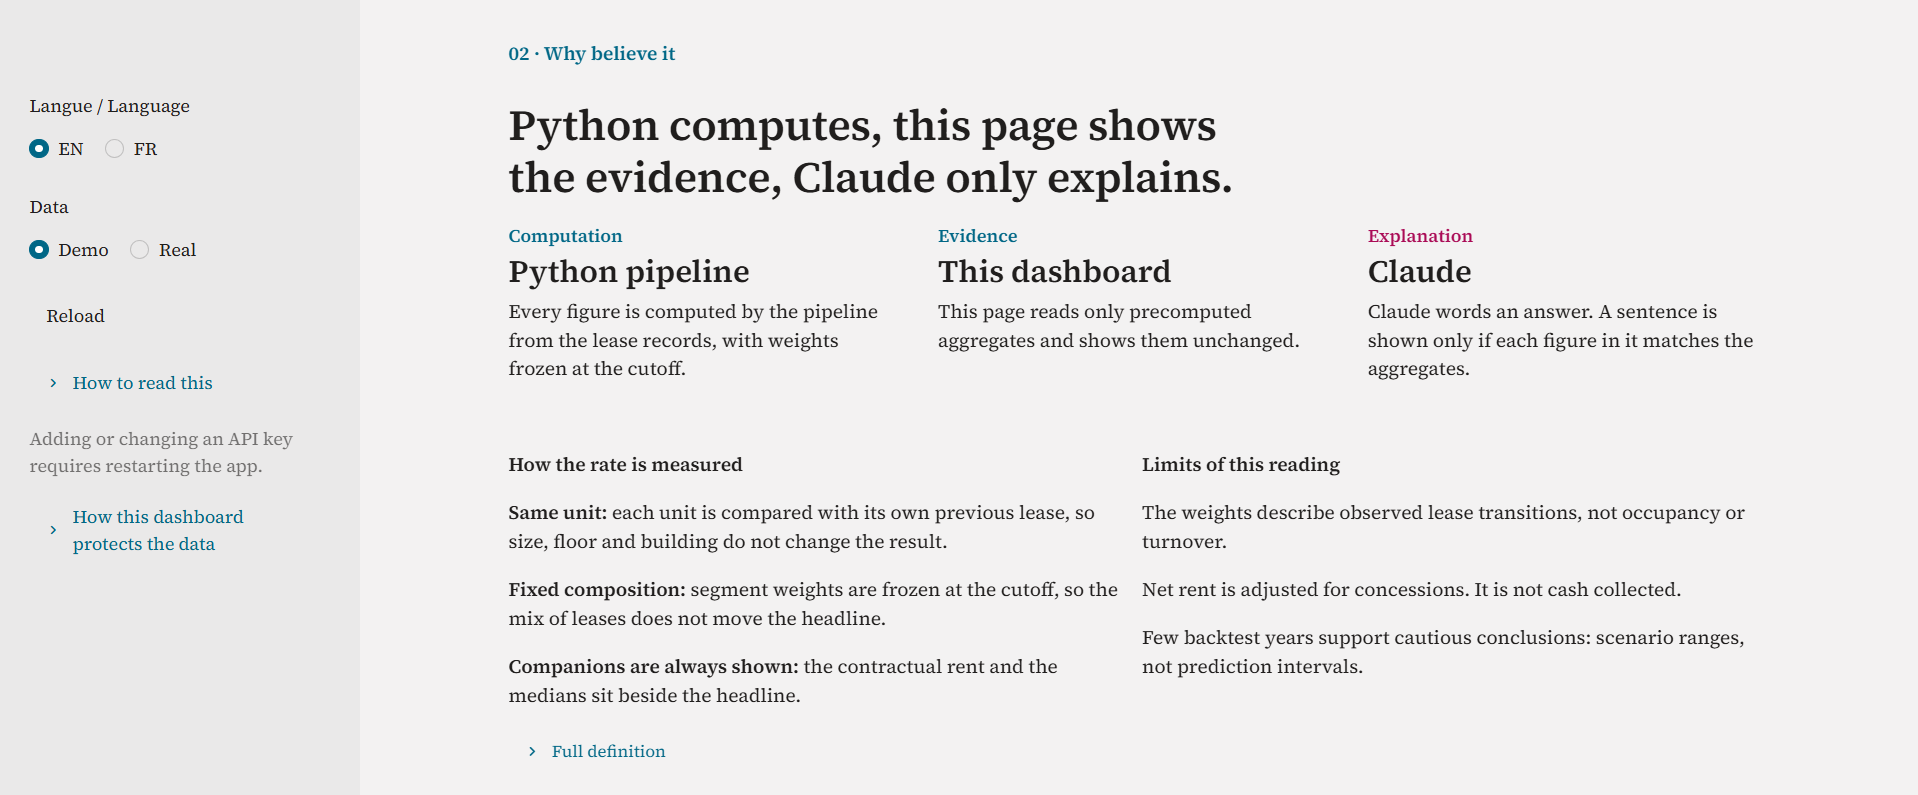
We compare consecutive leases for the same unit, account for the time between them, and group the results by building, bedroom count, and whether the tenant renewed or changed. We keep those groups’ weights fixed so that changes in the portfolio’s mix cannot be mistaken for rent growth. Alongside the central forecast, we show contractual rent growth, a median comparison, separate Québec and Ontario results, an uncertainty interval calculated by resampling units, and low, central, and high scenarios.
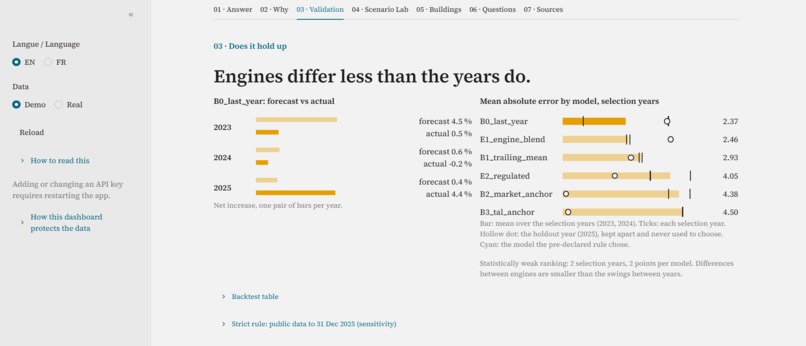
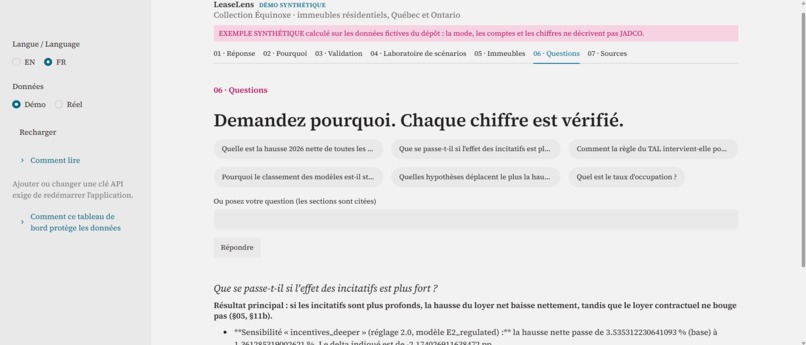
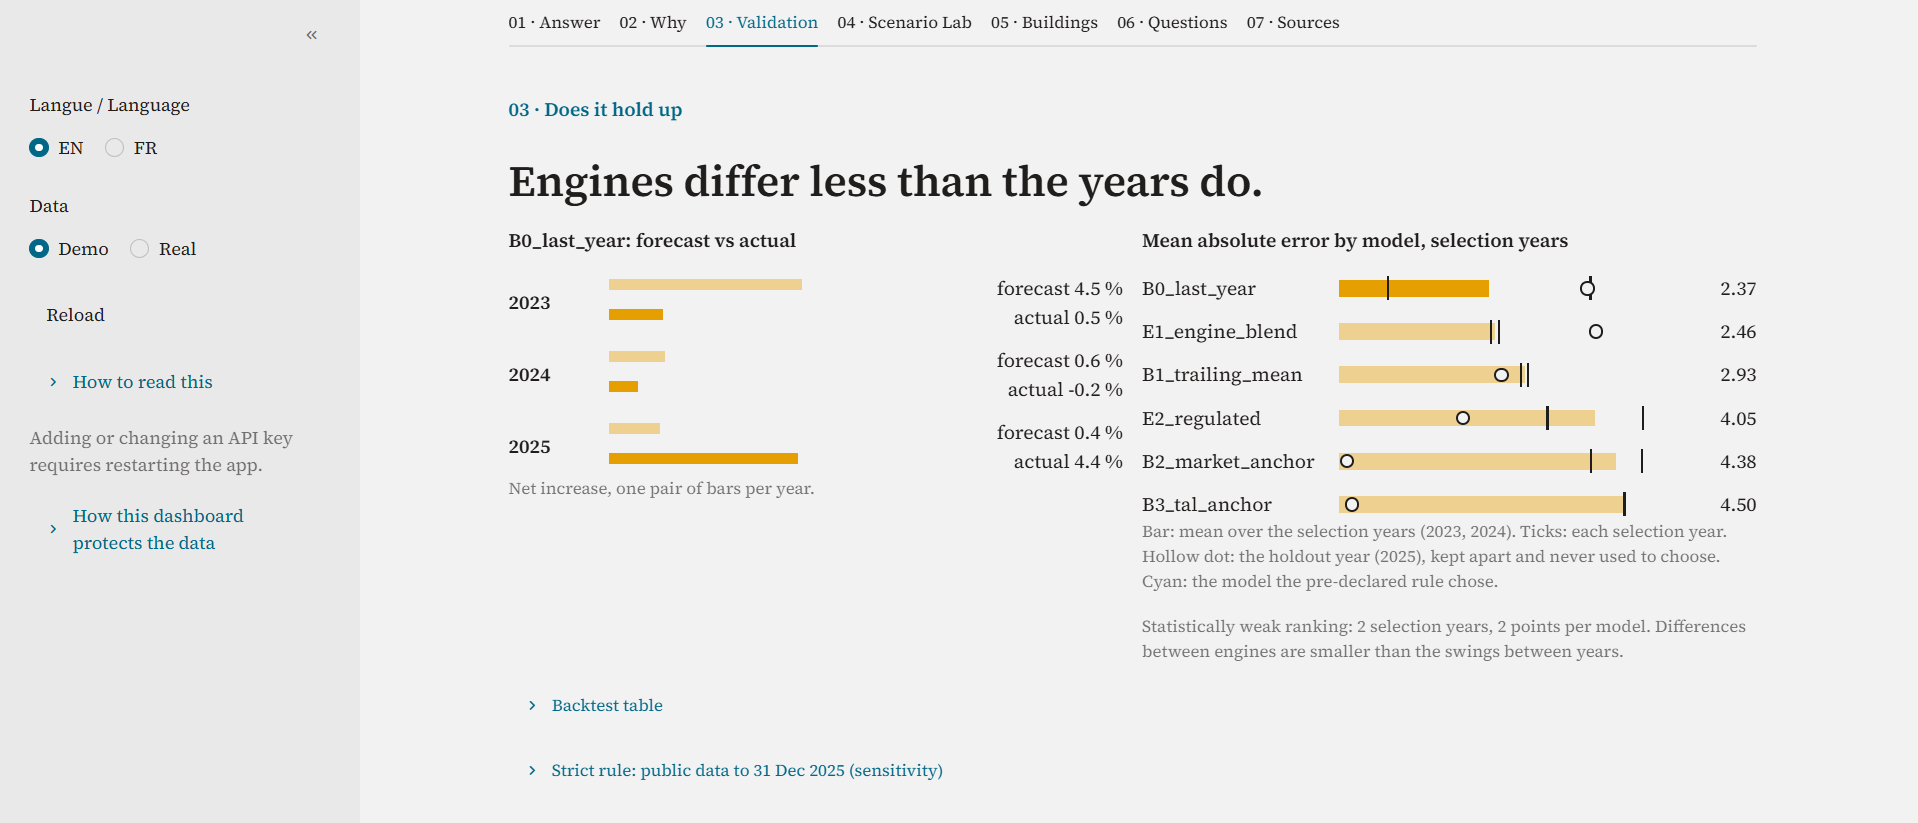
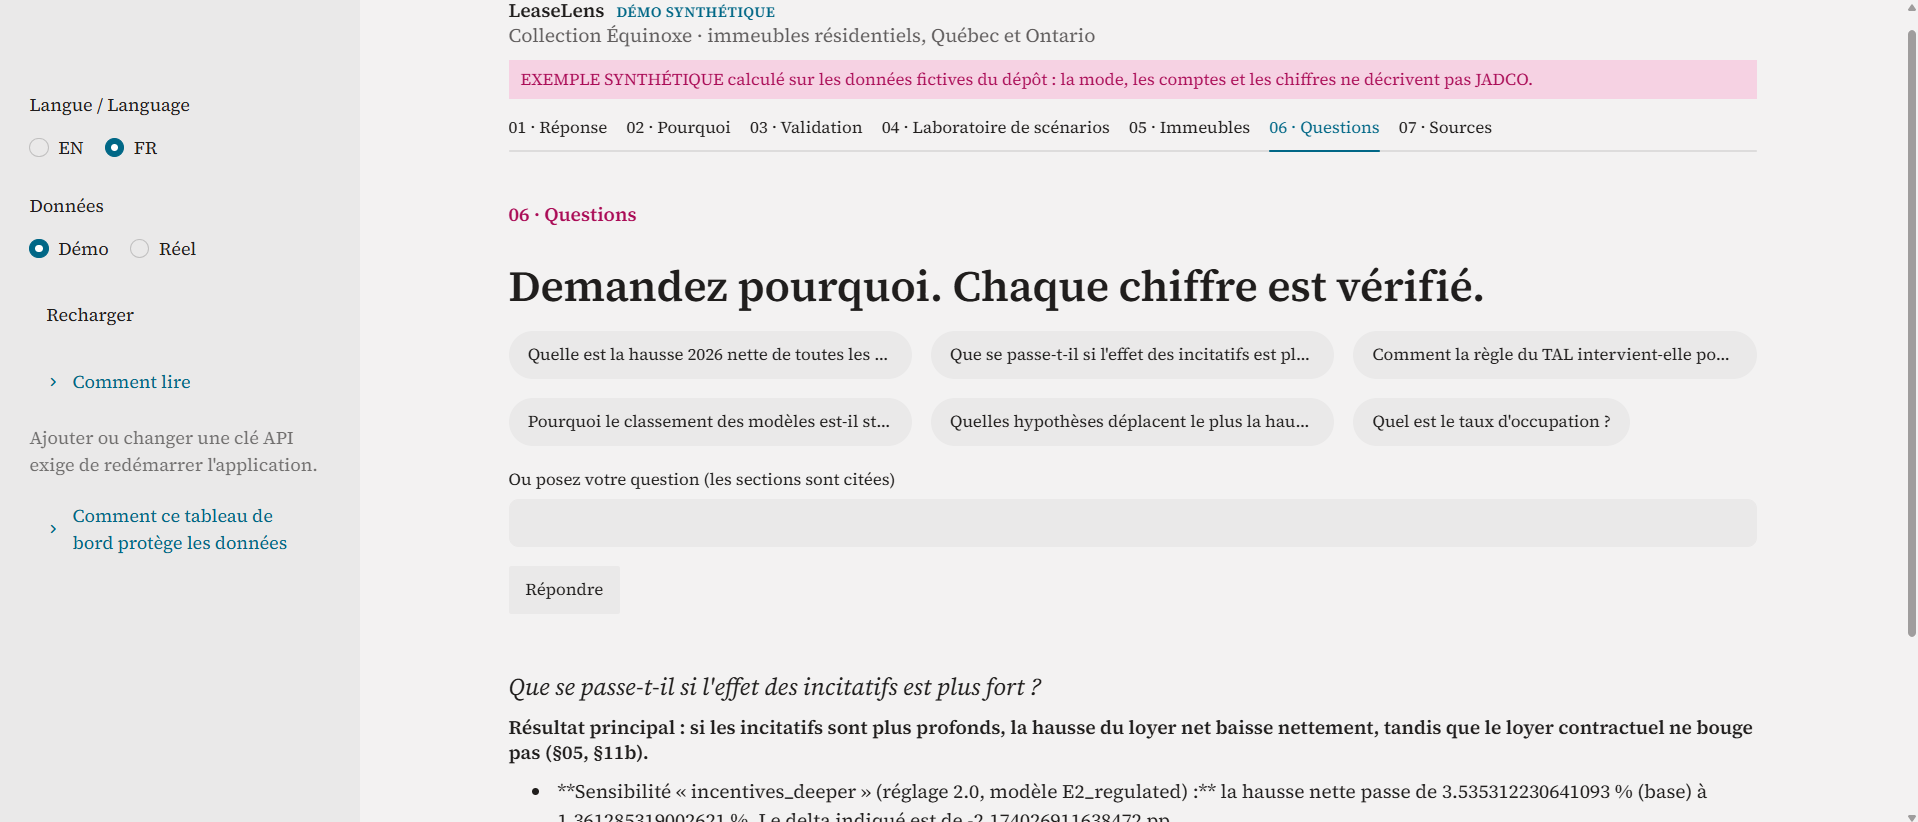
We also backtested six models on 2023, 2024, and 2025. We chose the selection rule in advance and showed how every model performed, including those that did not win. Everything comes together in a reproducible notebook and an interactive dashboard. Users can explore the forecast, compare models, test scenarios, and see results by building. An AI copilot helps explain the findings using only aggregate data, with checks on every number it produces.
How we built it
We built HaloLens with Python and Jupyter, starting from JADCO’s starter notebook and developing a reusable library that powers both forecasting and validation. The notebook runs on a clean kernel every build so that its results can be reproduced.
Our first priority was making sure we were comparing the right homes. We matched units using property and unit identifiers, then cross-checked those matches. A seemingly reasonable alternative would have created hundreds of false comparisons. Next, we worked through the incentives. Free months and promotional credits affect what tenants actually pay, so we reconciled each concession with its lease. We identified PromoPay as a one-time credit rather than a monthly discount and separated the effects of incentives from changes in the portfolio’s composition.
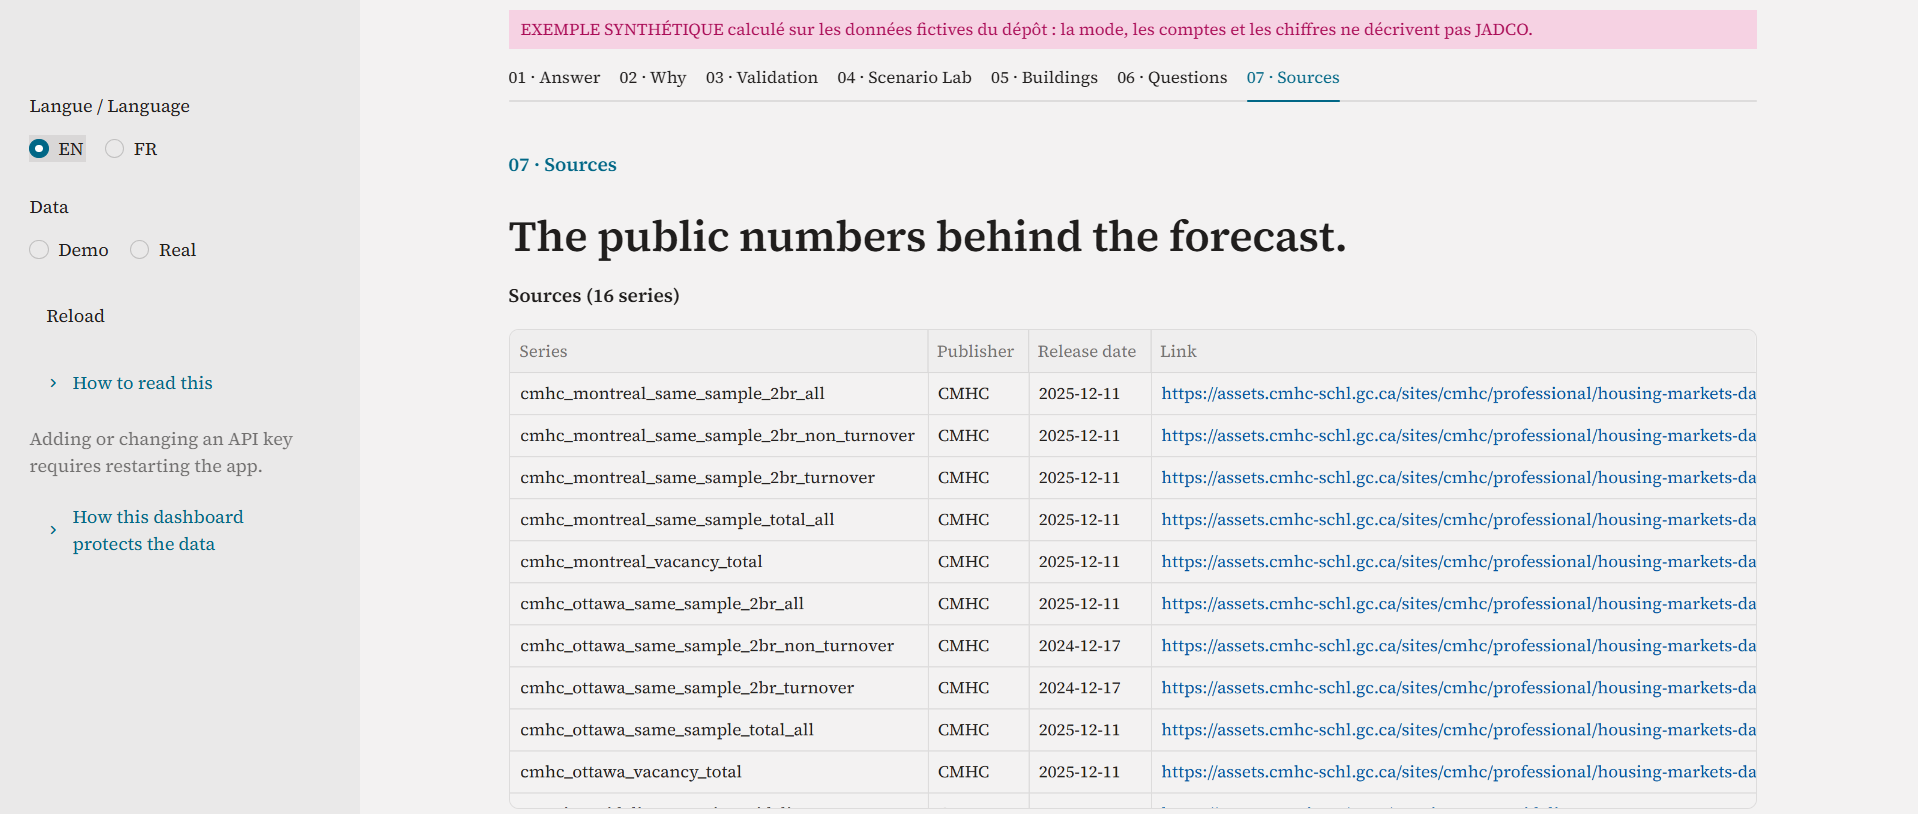
We analysed renewals and turnovers separately and accounted for the different rent rules in Québec and Ontario. For The Met, we treated its possible post-2018 exemption as an explicit scenario. We used official CMHC, Statistics Canada, TAL, and Ontario sources for outside context. Every public value has a source and release date. Each forecast uses only information published by January 31 of its target year, and we apply that same cutoff in every backtest. Our three-person team worked with clear responsibilities, agreed interfaces between modules, and pull requests. Claude Code helped implement tasks, while humans reviewed and merged the changes.
Challenges we ran into
The hardest part was learning when the data could mislead us. A field described as monthly turned out to represent a one-time credit. Another included accessory concessions. New premium buildings distorted simple averages. Each issue could have led us to a convincing answer that did not reflect the actual change in rents.
We also faced uncertainty around The Met’s rent-control status. We could not establish that status legally, so we modelled its possible exemption as a scenario rather than guessing. Public data brought another challenge: the period a number describes is not necessarily the date it became available. Tracking release dates took careful work, but it mattered for keeping our backtests honest.
With only three backtest years, we also had to be cautious about declaring a winning model. We made that limitation visible and showed every model’s errors. Privacy remained a priority throughout. Confidential CRM data stayed on our machines and out of GitHub, while AI tools saw only public pages or aggregate information.
Accomplishments that we're proud of
We reproduced JADCO’s 10.8% increase that “didn’t happen” and showed that most of it came from changes in the portfolio’s composition.
We’re especially proud of thinking outside the box. Beyond calculating a forecast, we asked ourselves what would make this project useful to the people at JADCO who have to make real budgeting decisions. That led us to add features we believed would benefit their team: an interactive dashboard, building-level views, low-to-high scenarios, and an AI copilot that helps explain the results. We wanted someone using LeaseLens to feel comfortable exploring the numbers, asking questions, and understanding the reasoning behind them.
We also made the forecast traceable. Every exclusion has a reason, every public input has a source and date, and every threshold is documented. Forecasting and backtesting use the same code, with tests checking that future records cannot change earlier forecasts.
What we’re most proud of is taking a request for one number and turning it into a tool designed to help JADCO make informed decisions with greater confidence.
What we learned
Before asking how much rents increased, we had to define what “increase” meant. That definition shaped everything that followed.
We learned that incentives can create a meaningful gap between the rent written on a lease and the amount a tenant actually pays. Ignoring that gap can overstate growth. We also learned to be honest about uncertainty. With limited history, simple models can be difficult to beat, and a range of scenarios can be more useful than a number that appears more precise than the evidence supports.
Working as three people with AI tools taught us how much clear responsibilities and human review matter. Those practices helped us keep the work coordinated and the results accountable.
What's next for HaloLens
We want to make HaloLens more useful for the people making budgeting decisions.
Our next steps include more detailed forecasts by building and bedroom count, using a method that draws on the wider portfolio when an individual group has limited data. We also want to continue validating the models as more years of leases become available.
We plan to monitor new TAL, CMHC, and Statistics Canada releases automatically, with human approval before any new value enters the model.
Finally, we want to deploy an access-controlled dashboard for JADCO’s budgeting team. Our goal is simple: when someone asks, “Can we trust this forecast?”, they should be able to see how it was built, where it is uncertain, and why the result makes sense.

Log in or sign up for Devpost to join the conversation.