-
-
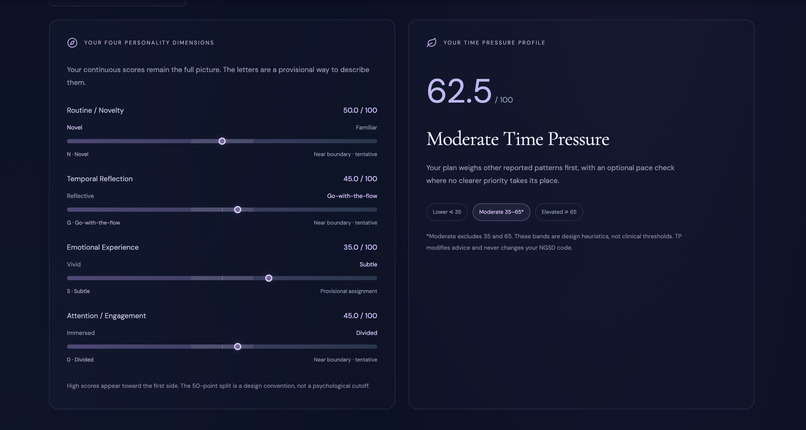
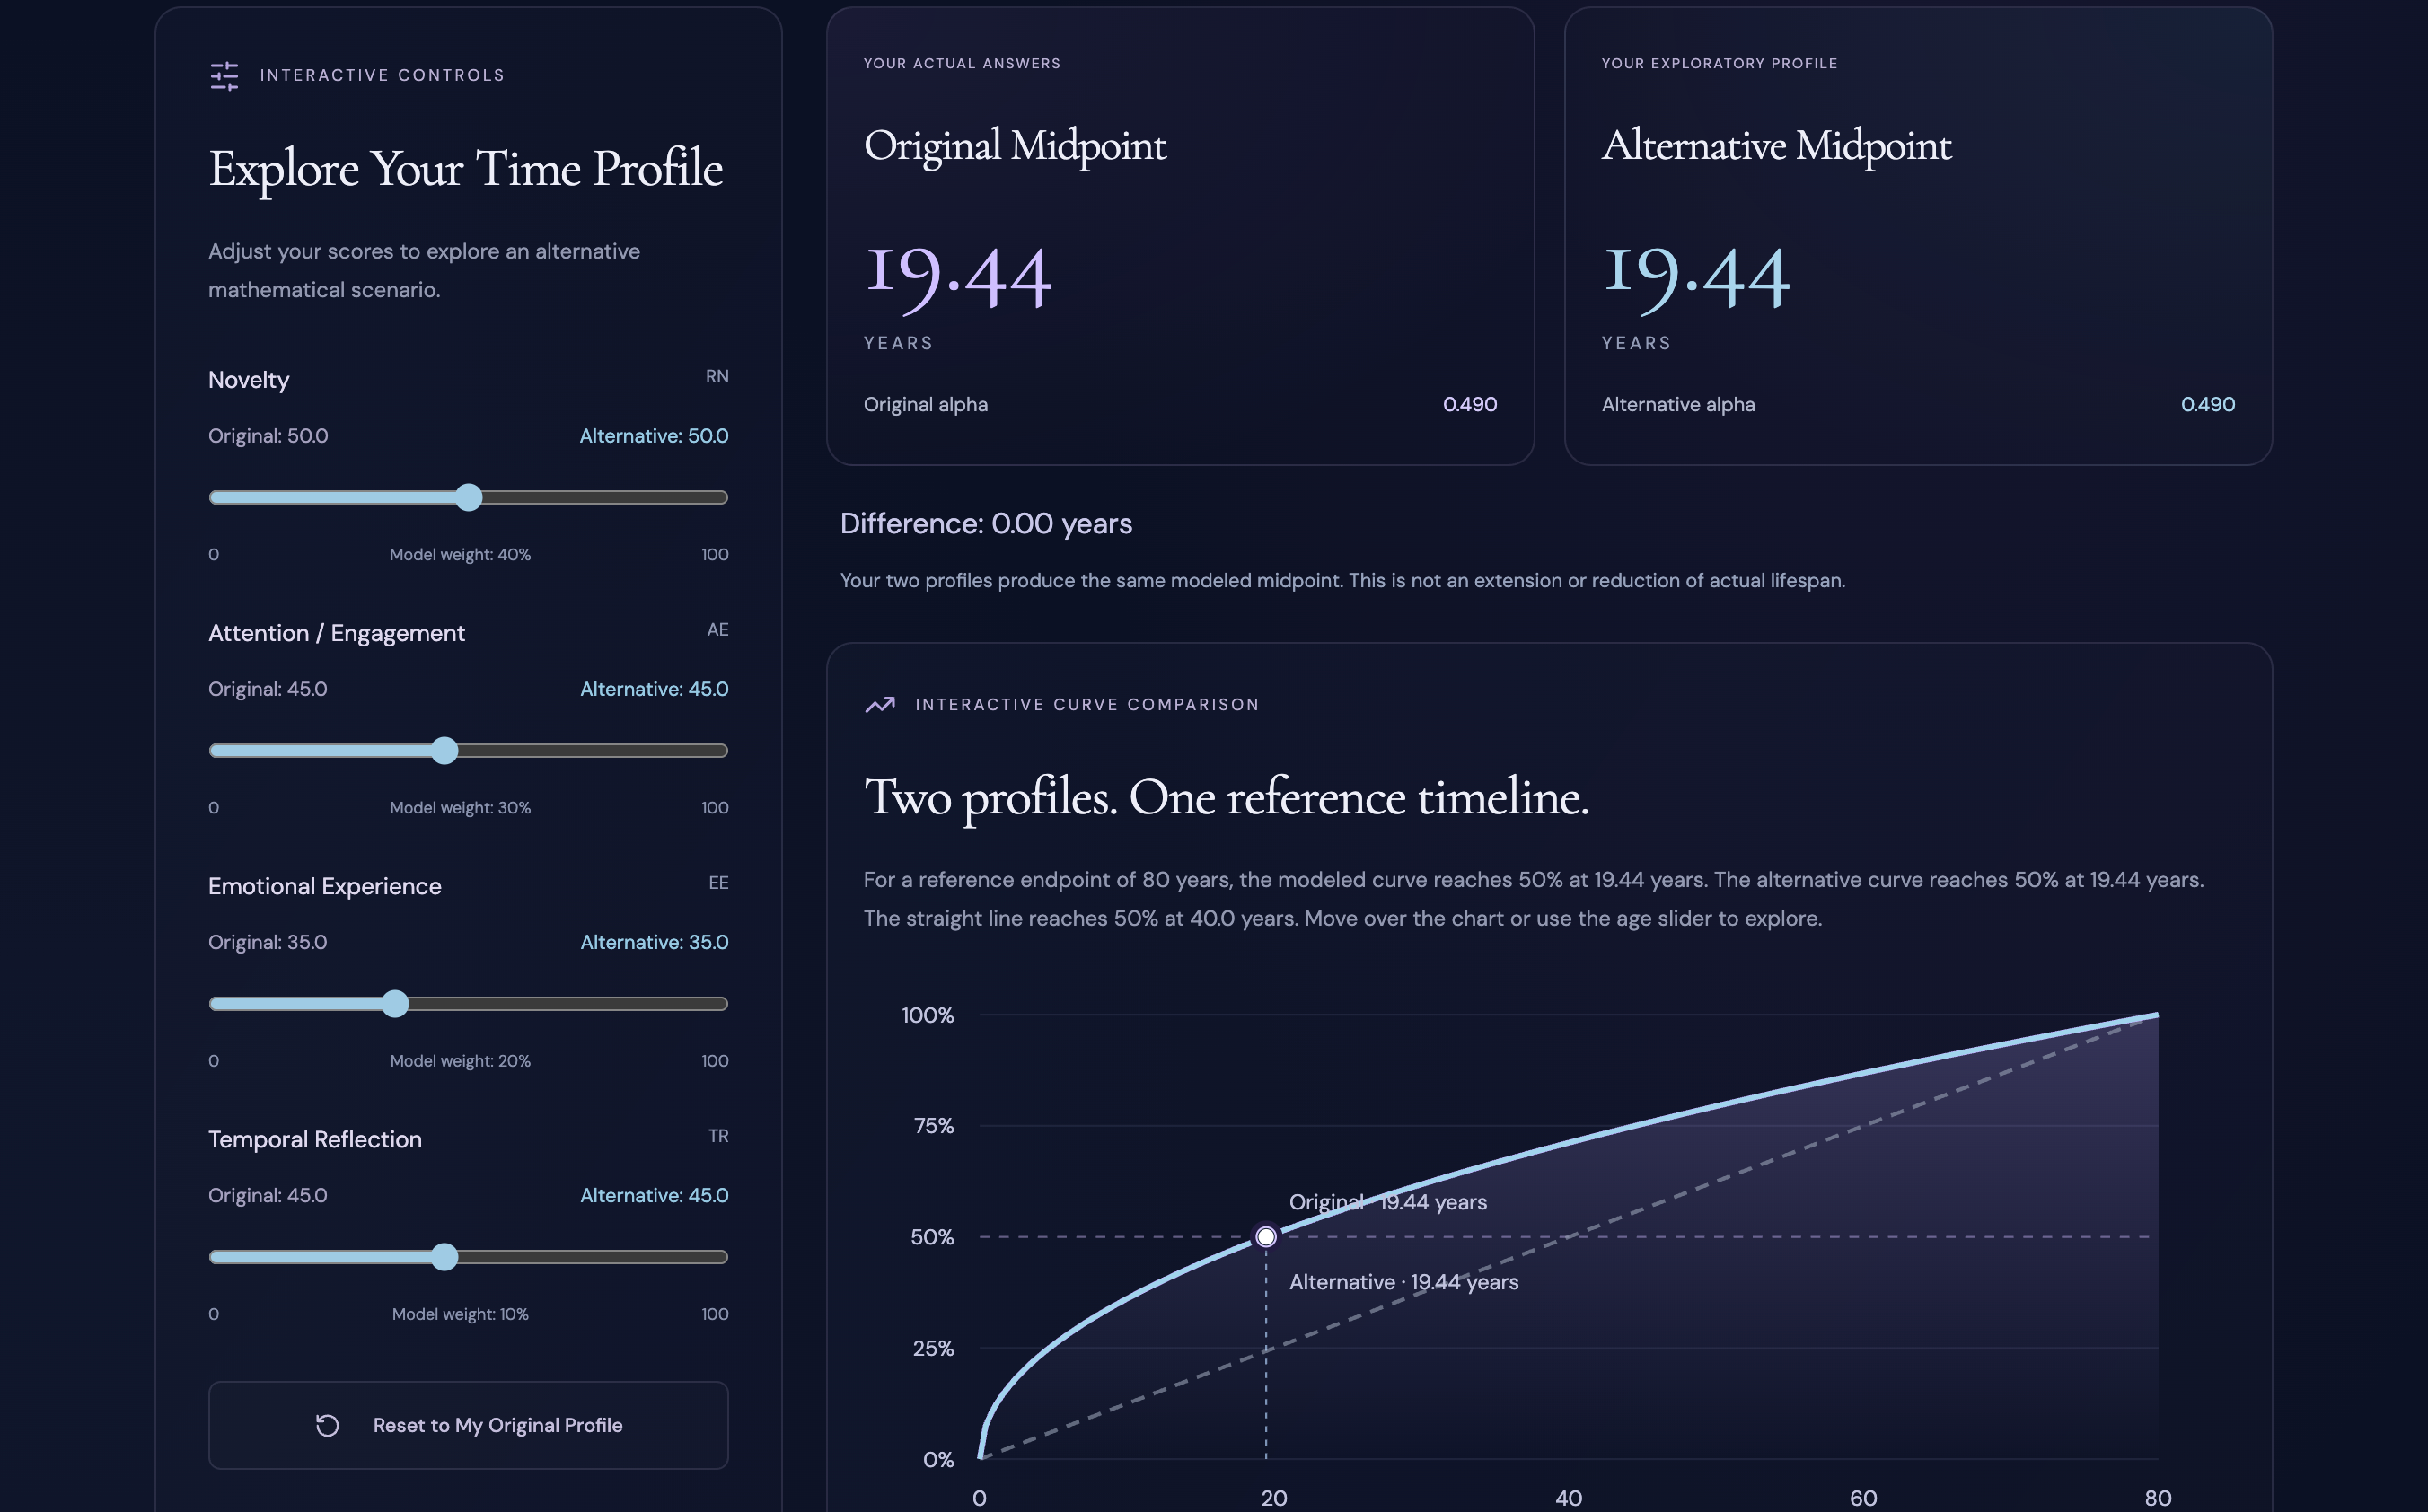
Adjust different lifestyle factors and explore how they influence your perceived time pressure through an interactive model.
-
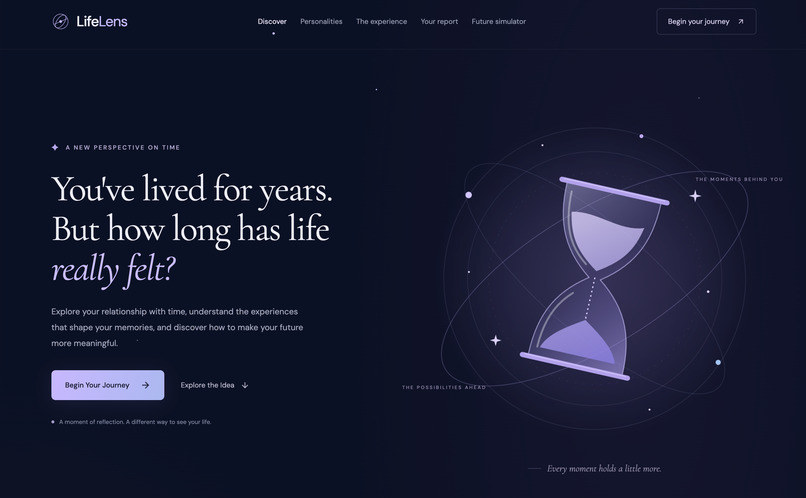
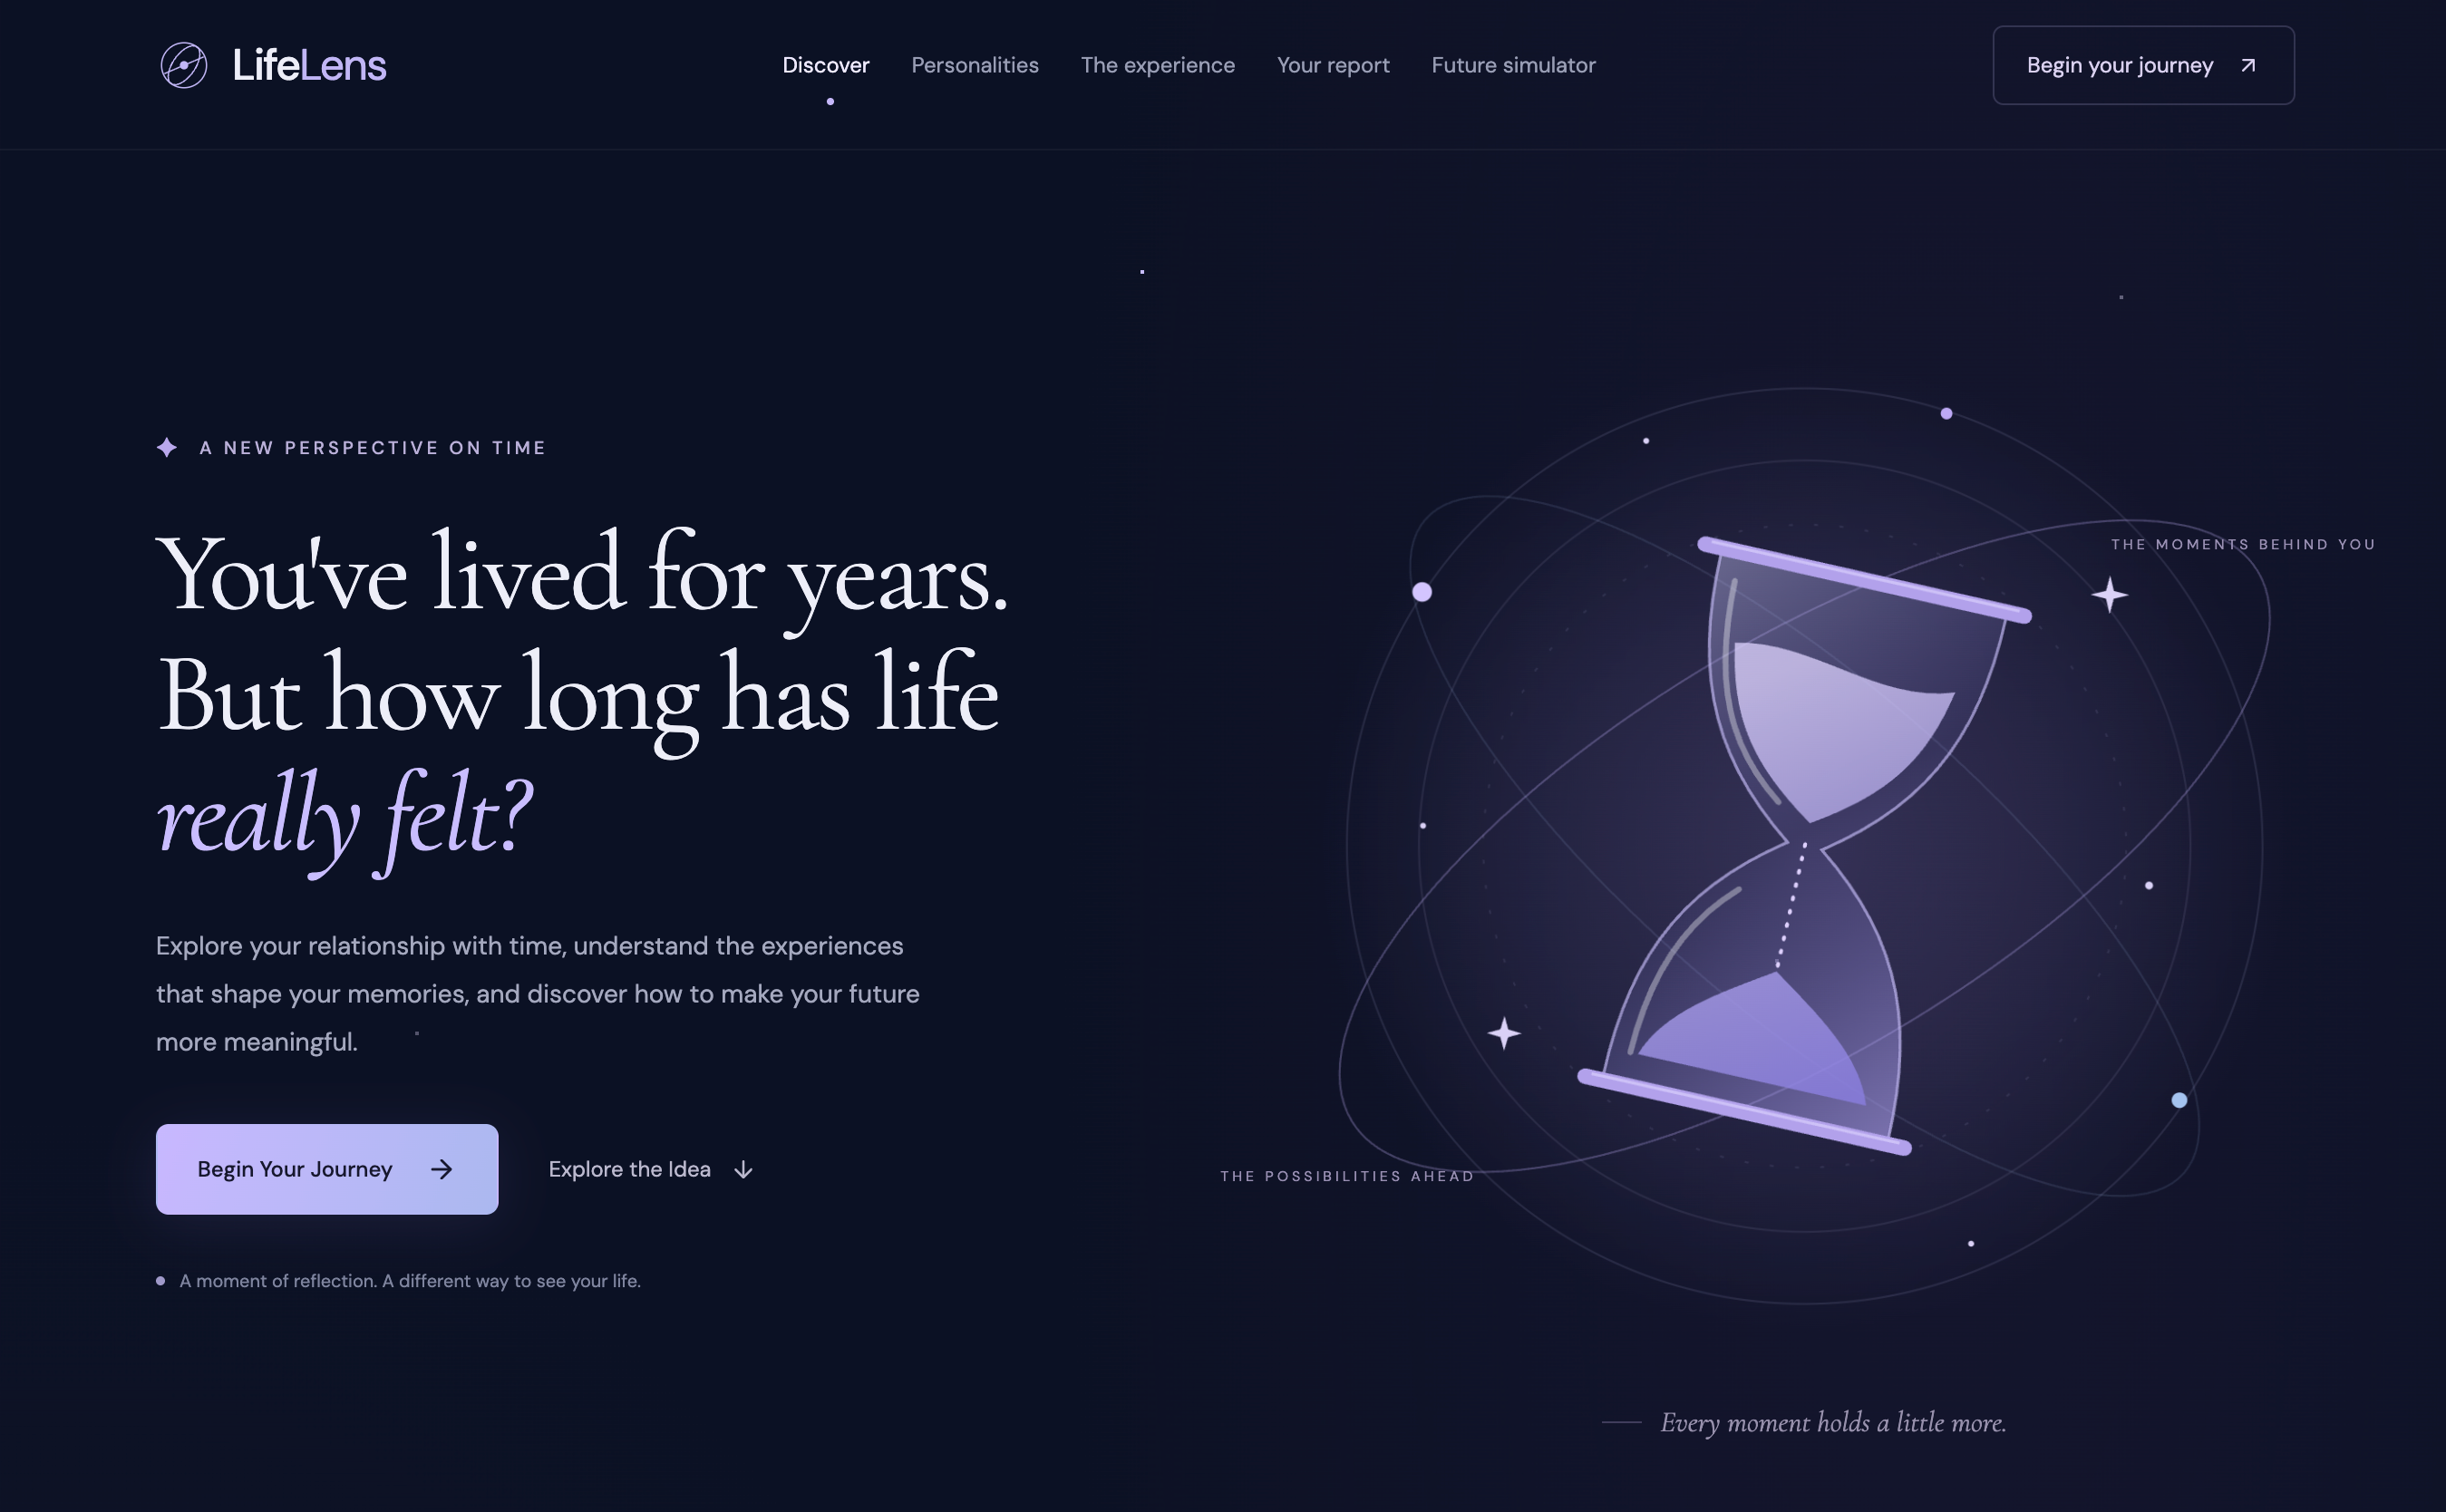
LifeLens explores simple question: How long has your life really felt? Discover a new way to understand your subjective experience of time.
-
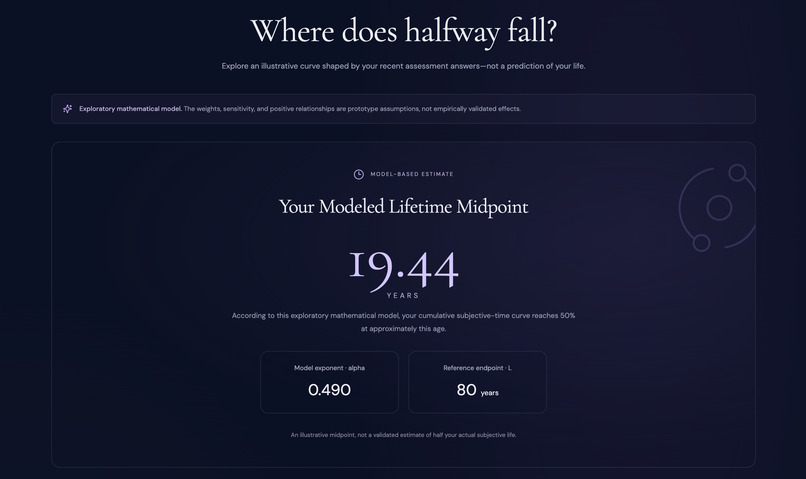
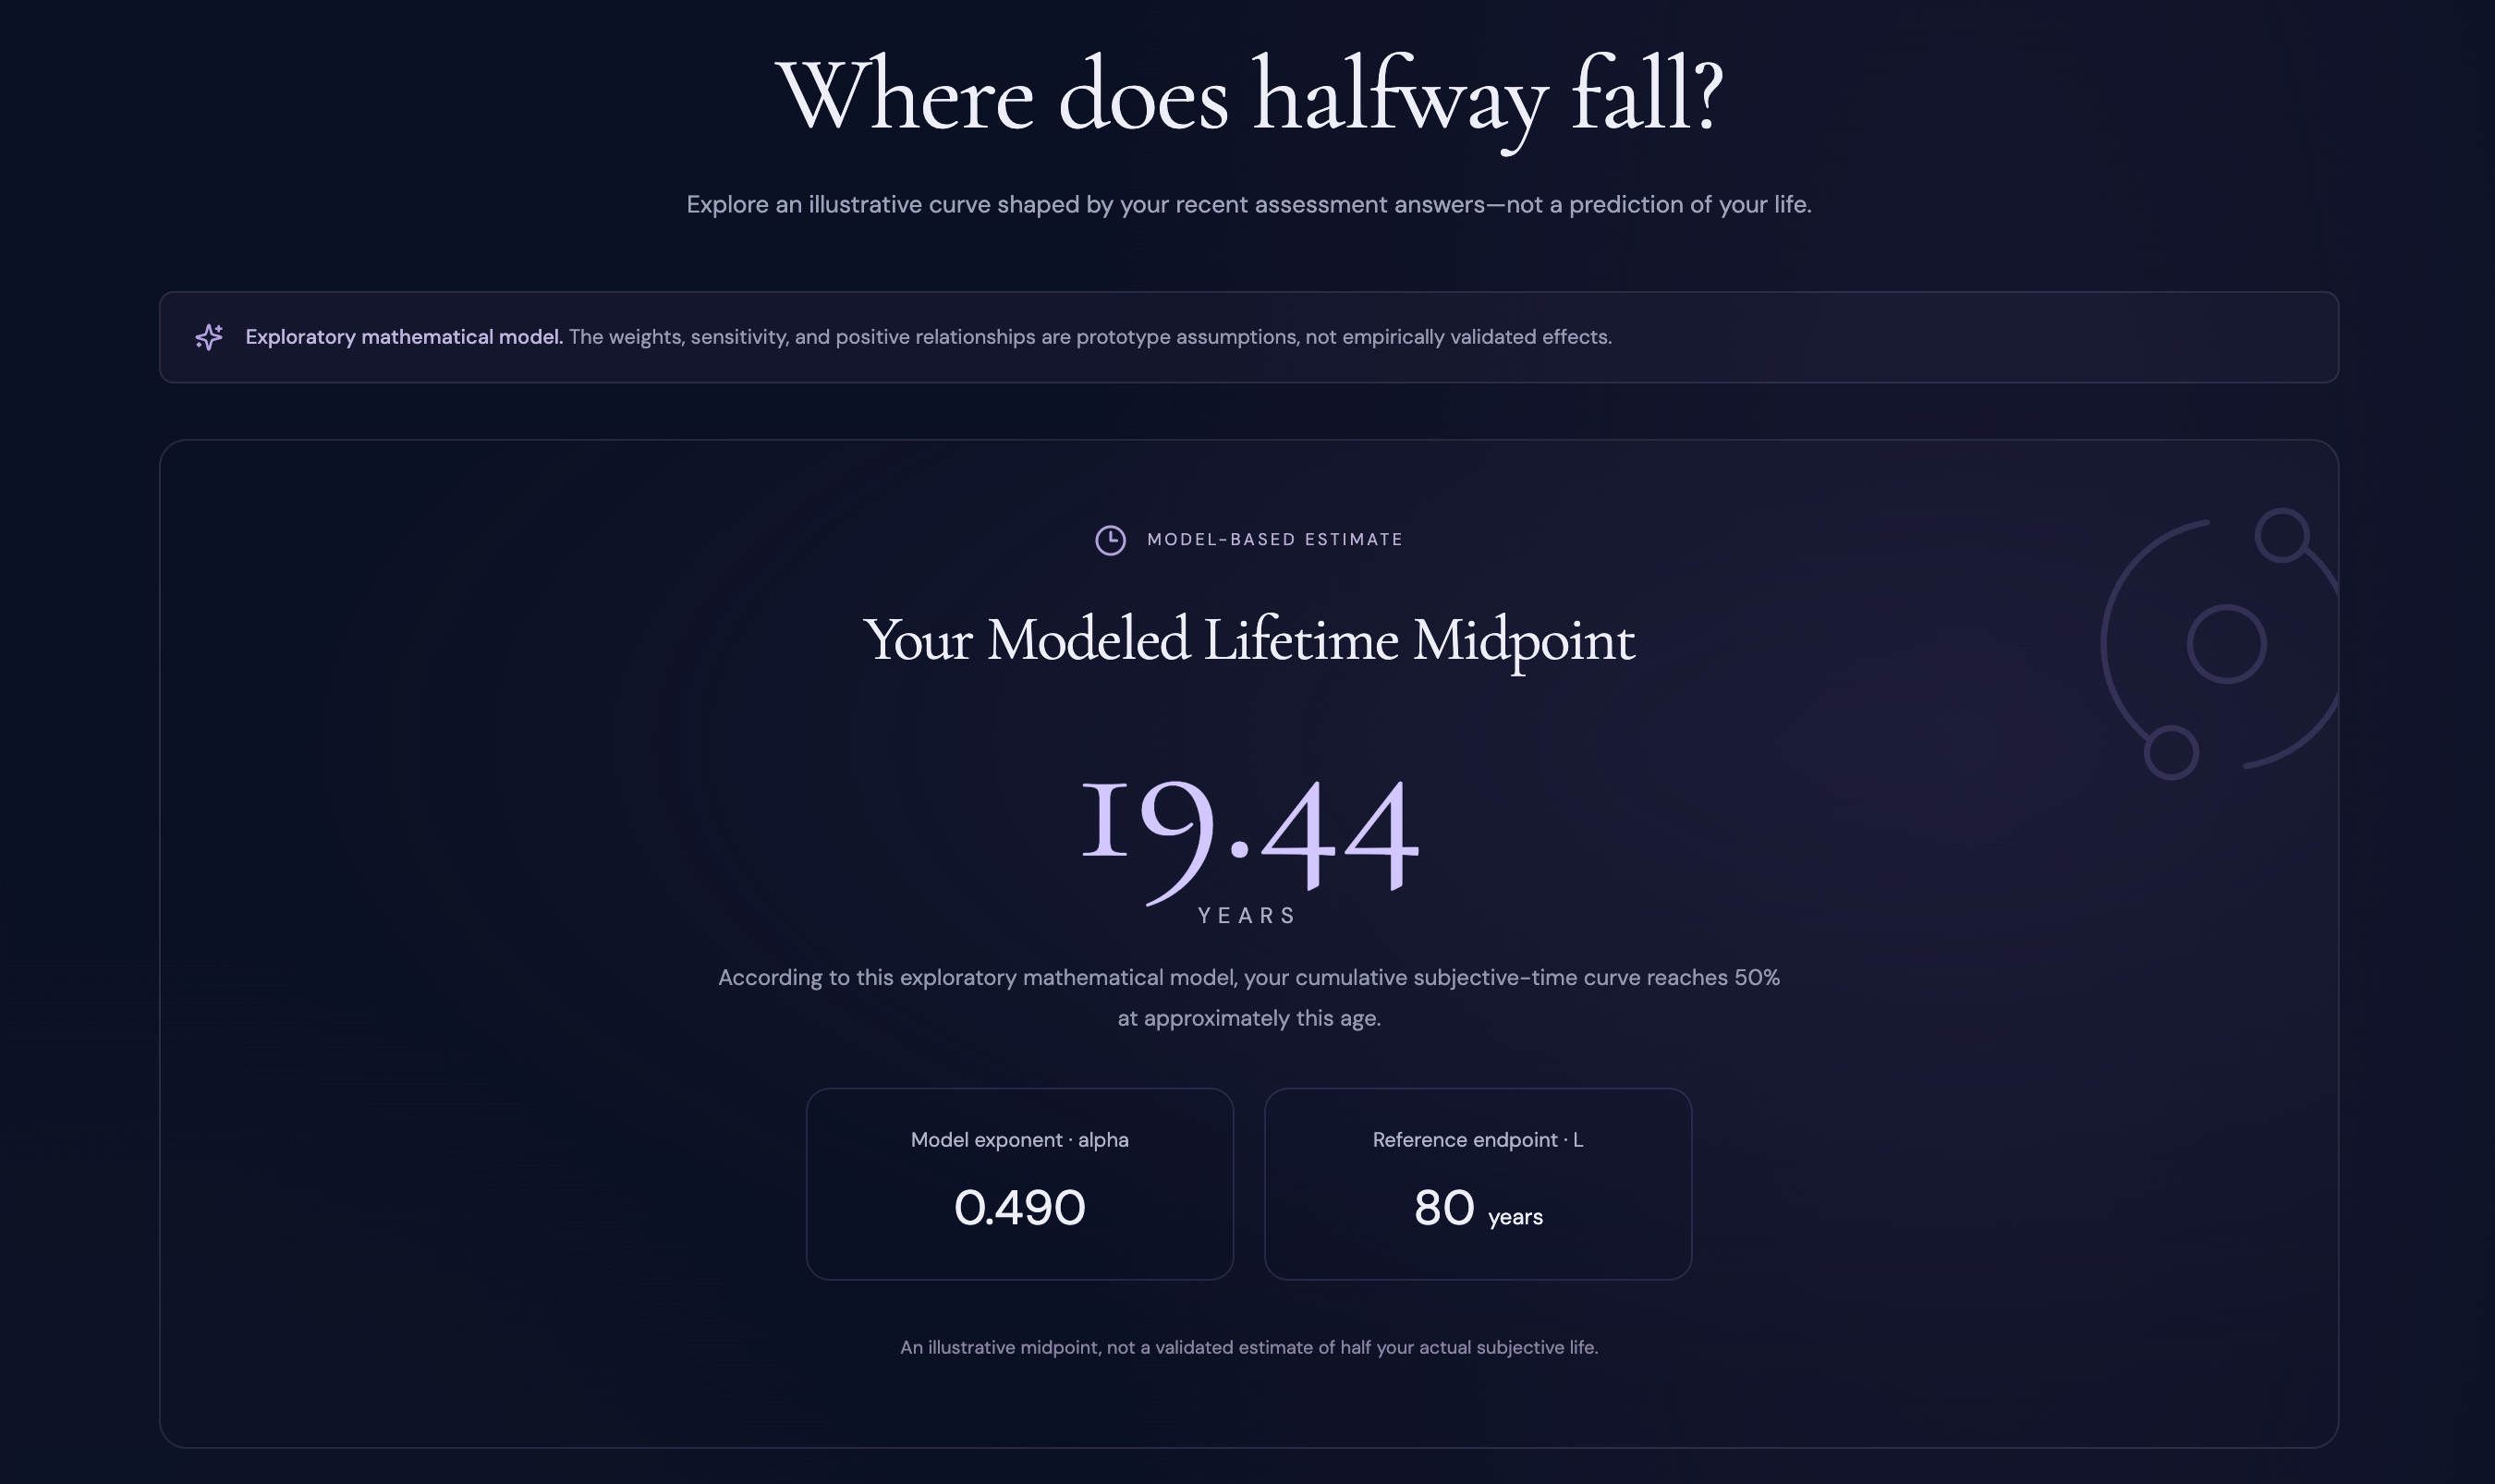
Discover your estimated subjective lifetime midpoint
-
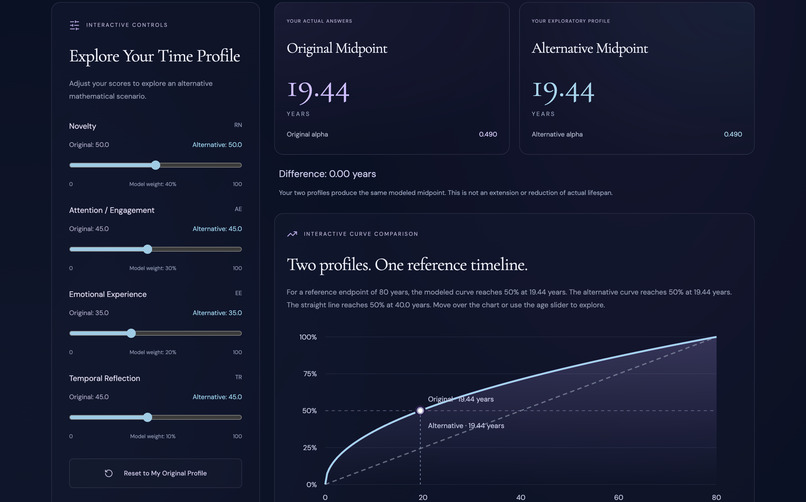
Explore alternative life scenarios
-
Learn how your experiences and habits shape your perception of time.
-
Compare chronological age with subjective time
Inspiration
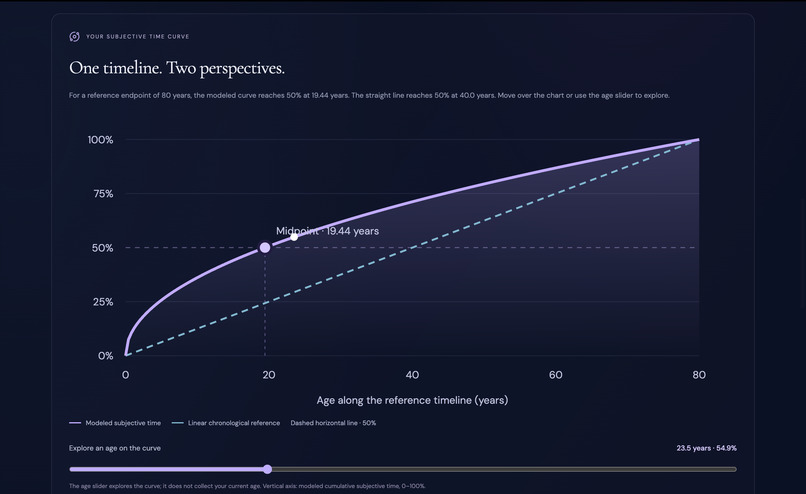
Our idea started when we watched a video proposing a logarithmic relationship between actual age and perceived time. It surprised us that someone who is only 18 might already feel like they have experienced almost half of their life.
This made us wonder: does everyone reach this point at the same age?
We found Robert Lemlich's research on how perceived time may speed up with age. However, individual experiences are different. Some people live with more routine or time pressure, while others experience more novelty or focus on the present. Instead of applying the same formula to everyone, we created a personalized model that adjusts Lemlich's idea using questionnaire results.
Similar to MBTI, users answer questions and receive a personalized result. But our goal goes beyond personality exploration or entertainment. We want to help people understand how they experience time and provide suggestions that can help them live a more fulfilling life.
What it does
Our website estimates a user's Subjective Lifetime Midpoint---the age when our model predicts they have experienced 50% of their perceived lifetime.
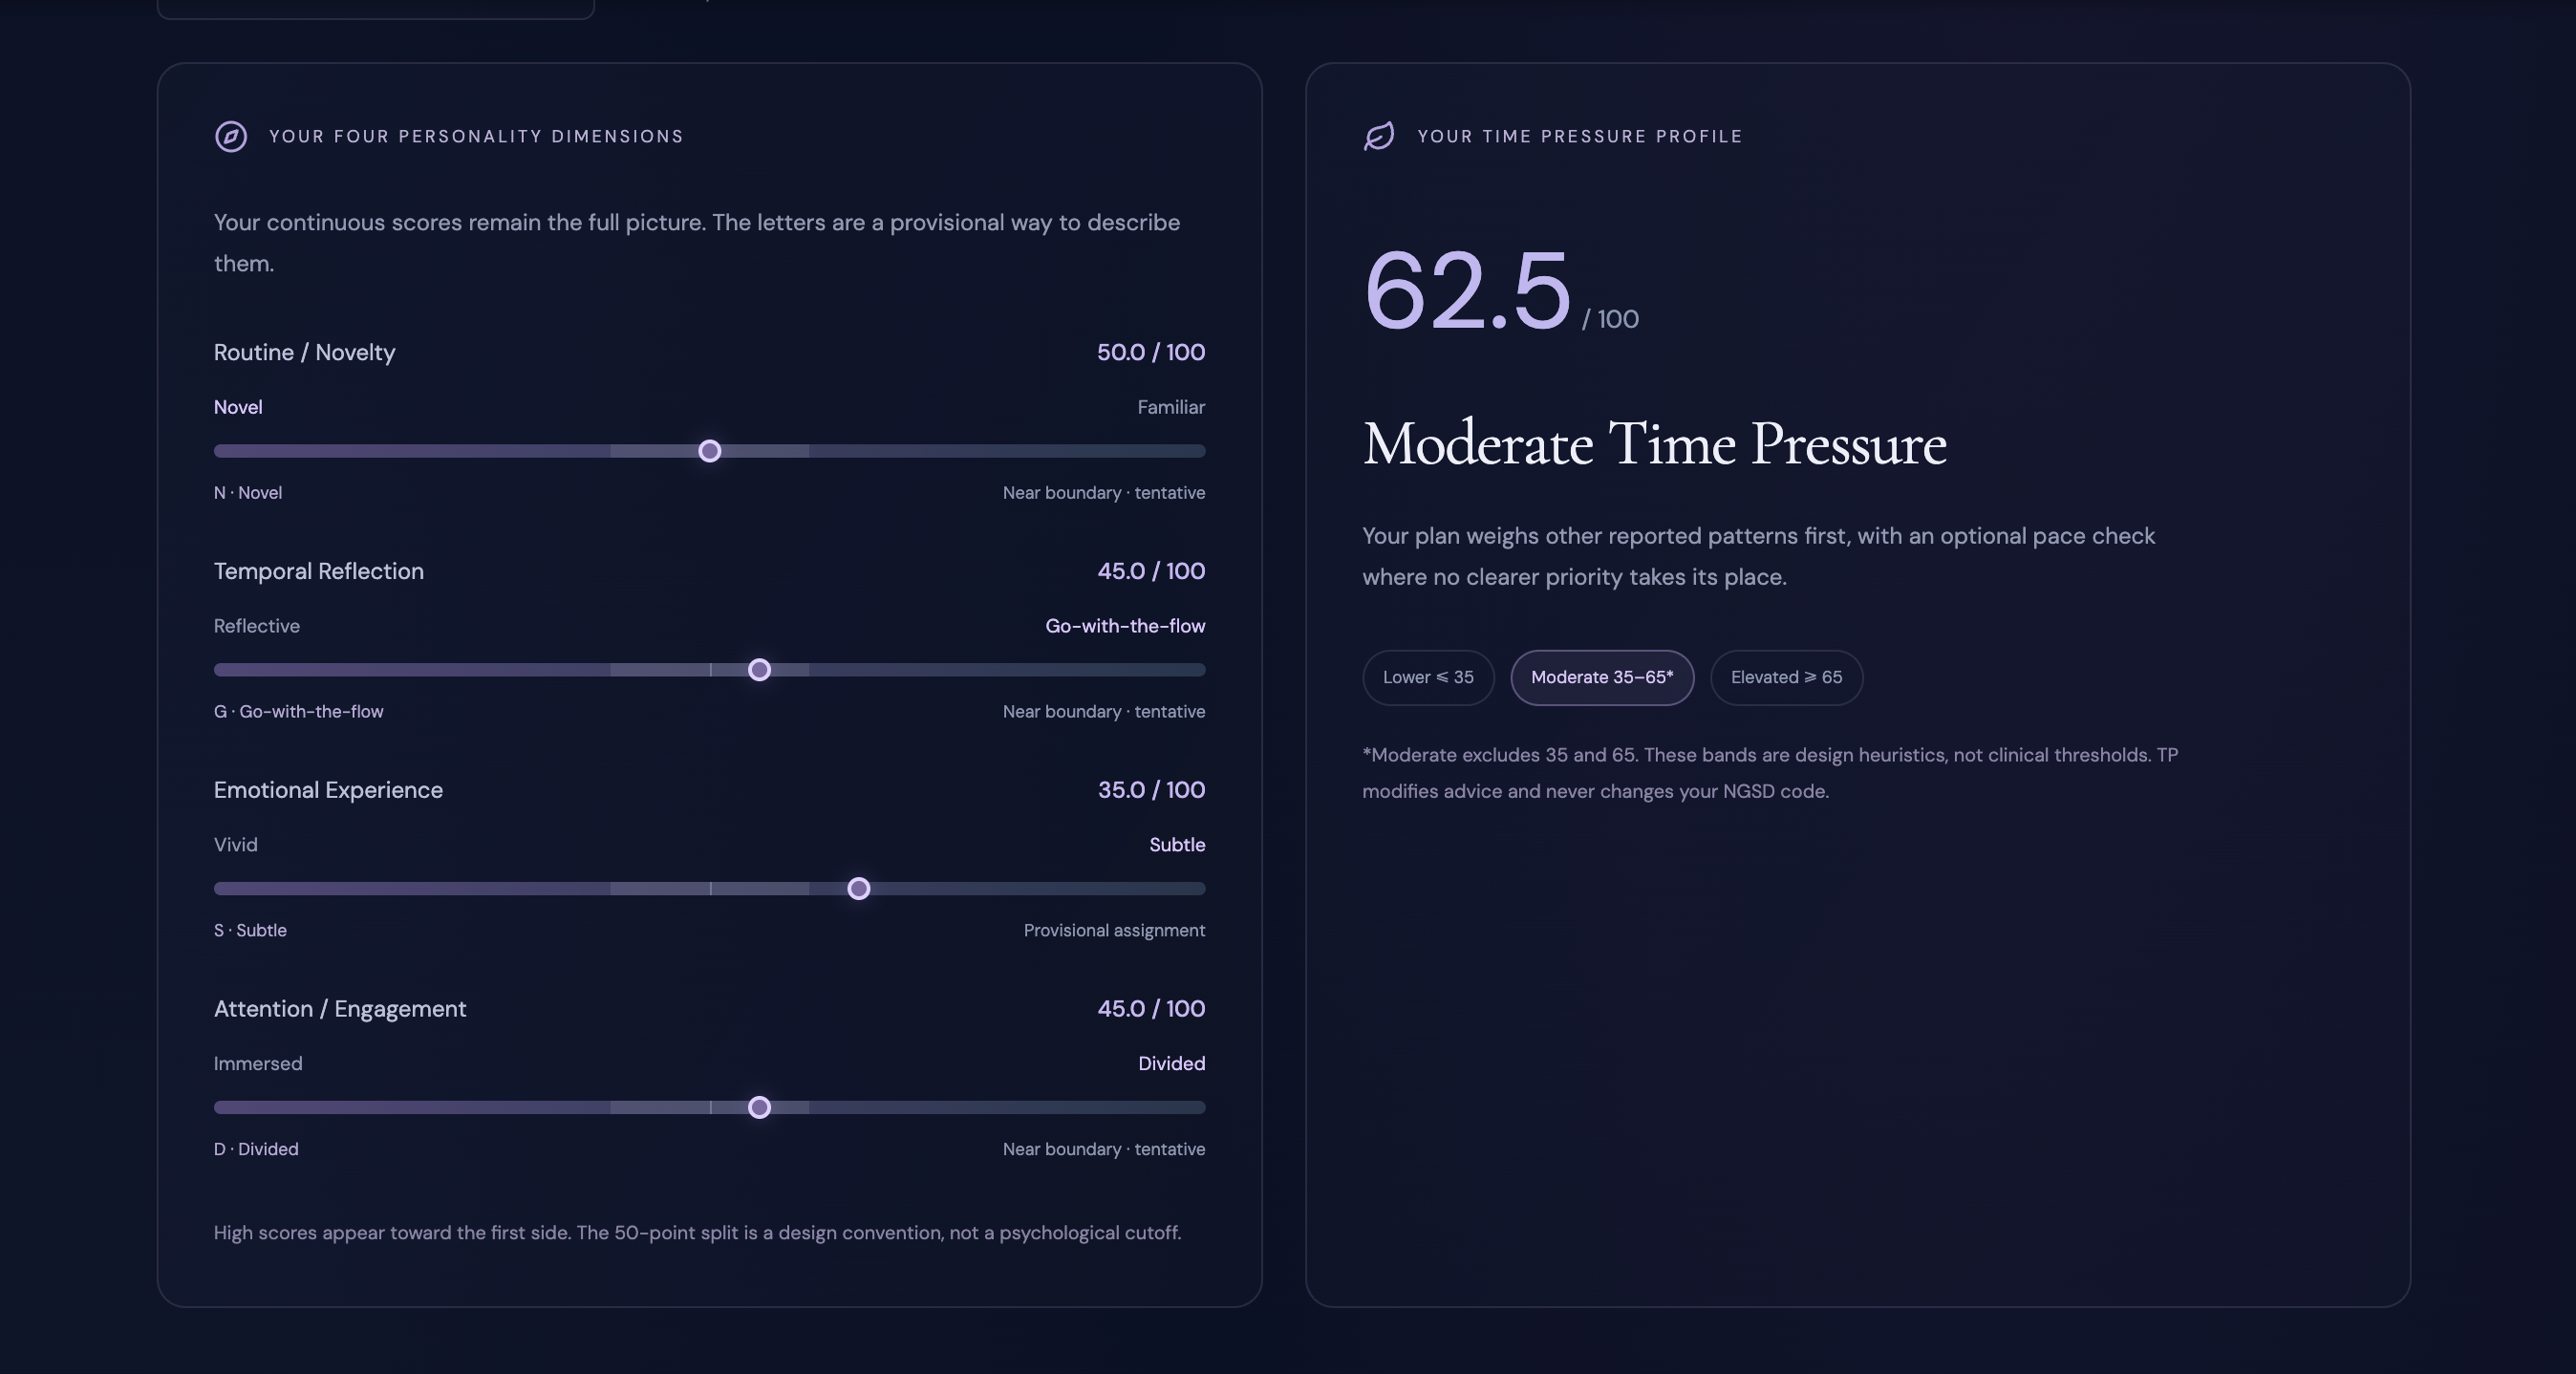
Users complete a short questionnaire measuring four factors related to time perception: novelty, emotional experience, temporal experience, and attention/engagement. Their responses are used to personalize each user's lifetime midpoint estimation.
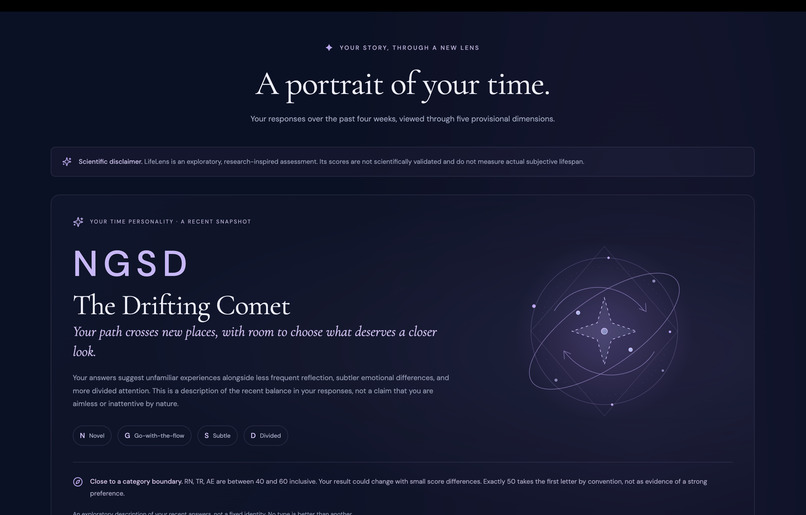
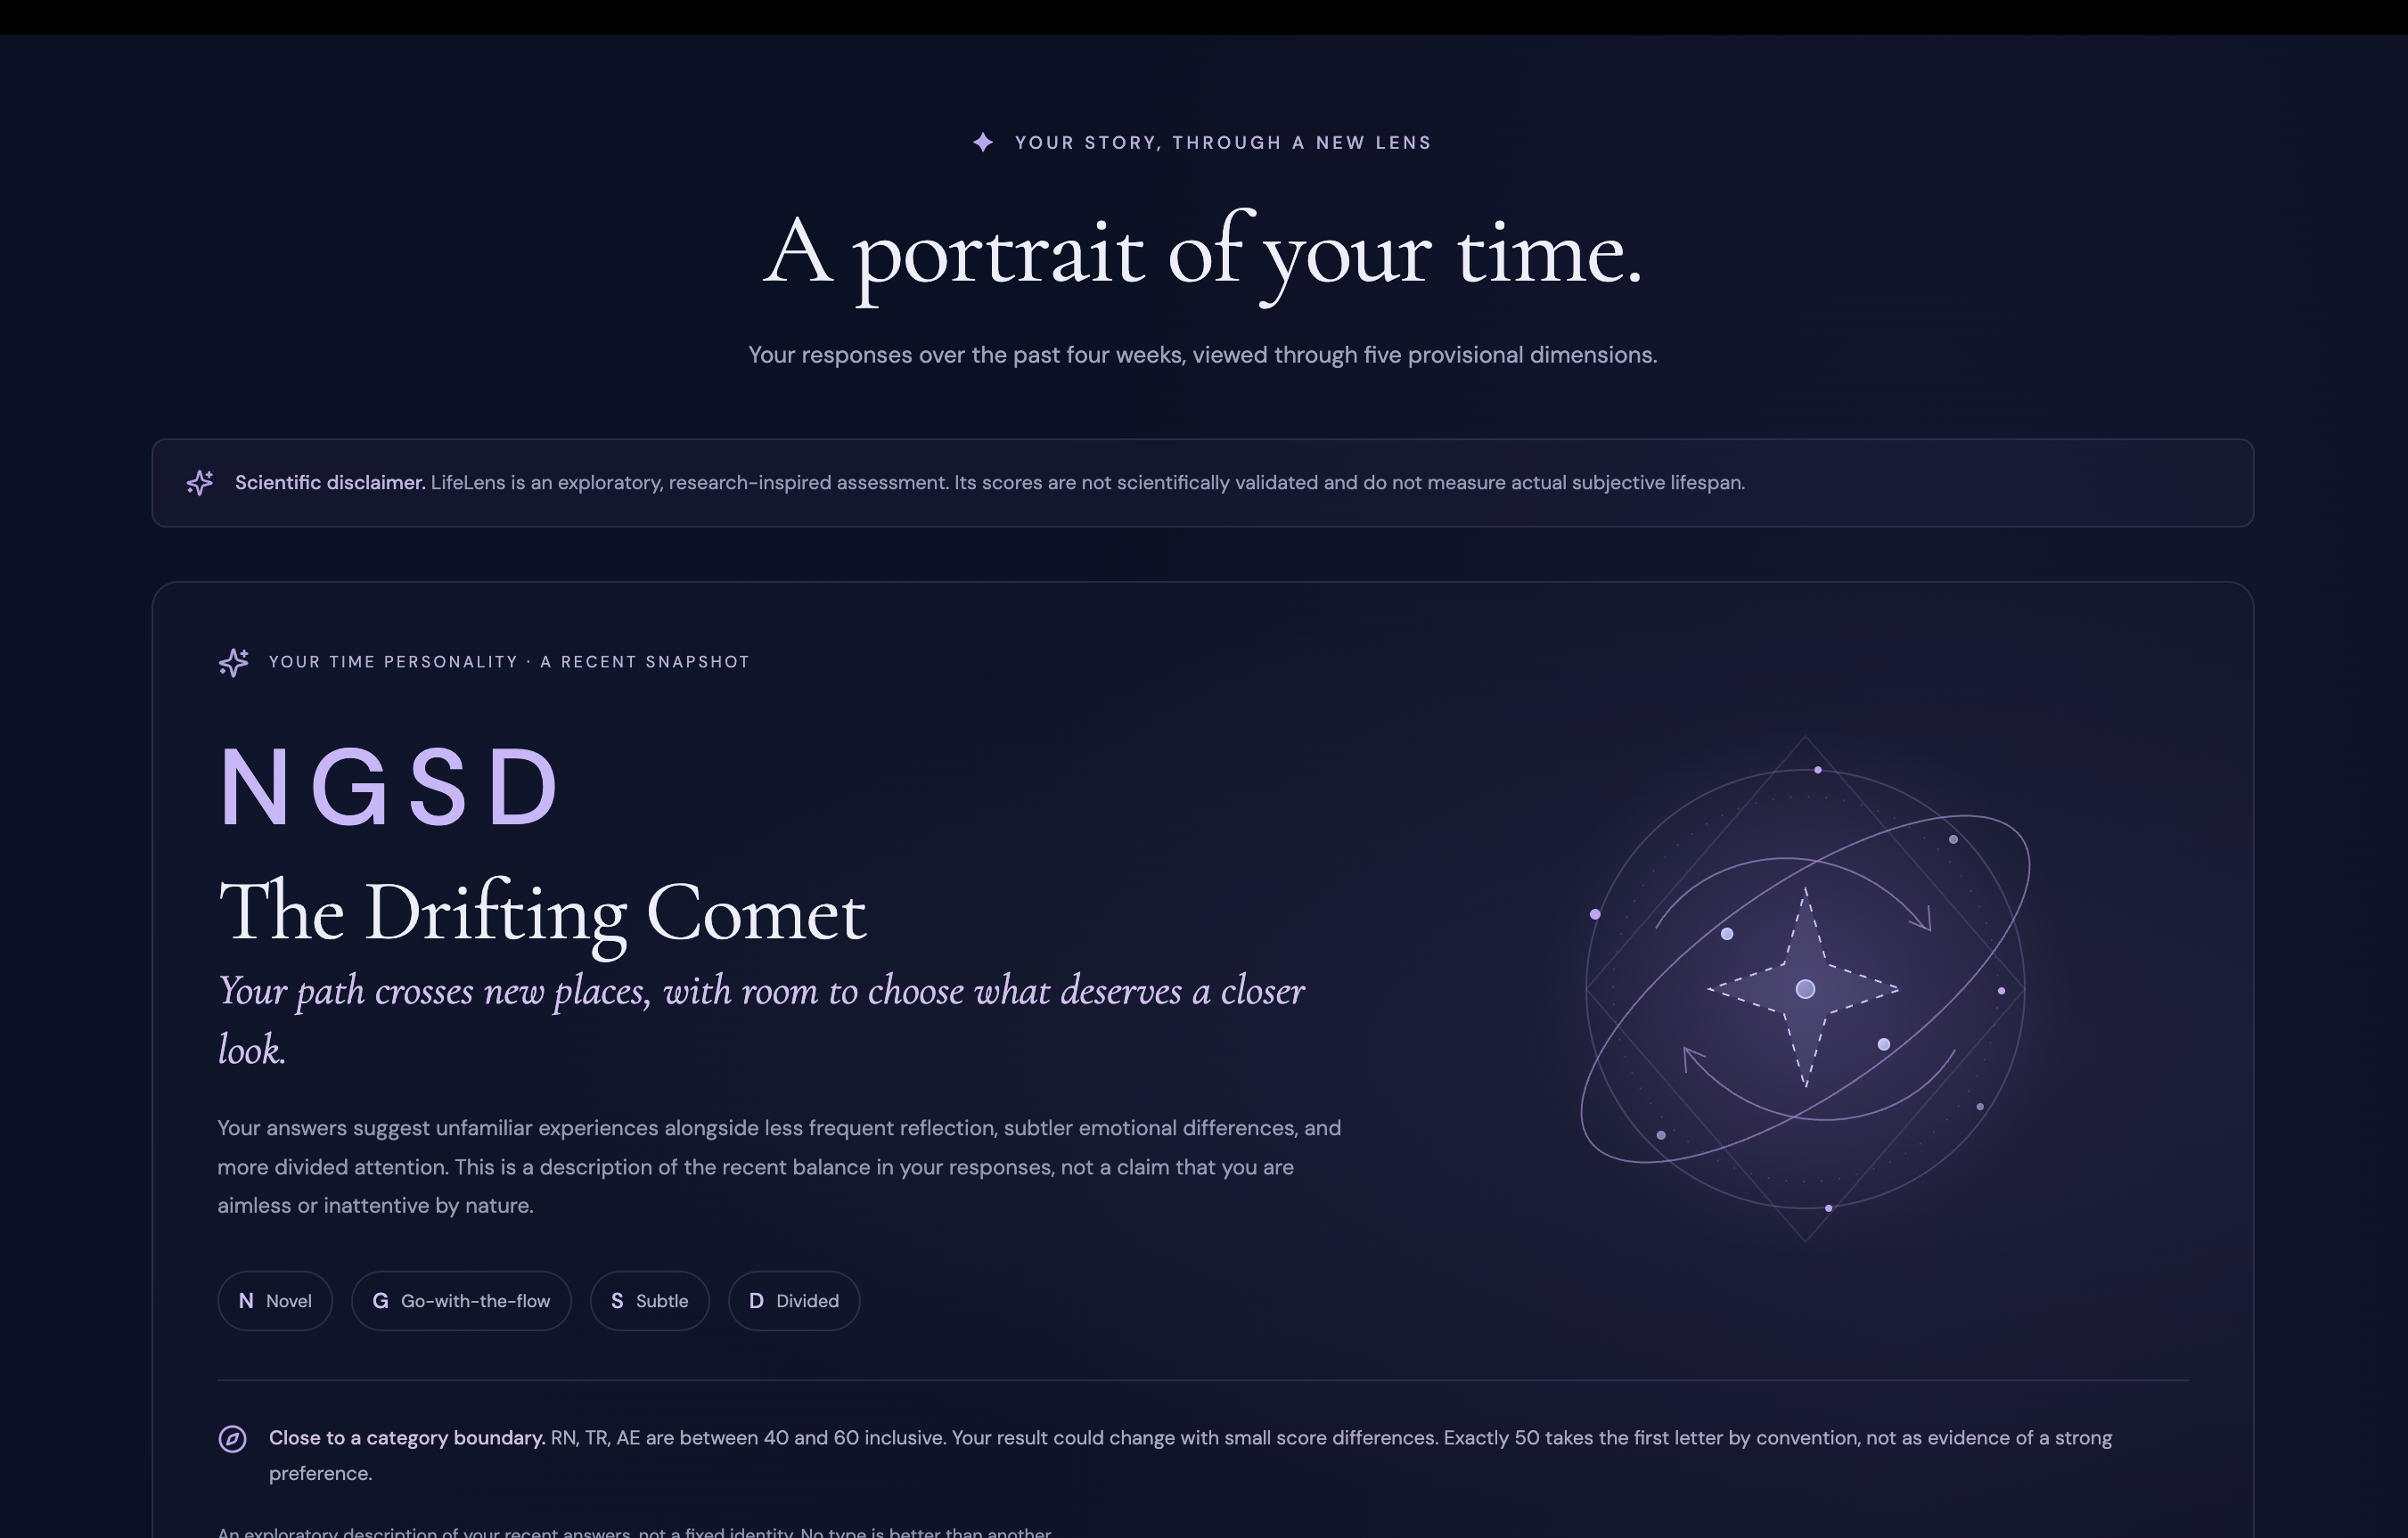
We also use these results to group users into 16 categories. Each category receives different suggestions that can help users create more meaningful experiences.
How we built it
Our questionnaire contains 20 questions, with 5 choices for each question.
We first create a (1 \times 20) response matrix for each participant. Each column represents one survey question, and the participant's choice is converted into a score from (-2) to (2).
We then create a (20 \times 4) criterion matrix. Each row represents one question, while each column represents one of our four criteria. We use (0), (1), and (2) to represent how strongly each question reflects each criterion: (0) means no relationship, (1) means some relationship, and (2) means a strong relationship.
We multiply these two matrices:
$$ \underbrace{\mathbf{r}}_{1\times20}
\underbrace{A}_{20\times4}
\underbrace{\mathbf{R}}_{1\times4} $$
This gives us four raw criterion scores, which we normalize to a (0)--(1) scale as (X_1, X_2, X_3,) and (X_4).
Then combine the four scores using weights of (0.4), (0.3), (0.2), and (0.1):
$$ C = 0.4(X_1-0.5) +0.3(X_2-0.5) +0.2(X_3-0.5) +0.1(X_4-0.5) $$
We use (C) to adjust (\alpha) from the Lemlich-inspired baseline:
$$ \alpha=0.5-0.2C $$
Finally, we calculate the participant's personalized Subjective Lifetime Midpoint:
$$ SLM=L(0.5)^{1/\alpha} $$
Challenges we ran into
One challenge was defining what we wanted to measure---the Lifetime Midpoint---and finding academic support for our four criteria.
Another challenge was assigning weights to the four criteria. Since we could not find research supporting exact weights, we currently base them on our own judgment.
We also spent time figuring out the survey scale. We considered ([1,2,3,4,5]), but eventually chose ([-2,-1,0,1,2]) because it gives us a clear neutral point at (0) and makes our calculation easier.
We thought about that whether the answer to a single question could reflect more than one criterion. Instead of forcing each question into only one category, we use (0), (1), and (2) to represent how strongly each question contribute to each criterion. We finally rejected the idea that one question reveals something about a single criterion.
Another challenge was controlling (\alpha). Since even a small change in (\alpha) can create a large variation in the final Lifetime Midpoint, we needed to keep its adjustment within a reasonable range so that individual differences would not overpower the Lemlich function.
Accomplishments that we're proud of
1. 16 different user profiles.
Similar to MBTI, our four dimensions can create 16 different categories. Instead of only giving users a number, we tell them the whole story, like how they have been experiencing their life. Different suggestions are given to encourage them live a fresher life.
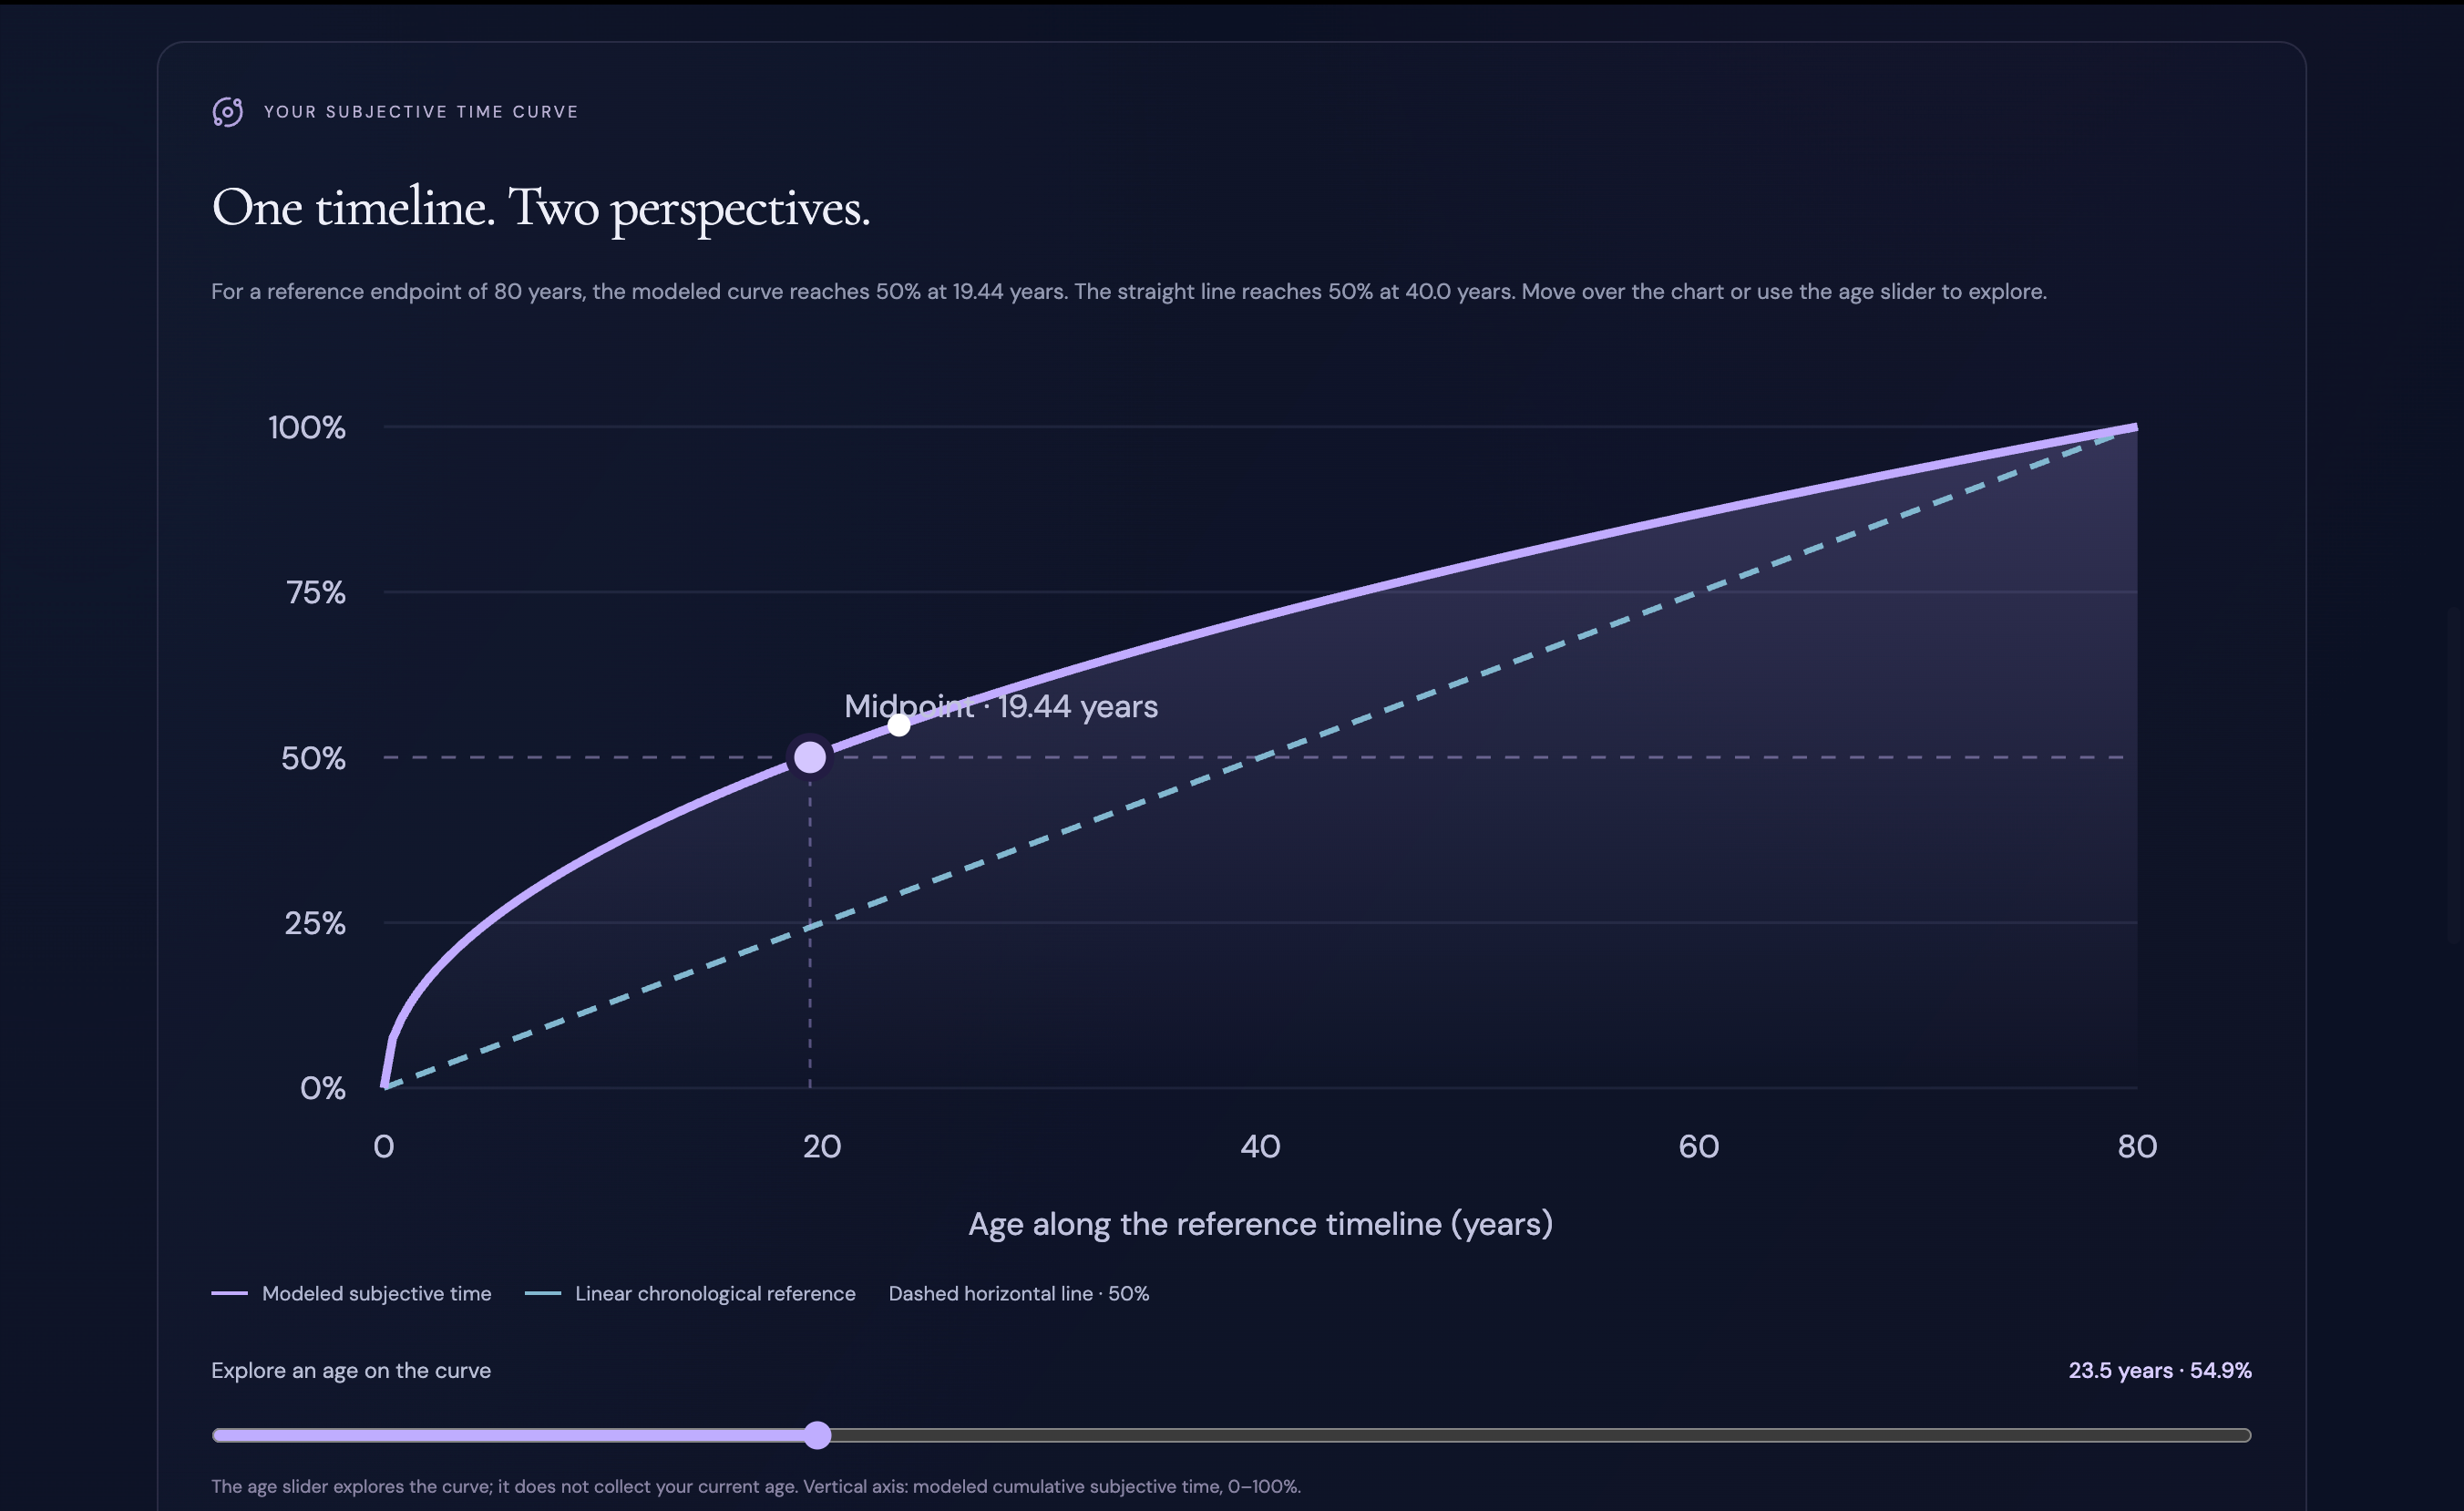
2. Two curves.
On our website, we show two curves. One is based on Lemlich's original idea, while the other also considers the combination of Lemlich's function and user's survey results. By comparing them, users can clearly see how their personal experiences matters in shifting their Subjective Lifetime Midpoint.
3. Exploring how lifestyle changes can shift the midpoint.
We also let users change different lifestyle factors and see how their projected midpoint changes through our fitted model. Our website does not just give users a result. It also lets them explore what they could change their life in a positive way.
What we learned
We learned that matrices can be really useful for turning survey responses into measurable scores across different criteria.
We also learned that even though we are building our own model, we still need to look for academic support before deciding which factors to include.
Finally, the mathematical function needs to be compatible with the model we propose, so we had to make sure our calculations and assumptions worked well together.
We learned that turning a psychological idea into a mathematical model is much harder than simply finding a formula. We had to think carefully about how to define our concept, design the questionnaire, turn responses into numbers, and control how much each factor changes the final result.
We also learned the importance of separating what is supported by previous research from the assumptions we made when building our own model.
What's next for Untitled
1. Compare our model with users' own perceptions.
Besides the 20 questions used in our model, we added 2 questions for informal validation. We hope users can compare their answers to these questions with the Subjective Lifetime Midpoint predicted by our model.
2. Conduct formal model validation.
We hope to collect more data to test whether our four criteria actually predict differences in subjective lifetime experience. This could also help us improve the current criterion weights and the adjustment of (\alpha).

Log in or sign up for Devpost to join the conversation.