FlowState
Inspiration
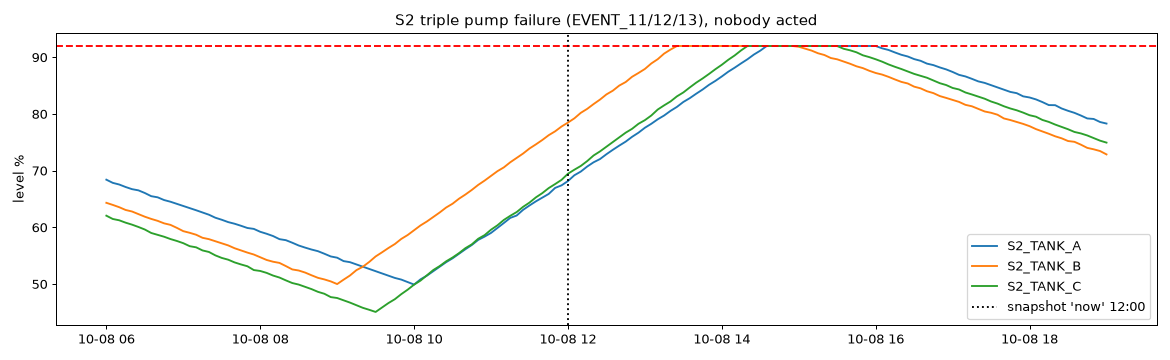
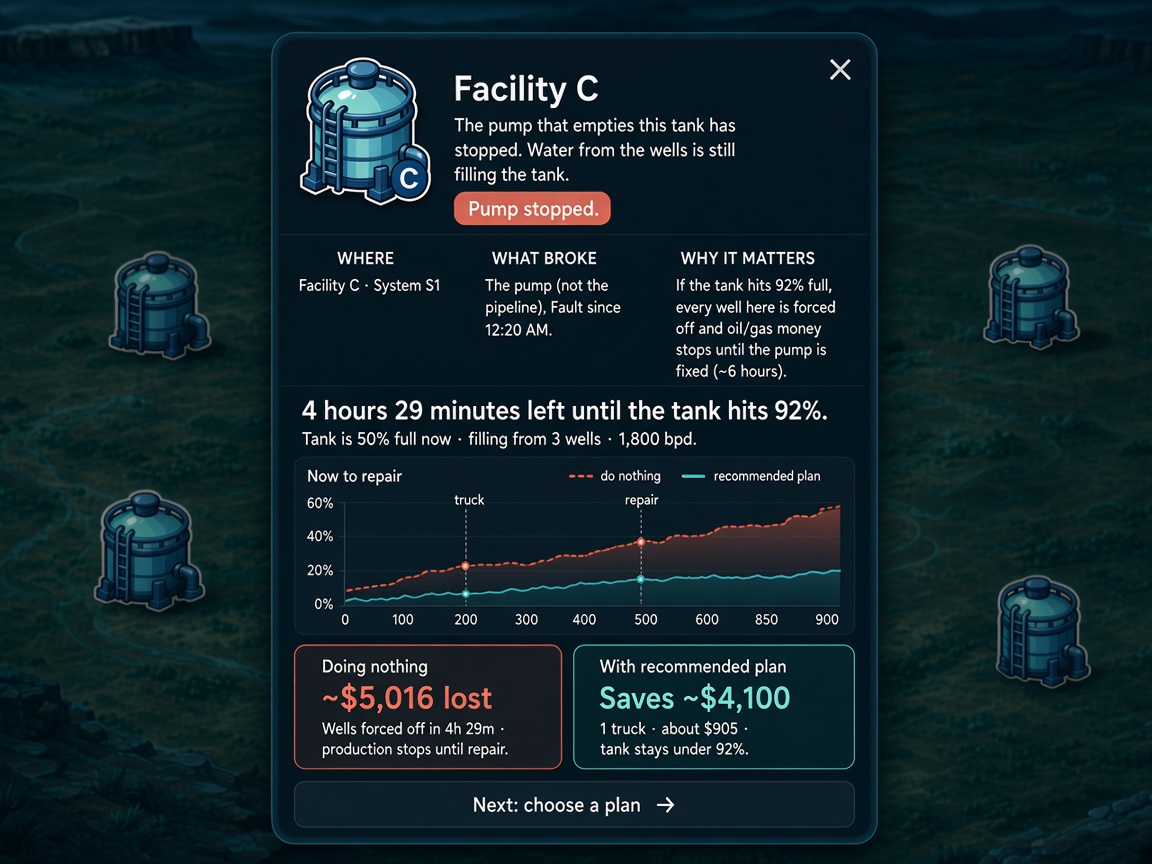
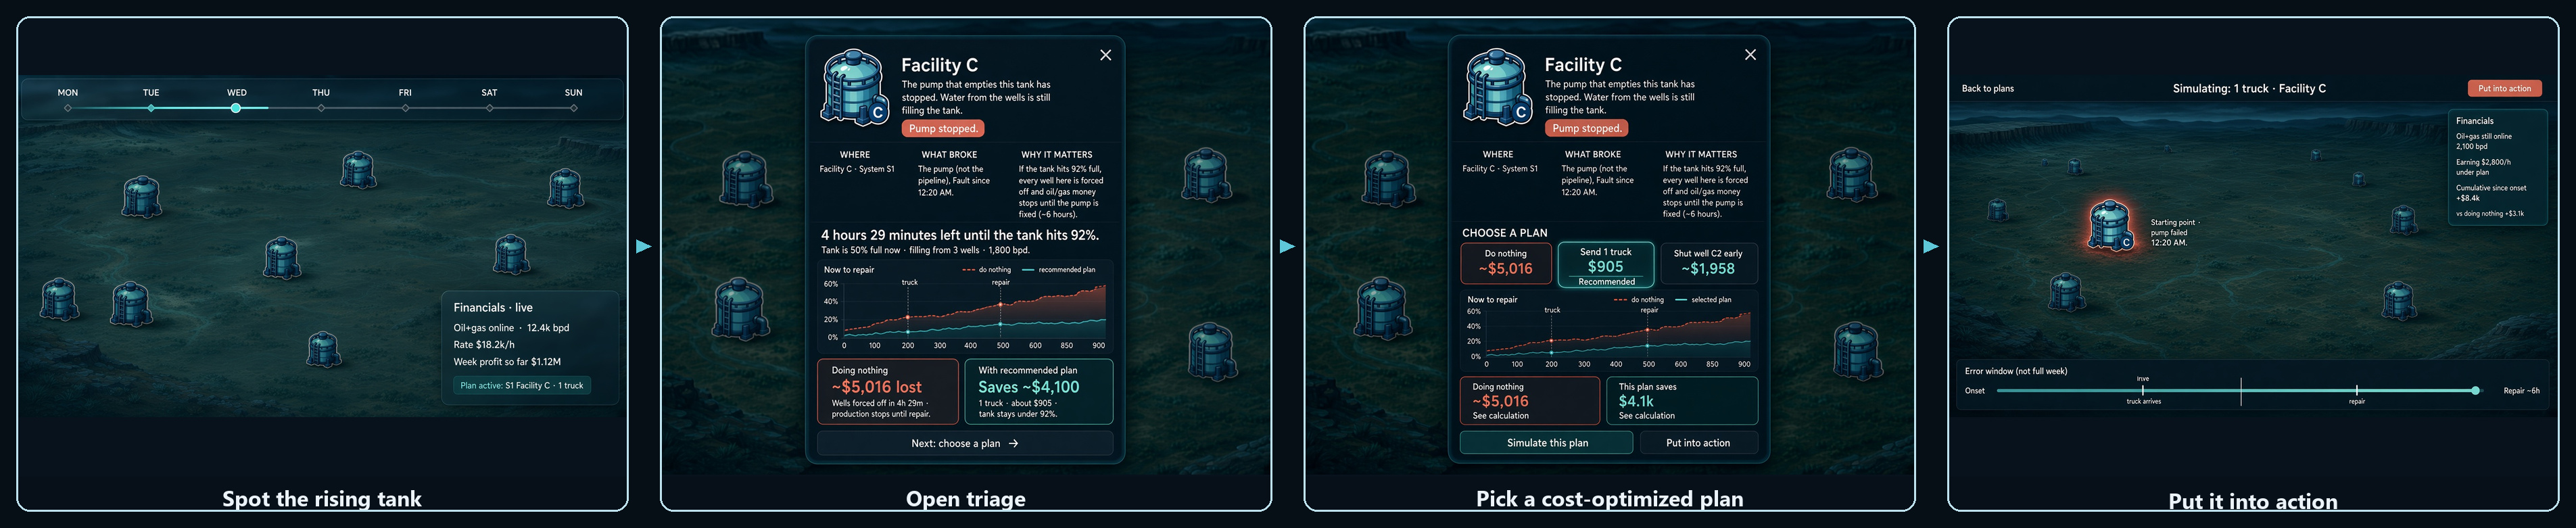
Oil keeps flowing only if water keeps moving. In the Permian, produced water fills tank batteries every hour of the night. When a pump dies, the tank climbs toward the 92% trip point and then every well on that pad is forced off and oil and gas revenue stops until repair. Night guards don’t need another dashboard full of charts but instead need a calm, map-first console that answers three questions fast: what broke, how long until shut-in, and what should I do right now. That pressure, racing a rising tank before the field goes quiet, is what shaped FlowState.
What it does
FlowState reads a live produced-water network and turns rising tanks into action.
- Detects pump failures, pipeline leaks, and worn pumps in the browser
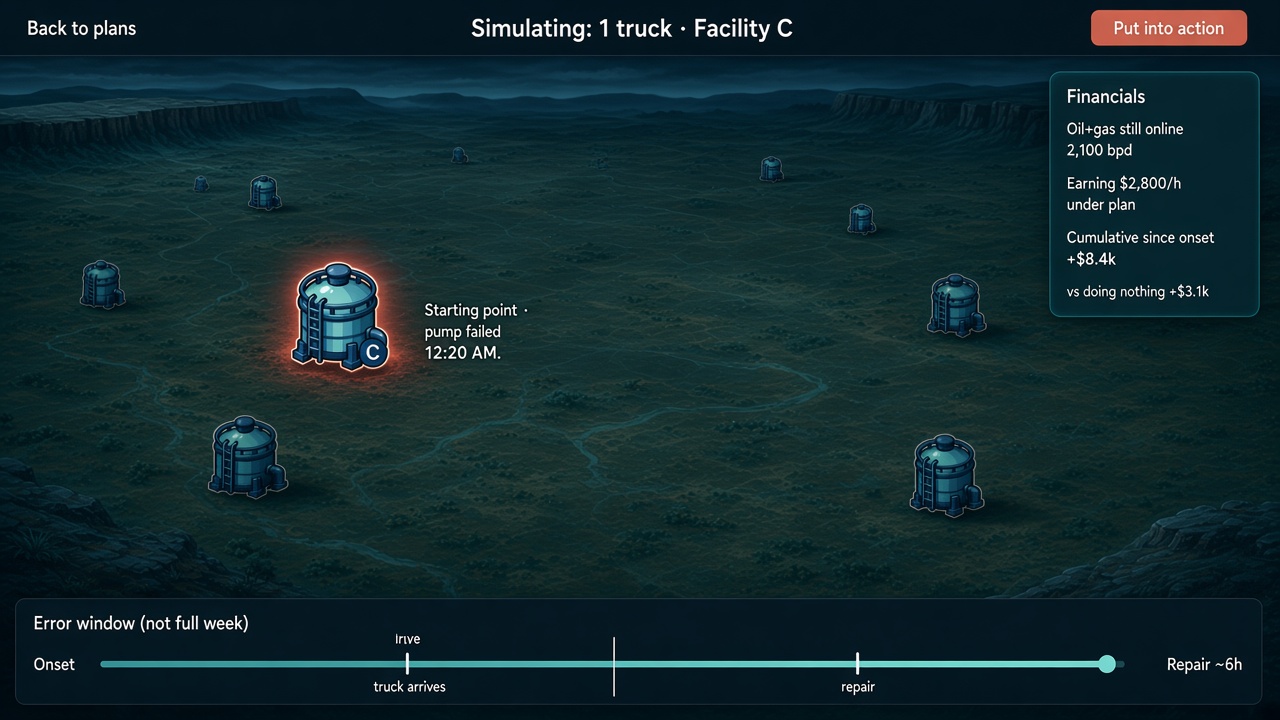
- Shows systems S1–S5 on a map with tanks, wells, oil centers, trucks, and flowing pipes
- Opens status cards anytime, or Identify-> Decide -> Act triage when a pump has failed
- Plans trucks, early shut-ins, or wait, with cost, peak tank level, and “doing nothing” comparison
- Scrubs the week on a timeline so you can replay the shift and watch financials update
- Includes Alerts, Plan, Trends, Crew handoffs, Drive (3D hauls), and Oil Tycoon
How we built it
A Vite + React + TypeScript app. Detection and planning run entirely in the browser on network.json, ops.json, and telemetry.csv, with no answer keys. Framer Motion and custom glass/navy cards carry the FlowState UI; React Three Fiber powers Drive and Tycoon; Recharts powers Trends. The map uses SVG stickers, liquid Enchantress-style meters, and soft steam plumes for atmosphere.
Challenges we ran into
Telemetry weeks are dense. We had to keep detection + planning fast enough that scrubbing the timeline still felt live. The map fought for space: MENU, financials, legend, dock, hover cards, and triage all wanted the same corners, so we killed the top bar, moved dataset controls into the rail, and reserved float zones. The early glossy reflective cards looked premium but overflowed the viewport and clashed with the ops aesthetic; we rebuilt flat panels that still fit. Drive was its own fight: physics vibration, green/z-fighting roads, and lag until we switched to kinematic hauling and clearer asphalt ribbons.
Accomplishments that we're proud of
We are proud of our intuitive UI and the interactive simulations that bring the oilfield operations to life. Our system turns complex operational data into clear visual insights, which makes it easier to understand problems and explore possible solutions. We are also proud of the games and interactive elements we created to make the experience more engaging!
What we learned
We learned how to turn complex operational data into actionable insights through real-time simulations, failure detection, and cost-based decision-making. We also gained experience balancing technical functionality with an interactive UI, while working together on this multi-faceted tool that makes a large amount of complicated data easier to understand and act on from the point of view of a night guard.
What's next for HackUTD
We want to continue refining FlowState by improving prediction accuracy, expanding our simulation capabilities to be more realistic, and making recommendations even more efficient. Beyond the hackathon, we'd love to explore how this tool could be adapted for real-world oilfield operations and help operators make faster, smarter decisions.
Built With
- framer
- gsap
- react
- three.js
- typescript
- vite

