HackTrack AI - Project Story
Inspiration
The inspiration for HackTrack AI came from the need to bridge the gap between raw racing telemetry data and actionable insights for drivers and teams. Traditional racing analytics tools often require deep technical expertise to interpret, leaving valuable performance data underutilized.
We were inspired by:
- The complexity of racing data: Modern race cars generate thousands of data points per second, but extracting meaningful insights requires sophisticated analysis
- Accessibility: Making advanced analytics accessible to drivers at all levels, not just professional teams with dedicated data engineers
- Real-time decision making: The need for instant insights during races to make strategic decisions about pit stops, tire management, and race strategy
- AI-powered insights: Leveraging machine learning and AI to automatically identify patterns, anomalies, and improvement opportunities that might be missed by manual analysis
- Driver development: Creating personalized training plans based on actual performance data to help drivers improve consistently
The vision was to create a comprehensive platform that combines real-time telemetry visualization, predictive analytics, and AI-driven insights into a single, intuitive interface.
What it does
HackTrack AI is a comprehensive racing telemetry and analytics platform that transforms raw racing data into actionable insights. The platform consists of several key components:
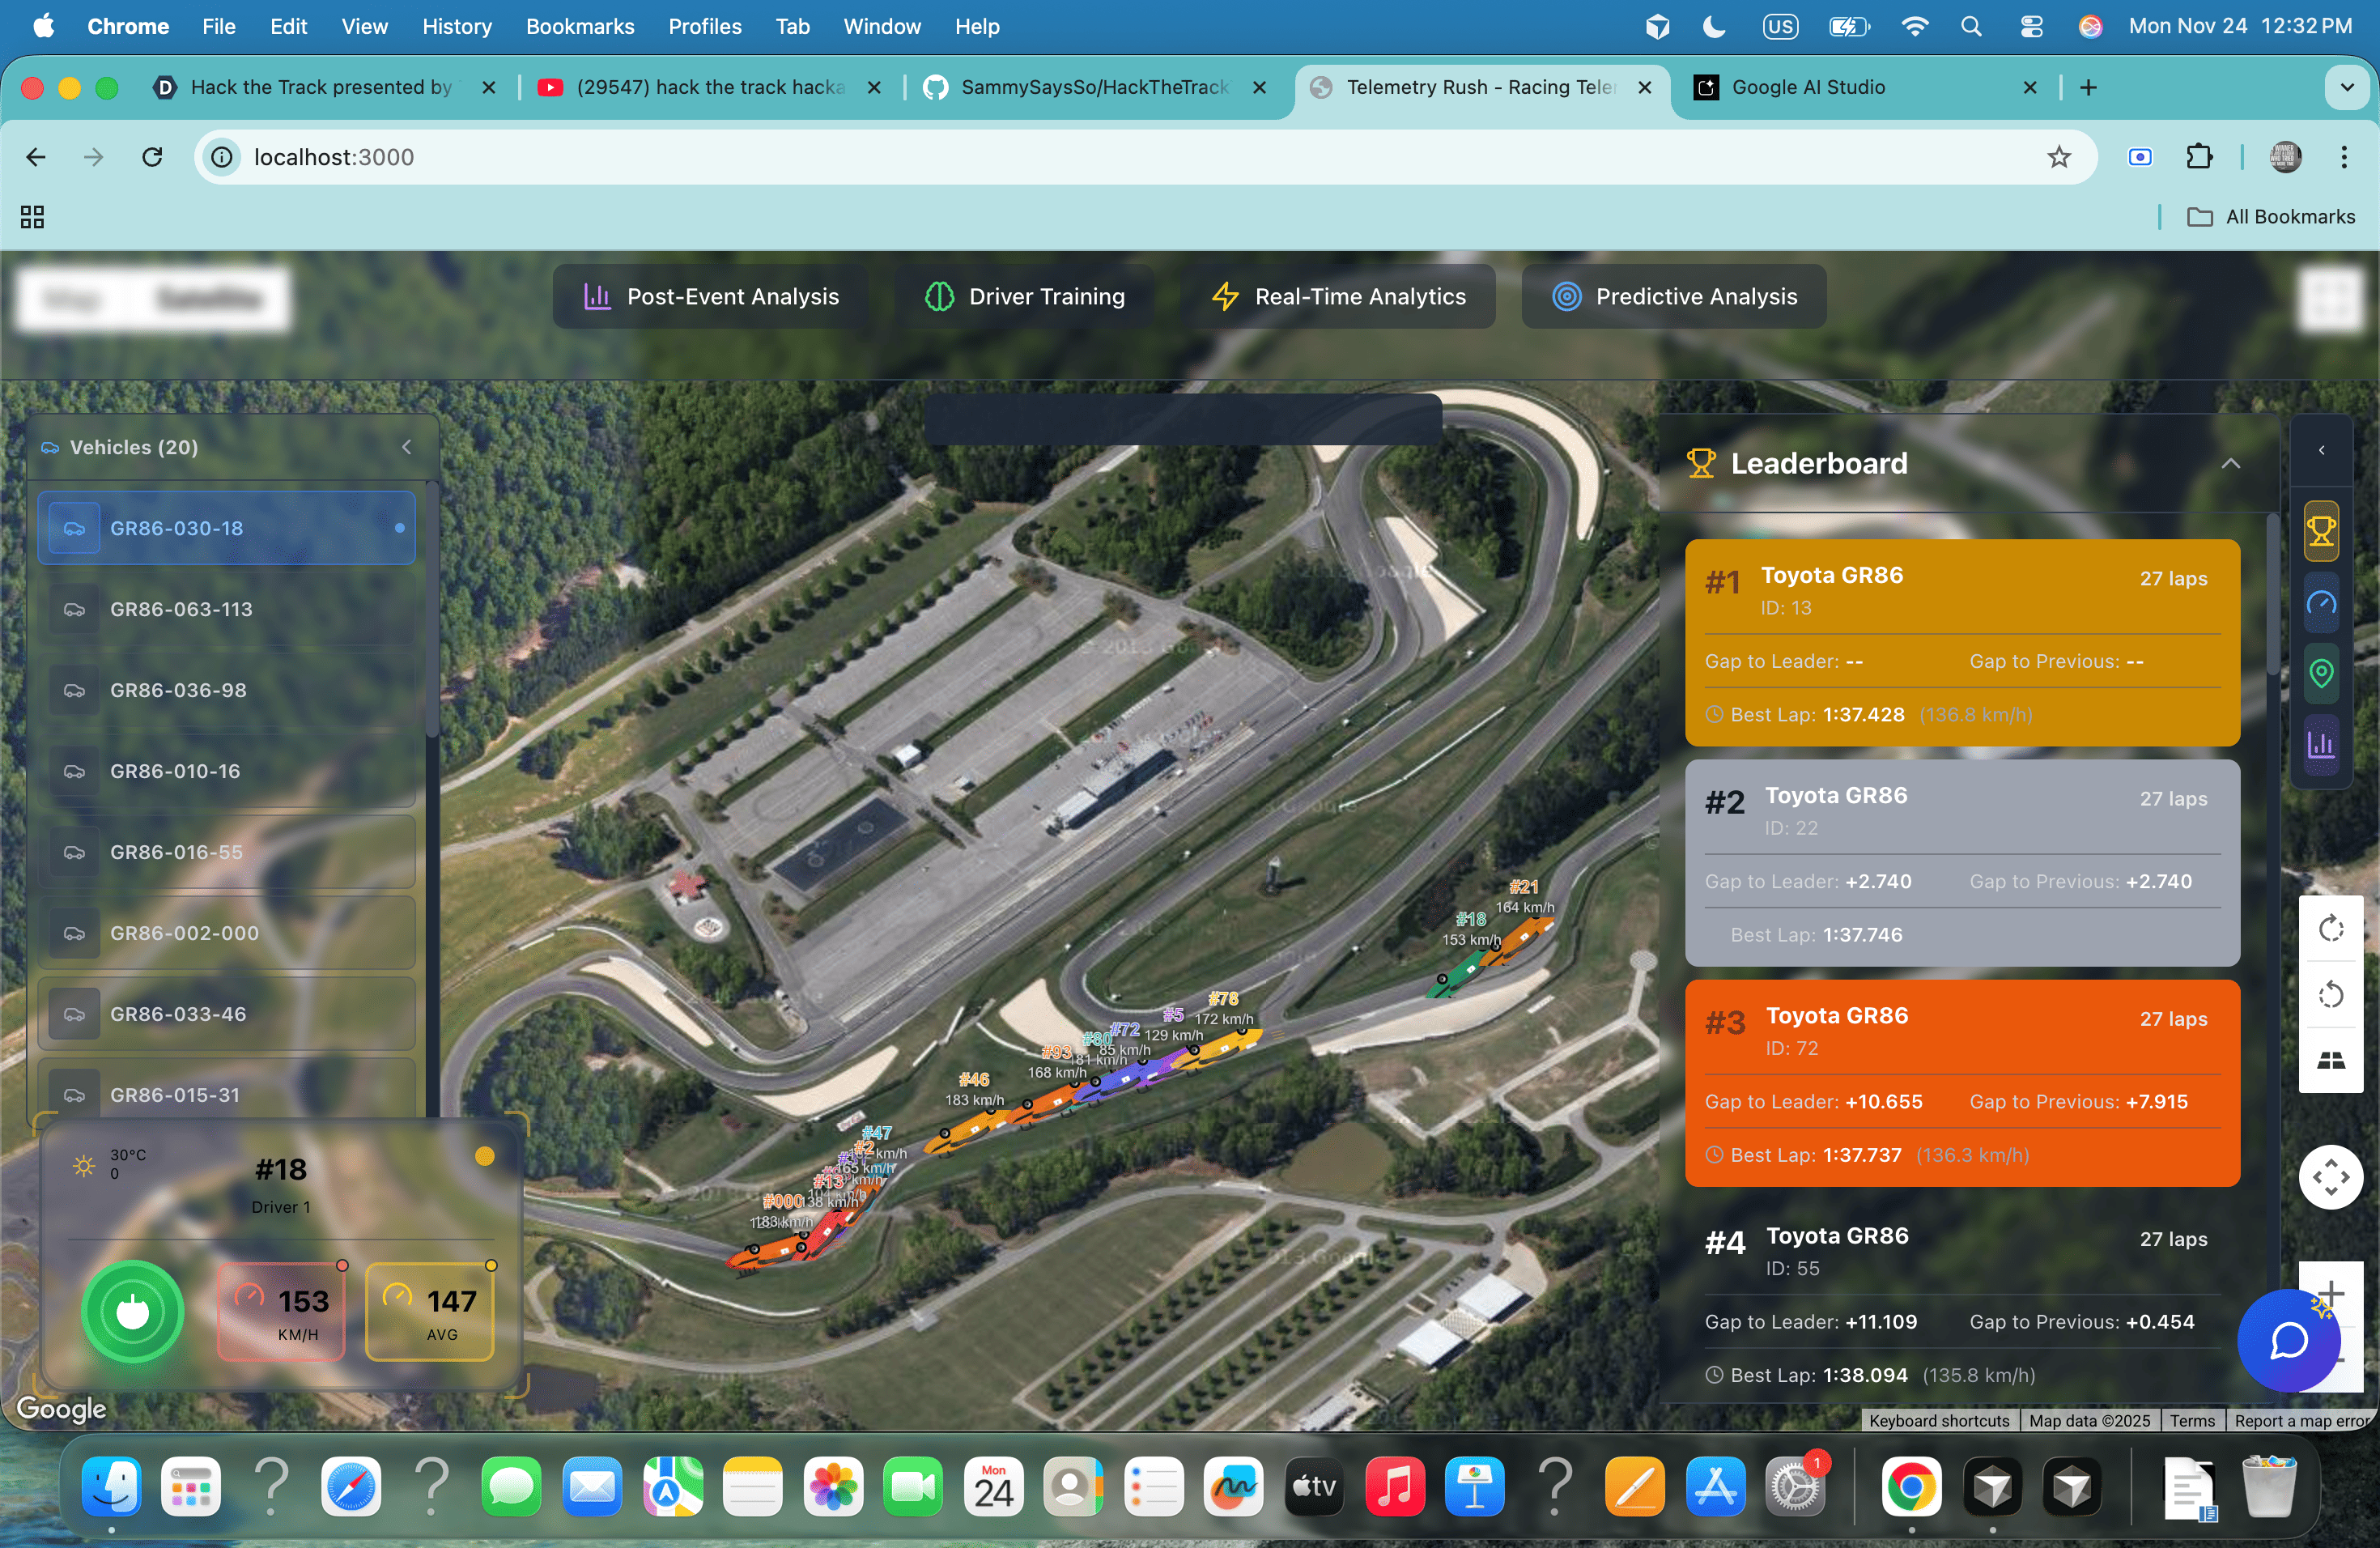
Real-Time Telemetry Visualization
- Live Track Map: Real-time GPS visualization showing vehicle positions on the track with customizable vehicle markers
- Live Telemetry Dashboard: Real-time monitoring of speed, throttle, brake, RPM, and other critical vehicle parameters
- Leaderboard: Live race standings with position changes and lap times
- Vehicle Selection: Easy switching between multiple vehicles to compare performance
Predictive Analytics
- Lap Time Prediction: Machine learning models predict future lap times based on historical performance
- Stint Simulation: Simulate different race strategies (with/without pit stops) to optimize race plans
- Performance Trajectory: Predict performance degradation over time to plan optimal pit stop windows
- Multi-Track Support: Pre-trained models for multiple race tracks (Barber Motorsports Park, Circuit of the Americas, Road America, Sonoma, Virginia International Raceway)
Driver Training & Insights
- Racing Line Analysis: Compare racing lines between laps with GPS visualization and deviation heatmaps
- Sector Analysis: Break down performance by track sectors to identify specific improvement areas
- Braking Analysis: Analyze braking points, efficiency, and consistency across corners
- Cornering Performance: Detailed analysis of corner entry/exit speeds and lateral G-forces
- Personalized Training Plans: AI-generated training plans with specific focus areas and exercises
- Best/Worst Lap Comparison: Identify what makes fast laps fast and slow laps slow
Post-Event Analysis
- Race Narrative: AI-generated comprehensive race story highlighting key moments and strategic decisions
- Performance Deviations: Compare predicted vs. actual performance to identify anomalies
- Strategic Moments: Automatic detection of pit stops, position changes, and critical race events
- Driver Classification: Categorize driver performance (consistent, improving, declining) based on lap time trends
AI-Powered Insights
- Gemini AI Integration: Advanced AI analysis providing natural language insights and recommendations
- Pattern Recognition: Automatic detection of performance patterns and anomalies
- Actionable Recommendations: Specific, data-driven suggestions for improvement
- Risk Assessment: Identify potential issues before they become problems
Technical Features
- WebSocket Real-Time Streaming: Low-latency data streaming for live telemetry
- RESTful API: Comprehensive backend API for all analytics endpoints
- Responsive Web Interface: Modern, mobile-friendly UI built with React and TypeScript
- 3D Track Visualization: Immersive 3D track rendering with vehicle positions
- Data Export: Export analysis results and telemetry data for further processing
How we built it
Backend Architecture
Technology Stack:
- FastAPI: Python web framework for building high-performance REST APIs
- Pandas & NumPy: Data manipulation and numerical computations
- Scikit-learn: Machine learning models for predictive analytics
- Joblib: Model serialization and loading
- WebSockets: Real-time bidirectional communication
- Python 3.14: Latest Python features for optimal performance
Key Components:
Telemetry Processing Pipeline
- Real-time WebSocket handlers for telemetry, endurance, and leaderboard data
- Data normalization and validation
- Efficient data storage and retrieval
Predictive Models
- Pre-trained ML models for each track (
.pklfiles) - Feature-engineered datasets (
.parquetfiles) - Model inference endpoints for lap time prediction
- Stint simulation algorithms
- Pre-trained ML models for each track (
Analytics Engine
- Racing line comparison using GPS coordinate analysis
- Sector-by-sector performance breakdown
- Braking zone detection and analysis
- Cornering performance metrics calculation
AI Integration
- Google Gemini API integration for natural language insights
- Context-aware prompt engineering
- Structured response parsing and formatting
Data Processing
- CSV parsing for race results and telemetry data
- GPS coordinate processing for track visualization
- Time-series analysis for performance trends
- Statistical analysis for consistency metrics
Frontend Architecture
Technology Stack:
- React 18: Modern React with hooks and context API
- TypeScript: Type-safe development
- Vite: Fast build tool and development server
- Tailwind CSS: Utility-first CSS framework
- Recharts: Data visualization library
- Three.js: 3D graphics for track visualization
- Lucide React: Icon library
Key Components:
Real-Time Visualization
- WebSocket client connections for live data
- State management with Zustand
- Optimized rendering for 60fps performance
Dashboard Components
- Modular component architecture
- Responsive design for all screen sizes
- Customizable layouts and views
Data Visualization
- Interactive charts for lap times, speeds, and trends
- SVG-based racing line visualization
- Heatmaps for deviation analysis
- 3D track rendering with vehicle markers
User Interface
- Intuitive navigation between different analysis modes
- Collapsible sidebars for space efficiency
- Modal dialogs for detailed views
- Fullscreen modes for focused analysis
Data Flow
Race Data Sources (CSV files)
    ↓
Backend Processing (FastAPI)
    ↓
├── Real-time WebSocket Stream → Frontend Live View
├── ML Model Inference → Predictive Analytics
├── Statistical Analysis → Driver Insights
└── AI Processing → Natural Language Insights
    ↓
Frontend Visualization & Interaction
Deployment
- Backend: Docker containerization with FastAPI and uvicorn
- Frontend: Static build with Nginx for production serving
- WebSocket: Persistent connections for real-time updates
- API: RESTful endpoints with JSON responses
Challenges we ran into
Technical Challenges
Real-Time Data Processing
- Challenge: Processing thousands of data points per second from multiple vehicles simultaneously
- Solution: Implemented efficient WebSocket handlers with async/await patterns, data batching, and optimized state updates
GPS Coordinate Visualization
- Challenge: Accurately rendering racing lines from GPS coordinates with proper scaling and aspect ratio
- Solution: Developed custom SVG scaling algorithms that calculate bounds dynamically and maintain track proportions
Model Integration
- Challenge: Loading and using multiple pre-trained ML models efficiently without memory issues
- Solution: Implemented lazy loading of models, model caching, and efficient feature engineering pipelines
Racing Line Comparison
- Challenge: Comparing two racing lines with different numbers of GPS points and time intervals
- Solution: Implemented point sampling algorithms and distance calculation using Haversine formula for accurate deviation measurement
Frontend Performance
- Challenge: Rendering complex visualizations with real-time updates without lag
- Solution: Optimized React rendering with memoization, virtual scrolling, and efficient state management
Data Structure Mismatches
- Challenge: Backend API responses sometimes had inconsistent structures causing frontend errors
- Solution: Implemented robust error handling, default values, and type-safe interfaces with TypeScript
Integration Challenges
AI API Integration
- Challenge: Getting consistent, structured responses from Gemini API for different analysis types
- Solution: Developed sophisticated prompt engineering with clear output formats and response parsing
Multi-Track Support
- Challenge: Supporting different tracks with varying data formats and model requirements
- Solution: Created a flexible track configuration system and standardized data processing pipelines
WebSocket Reliability
- Challenge: Maintaining stable WebSocket connections with automatic reconnection
- Solution: Implemented connection health monitoring, exponential backoff reconnection, and graceful error handling
UX Challenges
Information Overload
- Challenge: Presenting complex data without overwhelming users
- Solution: Created collapsible sections, progressive disclosure, and customizable views
Mobile Responsiveness
- Challenge: Making complex visualizations work on small screens
- Solution: Responsive design patterns, mobile-optimized layouts, and touch-friendly interactions
Accomplishments that we're proud of
Comprehensive Analytics Platform
- Successfully integrated real-time telemetry, predictive analytics, and AI insights into a single cohesive platform
- Created a one-stop solution for racing data analysis
Real-Time Performance
- Achieved sub-100ms latency for telemetry updates
- Smooth 60fps rendering of complex visualizations
- Efficient handling of multiple simultaneous data streams
Advanced ML Integration
- Successfully deployed multiple pre-trained models for different tracks
- Accurate lap time predictions with confidence intervals
- Effective stint simulation for race strategy planning
Intuitive User Interface
- Created an interface that makes complex data accessible to users at all technical levels
- Beautiful, modern design that enhances rather than distracts from the data
- Responsive design that works seamlessly across devices
Racing Line Visualization
- Developed a custom SVG-based visualization system that accurately represents track layouts
- Implemented deviation heatmaps that clearly show where drivers deviate from optimal lines
- Created interactive comparison tools for analyzing multiple laps
AI-Powered Insights
- Successfully integrated Gemini AI to provide natural language insights
- Generated actionable recommendations based on data analysis
- Created personalized training plans tailored to individual driver performance
Robust Error Handling
- Implemented comprehensive error handling throughout the application
- Graceful degradation when services are unavailable
- User-friendly error messages and recovery mechanisms
Scalable Architecture
- Built a modular architecture that can easily accommodate new features
- Efficient data processing pipelines that can handle large datasets
- Clean separation of concerns between frontend and backend
What we learned
Technical Learnings
WebSocket Optimization
- Learned the importance of batching updates and debouncing to prevent UI lag
- Discovered best practices for maintaining persistent connections with automatic reconnection
ML Model Deployment
- Gained experience in deploying pre-trained models in production environments
- Learned about feature engineering and data preprocessing for model inference
- Understood the importance of model versioning and A/B testing
Data Visualization
- Explored various approaches to visualizing complex racing data
- Learned about SVG optimization and canvas rendering trade-offs
- Discovered techniques for maintaining aspect ratios and scaling coordinates
React Performance
- Mastered React optimization techniques including memoization, useMemo, and useCallback
- Learned about virtual scrolling and lazy loading for large datasets
- Understood the importance of proper state management patterns
TypeScript Best Practices
- Learned to create comprehensive type definitions for API responses
- Discovered the value of strict typing in catching errors early
- Understood how to balance type safety with development speed
Domain Learnings
Racing Analytics
- Gained deep understanding of racing telemetry data structures
- Learned about key performance indicators in motorsports
- Understood the importance of sector analysis and consistency metrics
User Experience
- Learned that simplicity is key when presenting complex data
- Discovered the importance of progressive disclosure
- Understood how to balance information density with usability
AI Integration
- Learned about prompt engineering techniques for consistent AI outputs
- Discovered the importance of structured output formats
- Understood how to combine AI insights with traditional analytics
Process Learnings
Iterative Development
- Learned the value of building incrementally and testing frequently
- Discovered how user feedback shapes feature development
- Understood the importance of maintaining code quality while moving fast
Problem Solving
- Developed systematic approaches to debugging complex issues
- Learned to break down large problems into manageable pieces
- Discovered the value of thorough testing and validation
What's next for HackTrack AI
Short-Term Enhancements
Enhanced Real-Time Features
- Add more real-time alerts and notifications for critical events
- Implement real-time voice coaching based on telemetry data
- Add collaborative features for team analysis during races
Advanced Visualizations
- Implement more sophisticated 3D track visualization with elevation data
- Add video synchronization with telemetry data
- Create interactive replay system with synchronized data overlays
Mobile Application
- Develop native mobile apps for iOS and Android
- Optimize for tablet use in pit lane
- Add offline capabilities for remote track locations
Medium-Term Goals
Expanded ML Capabilities
- Train models on more tracks and racing series
- Implement deep learning models for more accurate predictions
- Add anomaly detection for equipment failures
Advanced Analytics
- Weather impact analysis and predictions
- Tire degradation modeling
- Fuel strategy optimization
- Pit stop timing optimization
Social Features
- Driver comparison tools
- Leaderboards and achievements
- Community-driven insights and tips
- Sharing and export capabilities
Long-Term Vision
AI Coach
- Fully autonomous AI racing coach that provides real-time guidance
- Personalized training programs that adapt to driver progress
- Predictive maintenance recommendations based on telemetry patterns
Platform Expansion
- Support for multiple racing series (Formula 1, NASCAR, IndyCar, etc.)
- Integration with popular racing simulators
- Support for amateur and club racing
Enterprise Features
- Team management and collaboration tools
- Advanced reporting and analytics dashboards
- API access for third-party integrations
- White-label solutions for racing teams
Research & Development
- Collaborate with racing teams and drivers for continuous improvement
- Contribute to motorsports data science research
- Develop new algorithms for performance optimization
Technical Improvements
Performance Optimization
- Further optimize data processing pipelines
- Implement edge computing for lower latency
- Add caching layers for frequently accessed data
Scalability
- Implement horizontal scaling for backend services
- Add database optimization for large datasets
- Implement CDN for static assets
Security & Privacy
- Enhanced data encryption
- User authentication and authorization
- GDPR compliance features
- Data anonymization options
Testing & Quality
- Comprehensive test coverage
- Performance benchmarking
- Load testing for high-traffic scenarios
- Continuous integration and deployment
Built with passion for racing and data science
HackTrack AI - Transforming racing data into winning insights
Built With
- backend-development
- data-visualization
- docker
- fastapi
- frontend-development
- google-gemini-ai
- gps-processing
- machine-learning
- numpy
- pandas
- predictive-analytics
- python
- racing-analytics
- react
- real-time-data-streaming
- recharts
- rest-api
- scikit-learn
- tailwind-css
- telemetry-analysis
- three.js
- typescript
- vite
- websockets
- zustand


Log in or sign up for Devpost to join the conversation.