-
-

WattWise Logo Banner
-

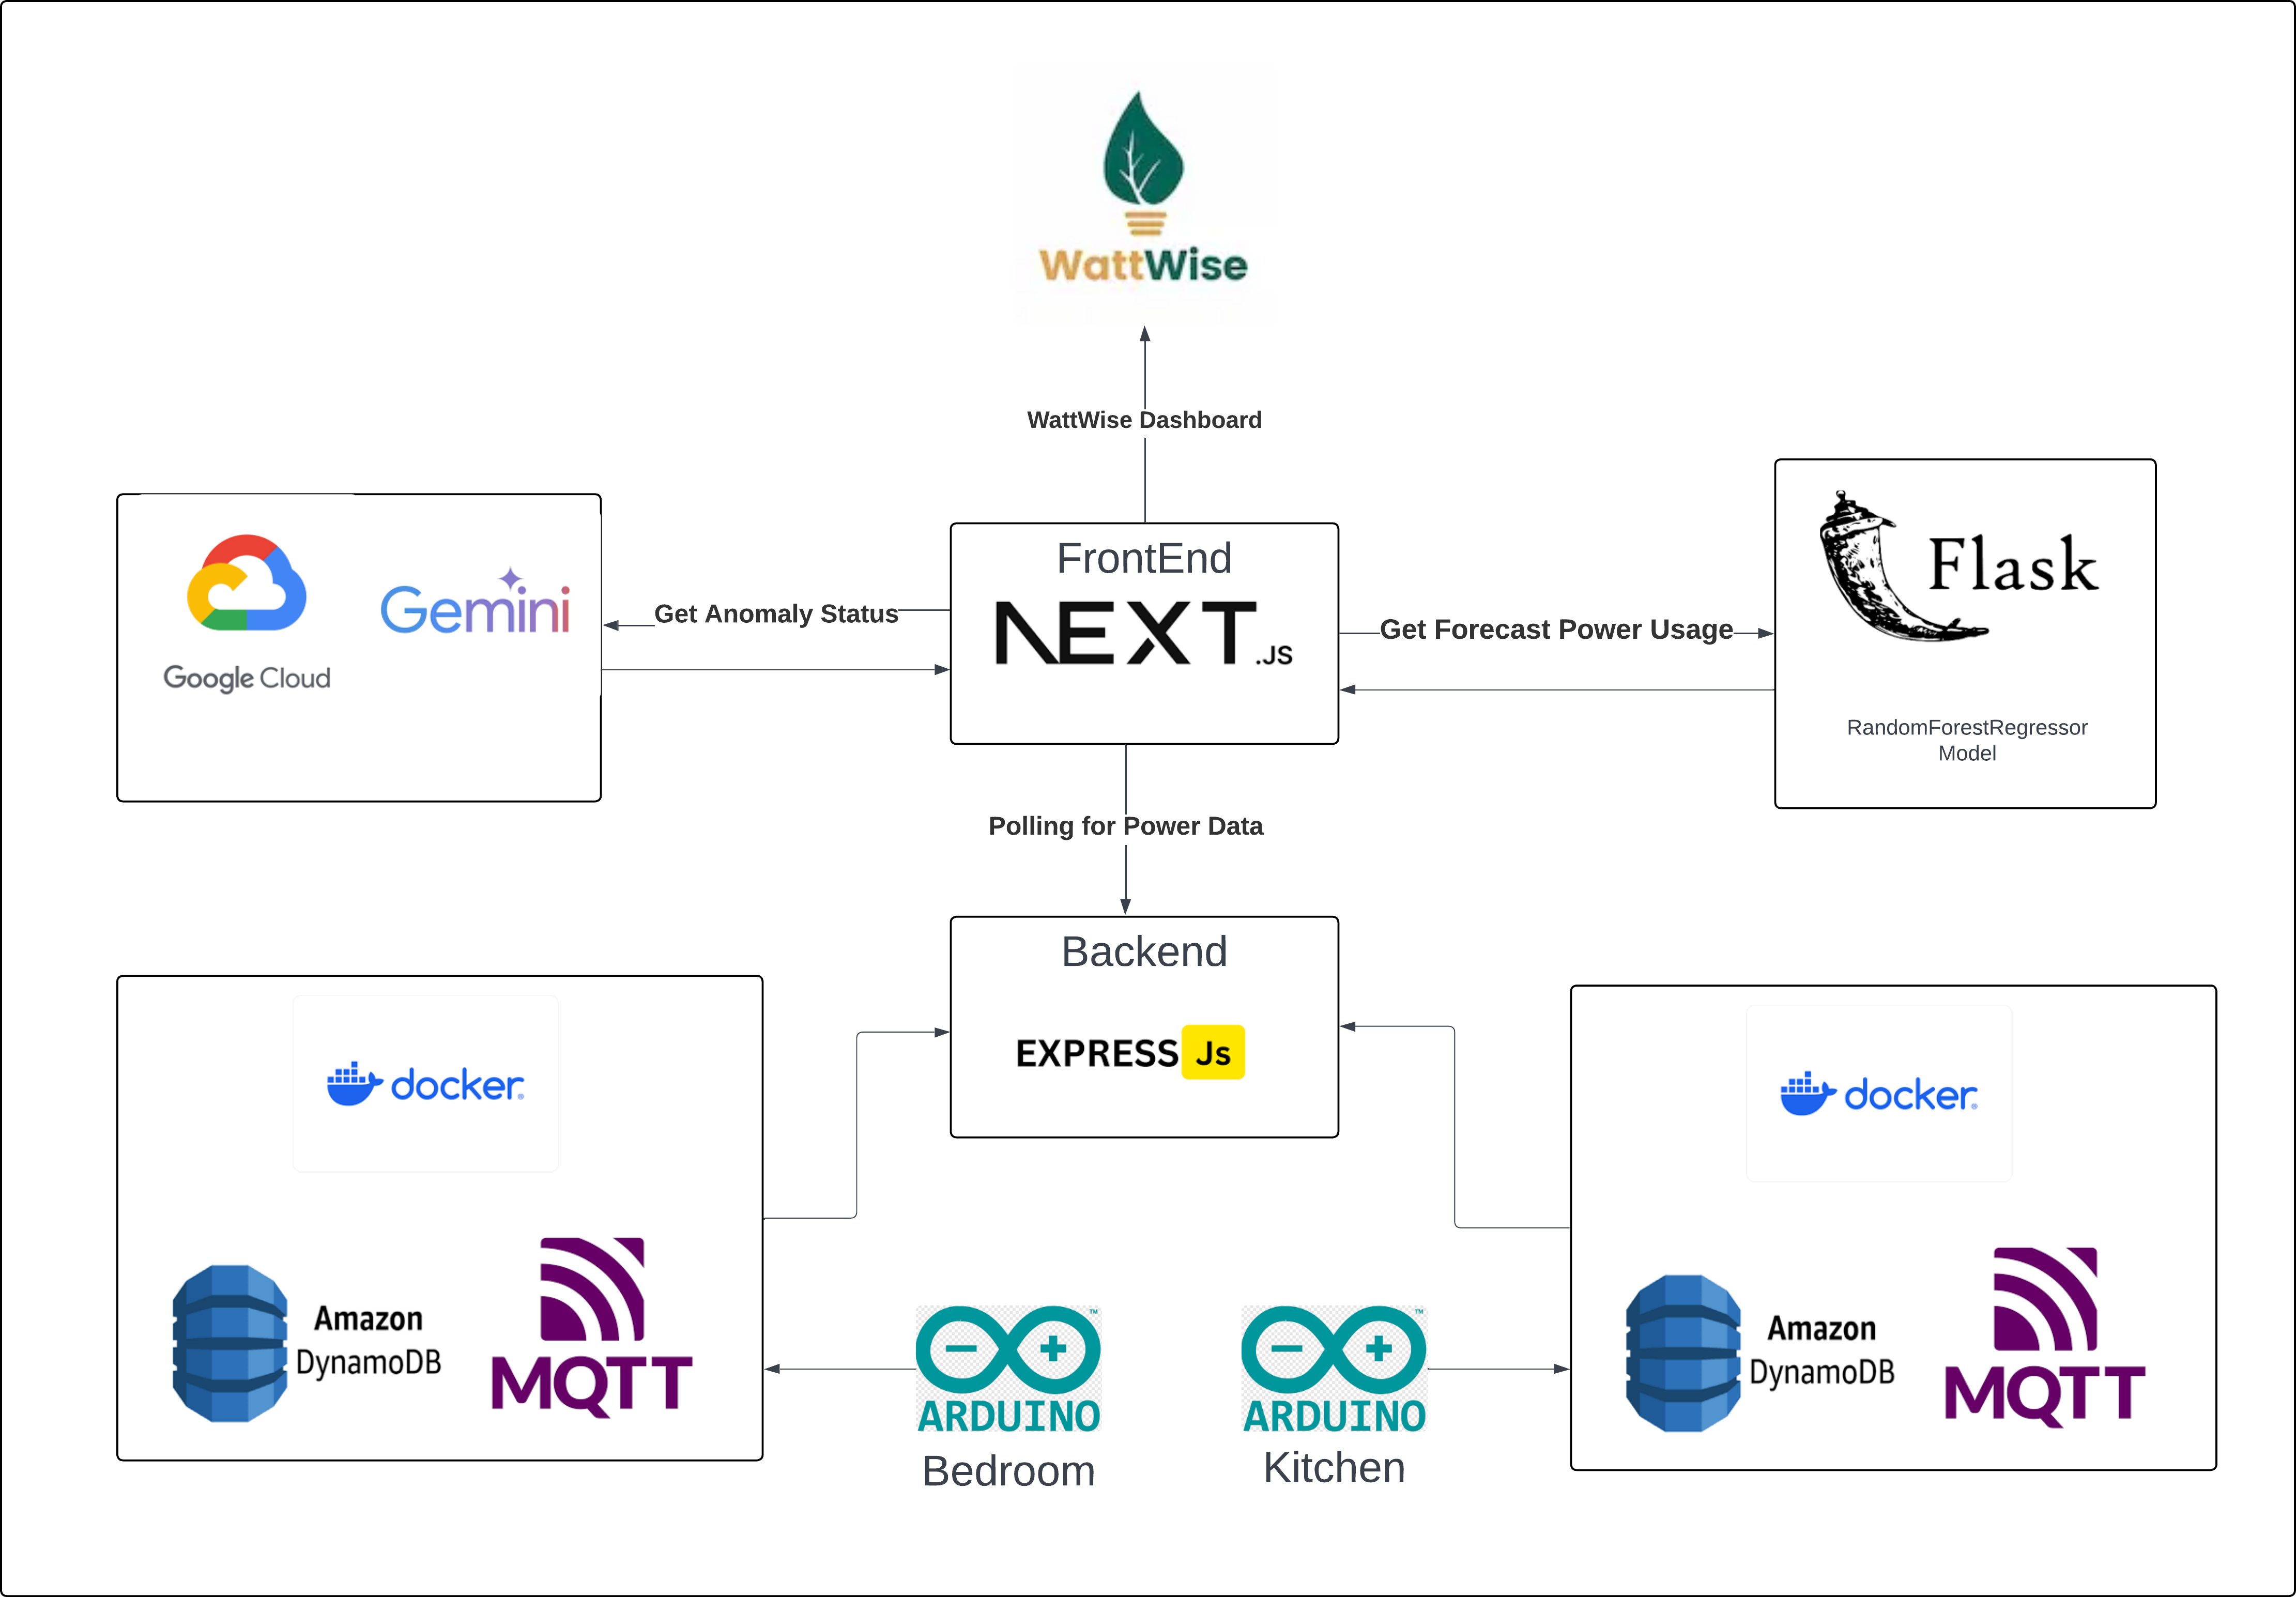
The Architecture Diagram
-
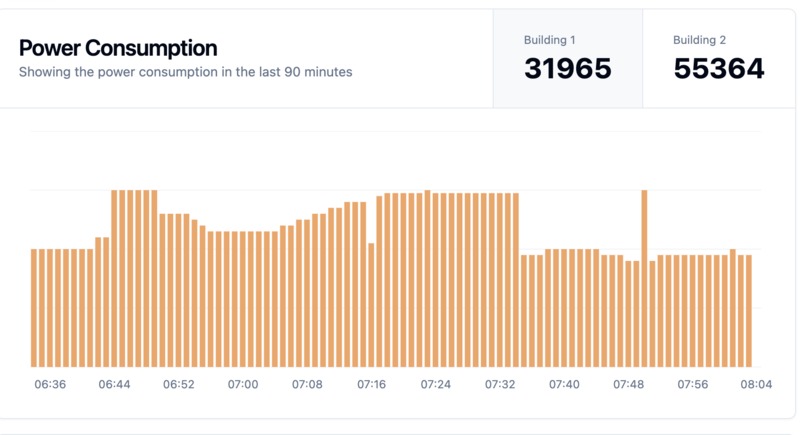
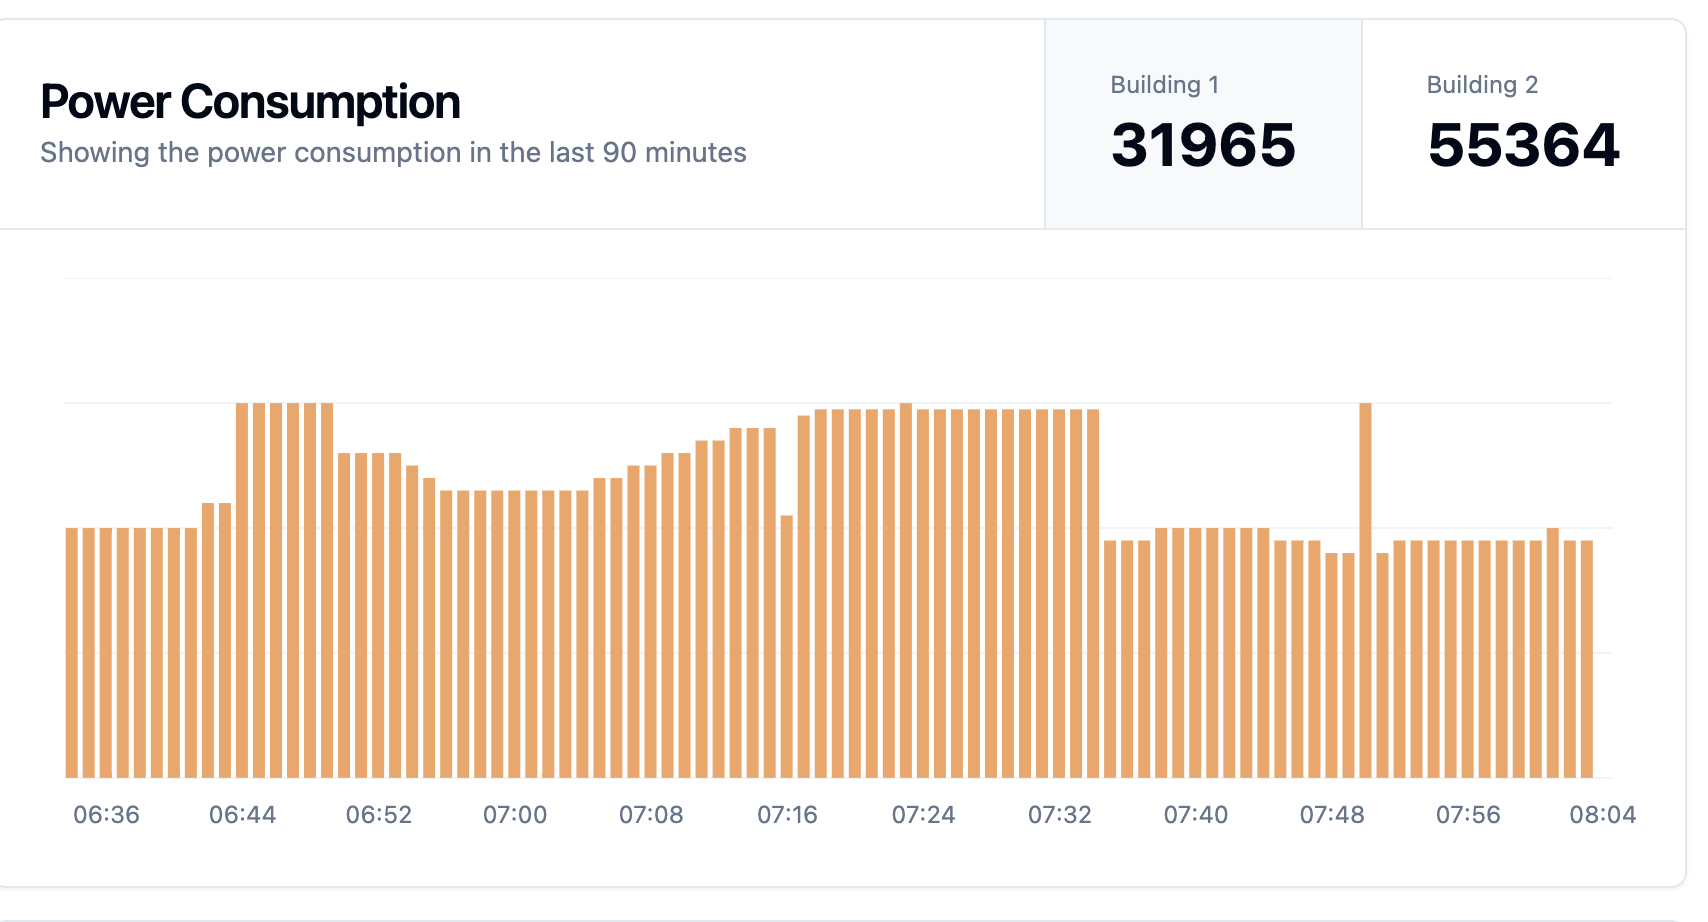
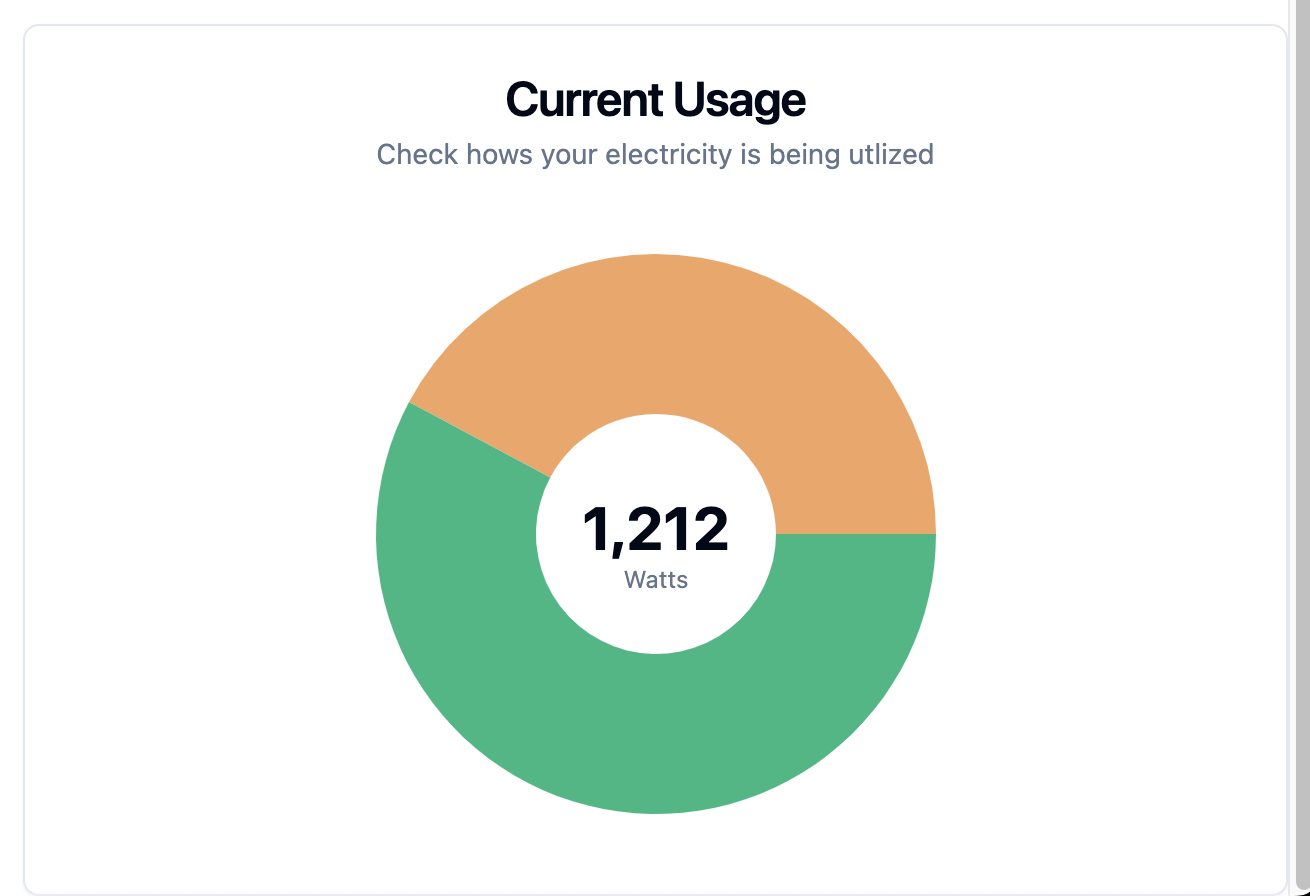
The current power usage measured by a single unit, Could be two buildings or two rooms
-
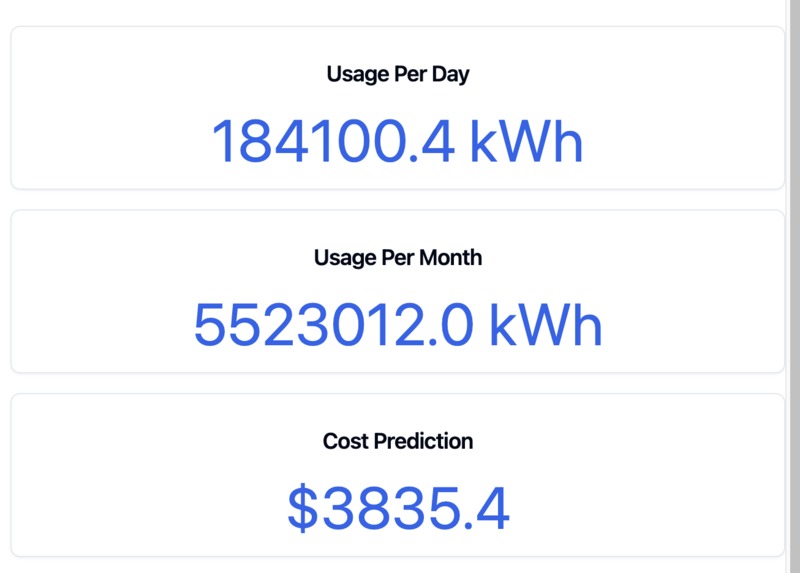
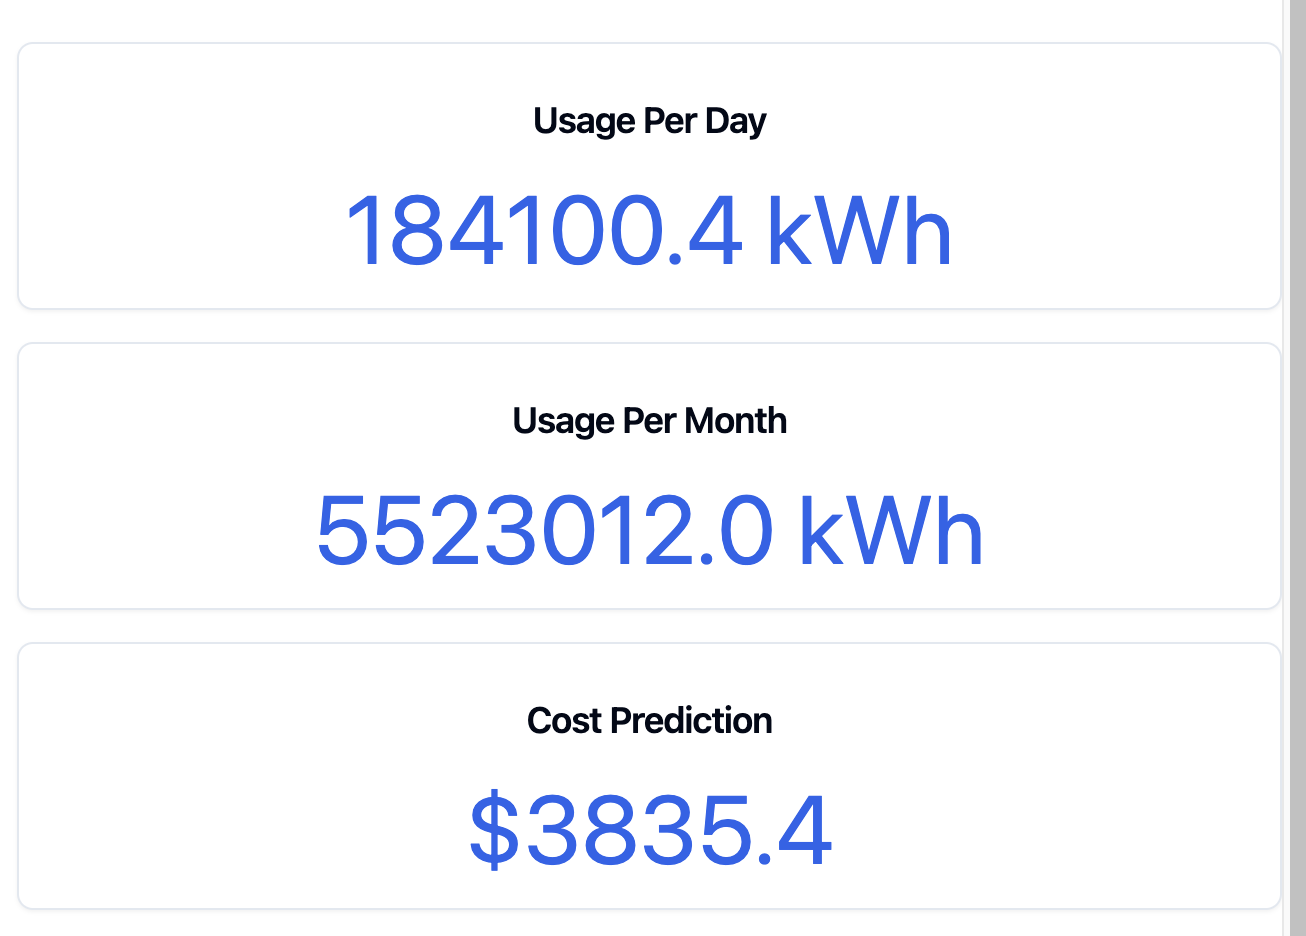
The calculated amounts of watts based on the current consumption rates
-
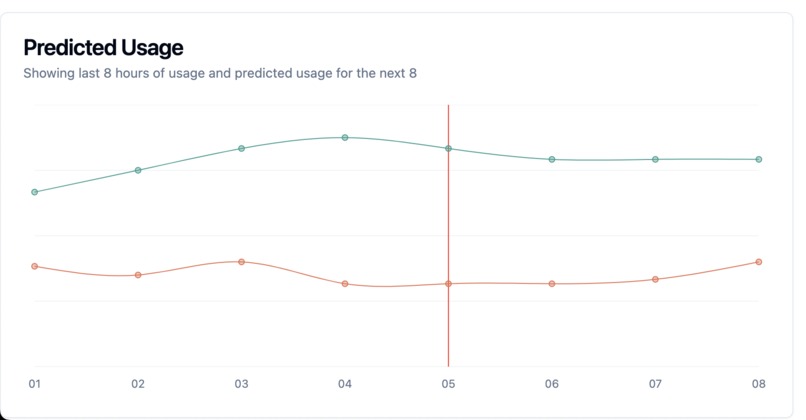
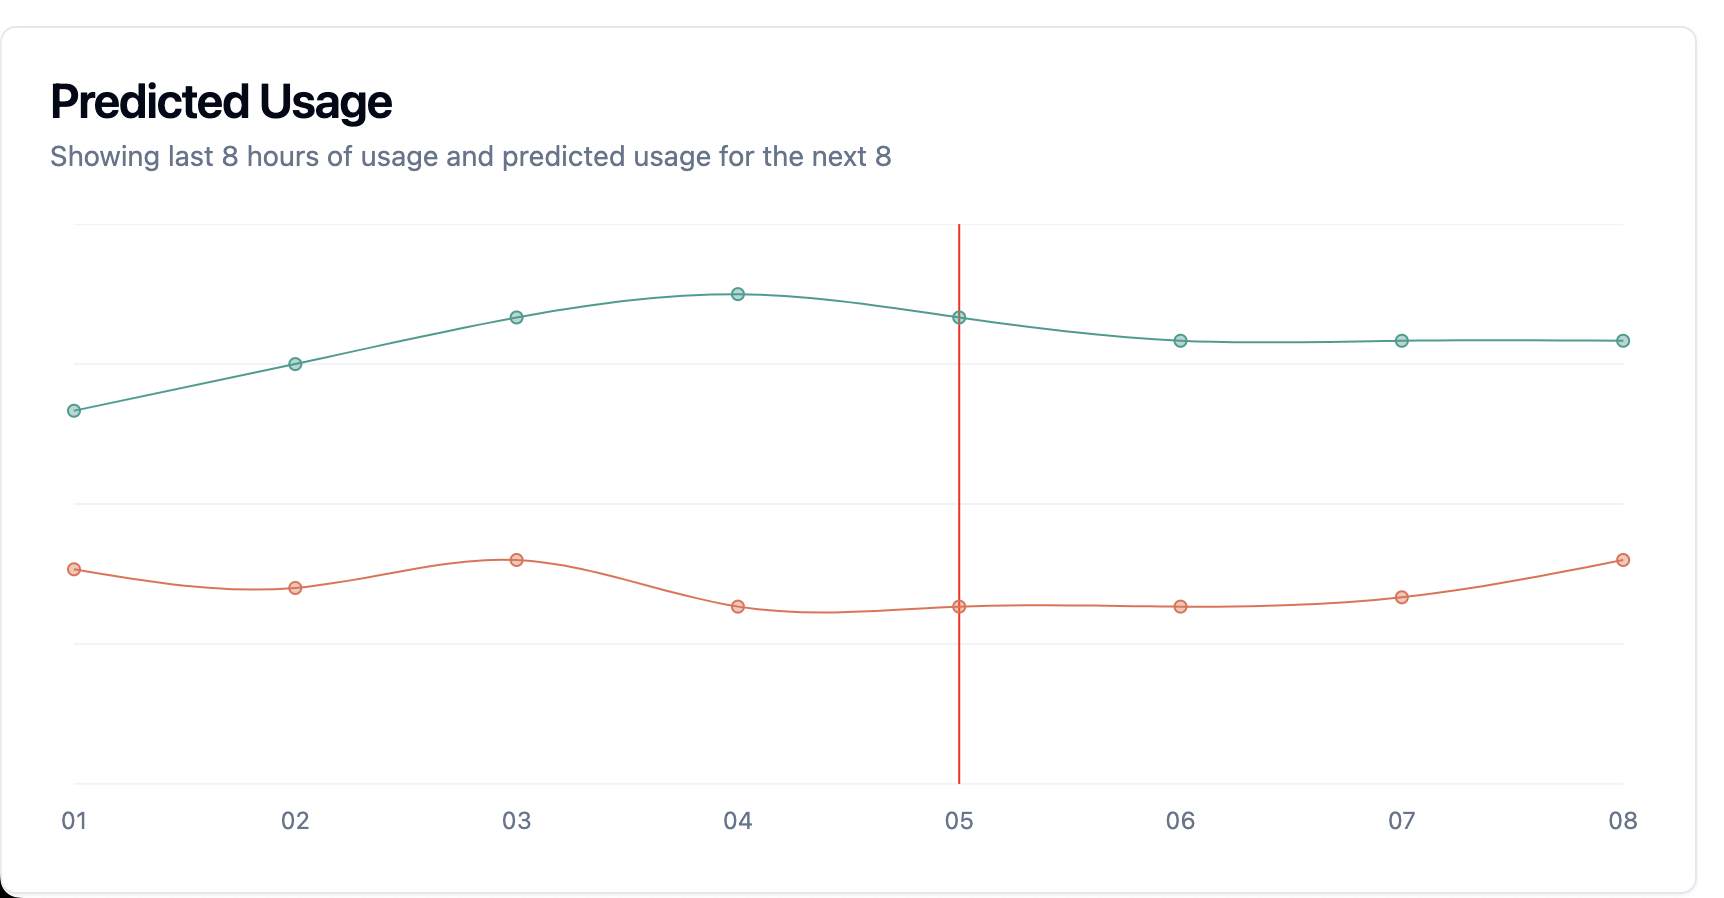
The values predicted by the Random Forest Regressor model
-

The distribution of the total power usage
-

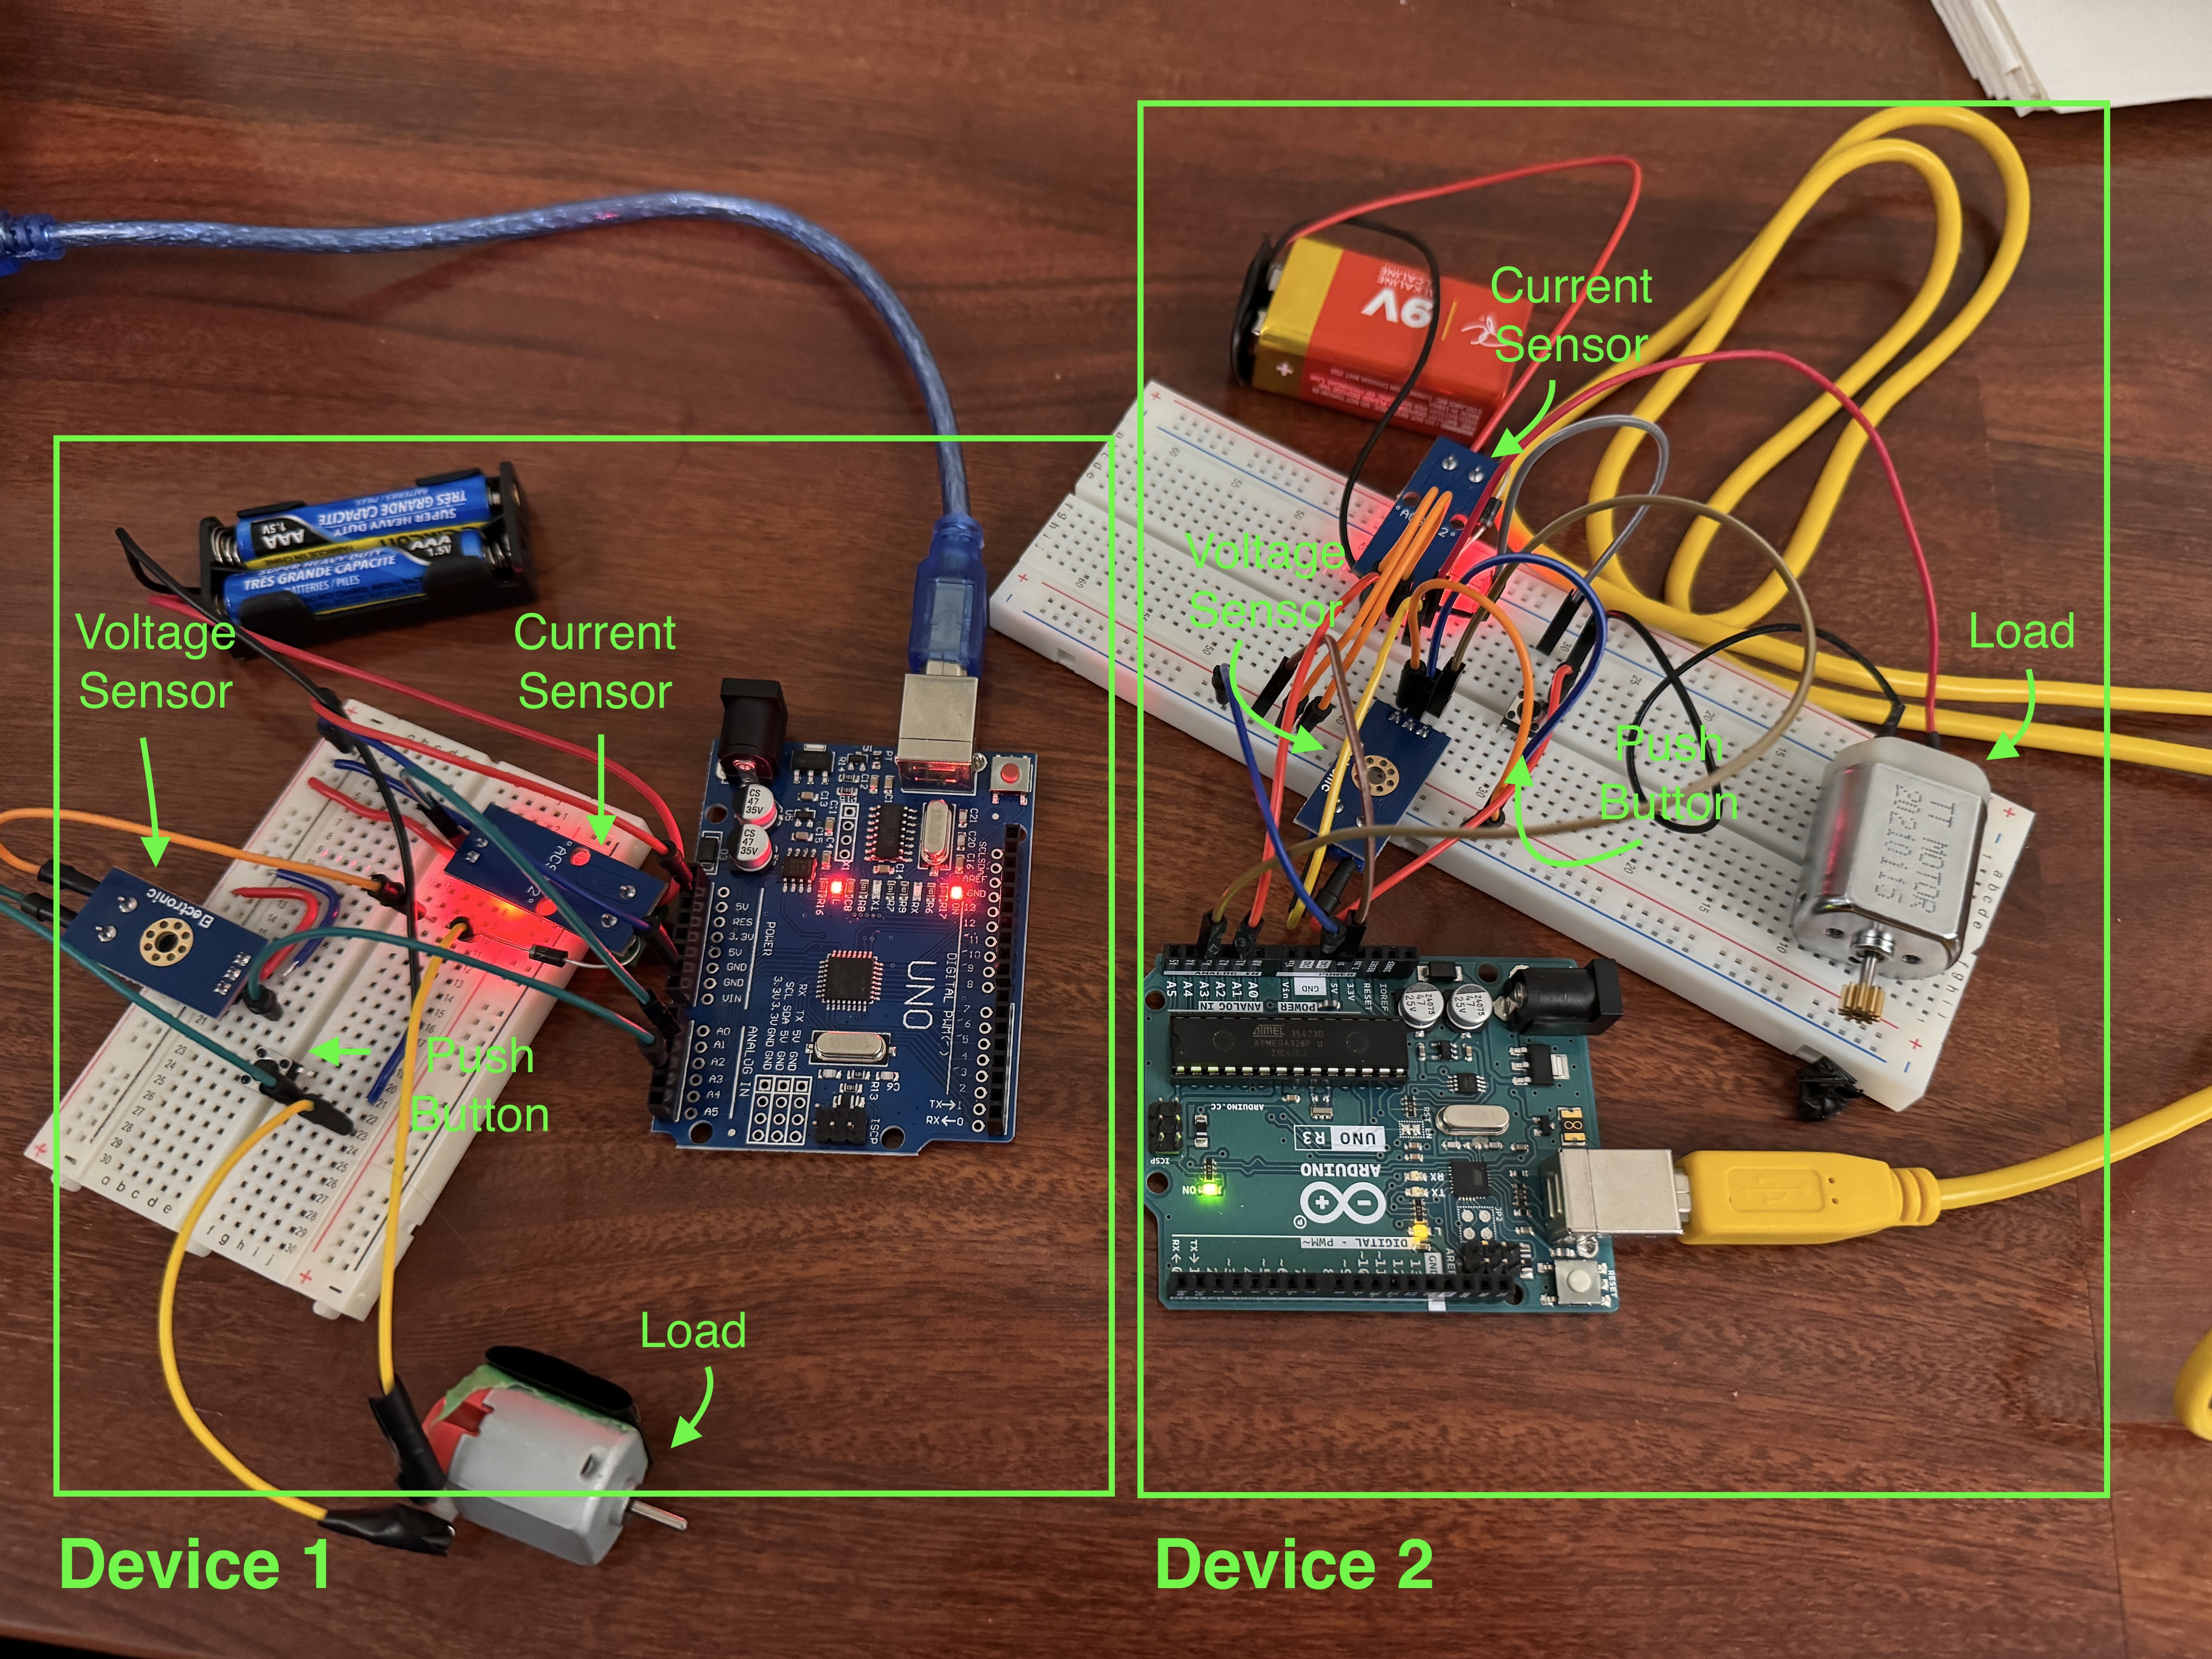
Dual Arduino setup
🍀 Our Inspiration
We thought the best way to kick this off was to share this classic meme:

We can all chuckle at this, but let's be real: climate change is no joke. Just look at how the Earth set its global temperature record two weeks ago! The problem isn't just that the climate is heating up – it's that people often aren’t motivated to act unless there's something in it for them. Think about it: volunteering often comes with certificates, and jobs come with paychecks. People need incentives to get moving!
🙌 How does WattWise solve the problem
We’ve created a prototype that would plugs directly into your office/home’s main power supply. This device streams real-time data to our dashboard using protocols like MQTT and HTTPS, where you can watch your power usage, get a sneak peek at your upcoming electricity bill and much more.
Imagine this: normally, we’re all a bit clueless about whether we’ve left the lights on or are using power-hungry gadgets, until the dreaded bill arrives. With WattWise, it’s like having a personal energy coach. Just like how whoop made tracking your fitness addictive, WattWise lets you track your energy usage and bill predictions.
Picture this scenario: You’re relaxing on a holiday when WattWise sends you a notification about your current power usage being higher than the daily average. This alert prompts you to check the stats, giving you valuable insights on which appliances to turn off. After making a few adjustments, you’re back to enjoying your holiday with the satisfaction of knowing you’ll have a lower bill at the end of the month.
We just took a household as an example – think about offices and corporations. With WattWise, you could be saving tons of electricity and cash without breaking a sweat.
🧑💻 Technical implementation
This project was one of our most technical yet! We aimed to simulate not just one but two devices streaming data to a single dashboard. Picture a company with two buildings, each outfitted with our Arduino setups. These setups included current and voltage sensors, a switch, a DC motor, a 9V battery, and a diode. When the switch is flipped, the sensors measure the current and voltage produced by the motor, giving us the power using:
Power = Voltage × Current
Power in watts per hour equals energy, and multiplying this by the local rate gives the cost. To share this data, we used the MQTT protocol. Our devices publish power data to an MQTT broker, and an Express.js backend subscribes to this data, receiving updates every second. This data is stored in DynamoDB, and we provide API routes for other services to access it with custom queries.
We containerized everything using Docker and Docker Compose, creating a local setup with DynamoDB, an MQTT client and broker, and our API. These services interact through a Docker network. Next, we tackled future price predictions using a custom model with a RandomForestRegressor in scikit-learn, hosted on a Python Flask server.
Finally, our Next.js dashboard brings it all together. The frontend is also integrated with Google Gemini GenAI to detect unusual usage patterns and alert users. It features a bar chart for current usage, a pie chart for device comparison, and a line chart for predicted usage. Basic math operations show the end-of-month cost predictions and GenAI alerts for any unusual activity.
😭 Challenges we ran into
Handling time zones has always been a developer's nightmare, and of course, our whole MQTT and DynamoDB setup crashed at midnight because of this. It took a while to sort out the mess and reset everything.
Additionally, we also had to buy our voltage and current sensors from Amazon. Since local stores didn’t carry them, we had to arrange for delivery to a friend's house.
Our team had diverse strengths: backend, frontend, and DevOps. This meant we were often using technologies unfamiliar to each other. We spent a lot of time learning on the fly, which was both challenging and rewarding.
And now for the embarrassing part: we spent three hours last night debugging a single API call because the React state refused to update.
😤 Accomplishments that we're proud of
- Everything worked as intended. Both Arduinos streamed data accurately, the calculations were correct, our machine learning model made precise predictions, GenAI integration was seamless, and the frontend supported real-time updates.
- Built a highly technical project from scratch in just 36 hours.
- Acquired new skills and applied them effectively throughout the project.
- Tackled a significant real-world problem, contributing to a solution for one of the most prevalent issues humanity faces today, climate change and excess consumption of natural resources.
- Successfully integrated hardware with advanced software.
🧐 What we learned
- Training our own model using Scikit-Learn was a valuable learning experience. It taught us how to format data precisely to meet our needs.
- Using Docker and Docker Compose was highly effective. We managed to run multiple services simultaneously, which streamlined our development process.
- Working with several backends and setting up TCP tunnels using ngrok to access each other’s computers for accessing local servers.
- Gained hands-on experience with circuitry, electronics, Arduinos, and serial ports to stream live data.
- Working with IoT technology and integrating hardware with software in real-time was demanding, but research and experience helped us overcome the challenges.
- Working in a team provided valuable insights into soft skills like communication and coordination.
- Each hackathon teaches us new skills and improves our efficiency. We learned to better utilize APIs, templates, and open-source software, as well as improve time management and planning.
🔜 What's next for WattWise
- Currently, our tool focuses on providing information, but it doesn't offer control over devices. A potential enhancement would be to enable users to control smart devices directly from the dashboard and view real-time updates.
- We aim to introduce detailed progress statistics similar to what you’d find on a fitness tracker like a Fitbit. This enhancement would provide users with a comprehensive view of their energy usage trends over a selectable timeframe (e.g., weekly, monthly).
Built With
- arduino
- docker
- docker-compose
- express.js
- flask
- genai
- google-gemini
- javascript
- mqtt
- ngrok
- python
- scikit-learn


Log in or sign up for Devpost to join the conversation.