-
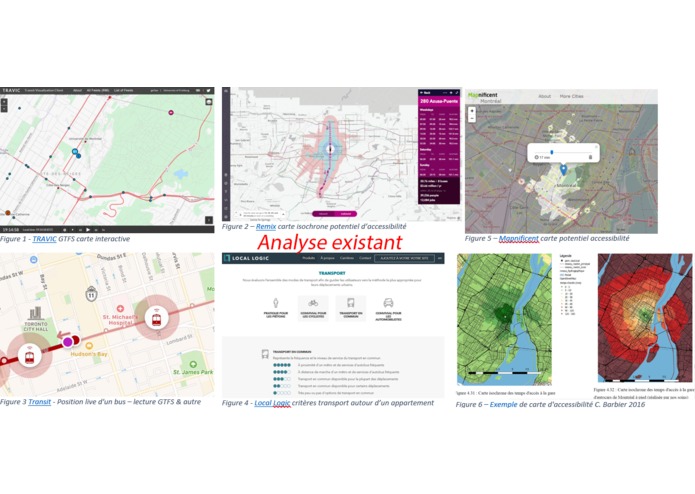
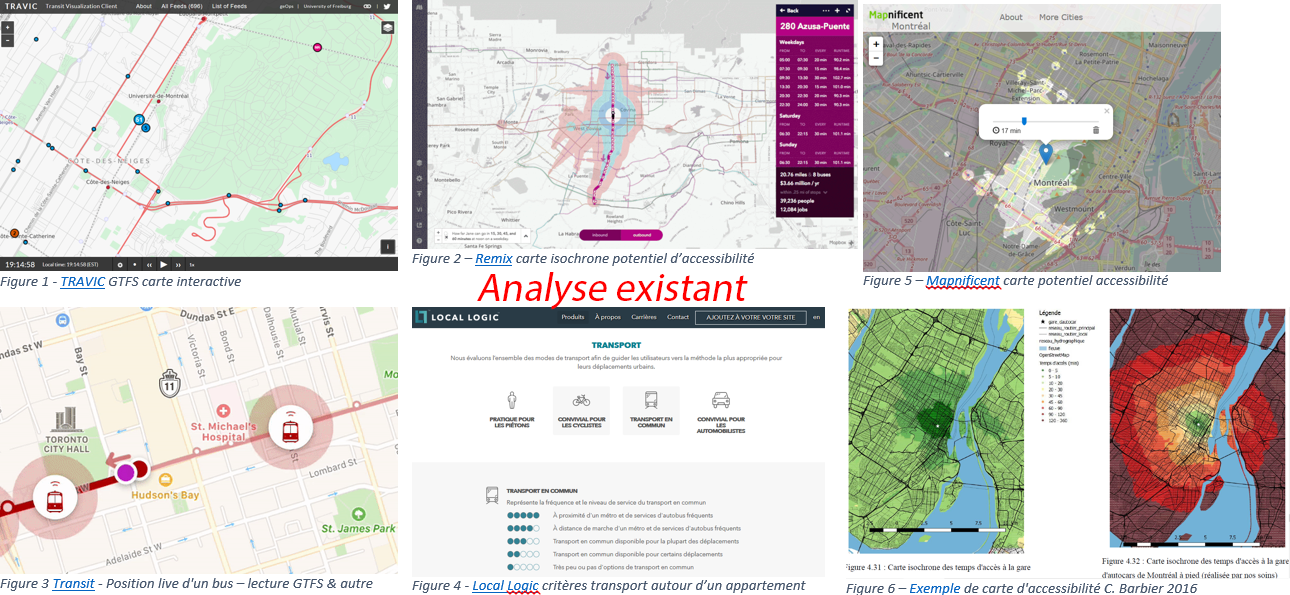
Analyse de l'existant
-
mobile
Inspiration
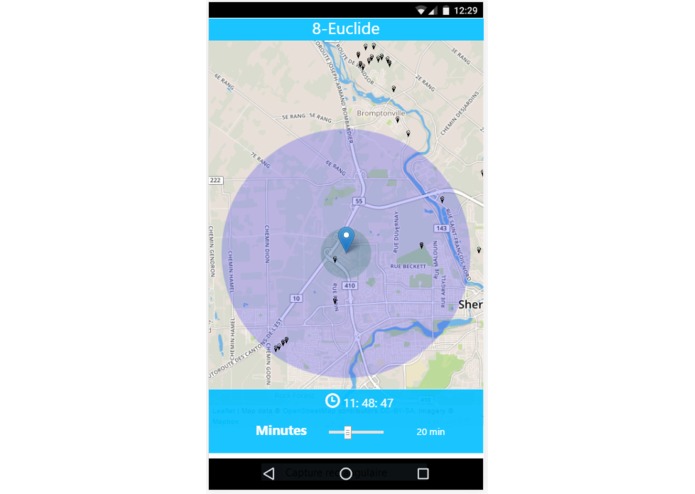
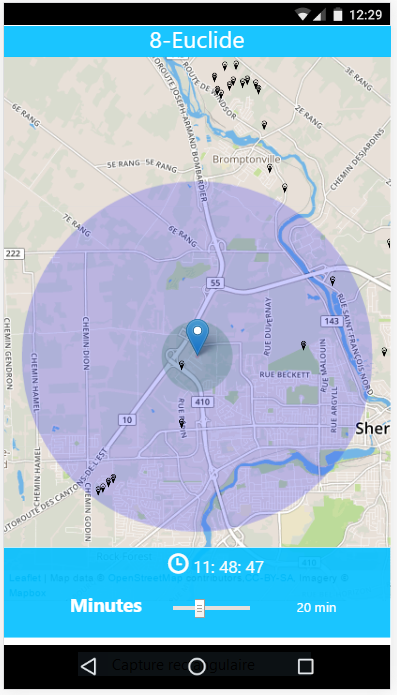
What it does
- Shows the mobility opportunities (bus, bikeshare stations) and reach areas (isochrone map) for a user at a given date time and a given location
- Analyses the accessibility of a city transportation offer (Bus, Metro, Tramway, Bike Share...) and compare it with other cities
How we built it
- Front End Web App available on every device with a web navigator (Angular)
- Back End App to pre load closest transportation data
- Database merging different datasets (GTFS, GBFS...)
Challenges we ran into
- How to make accessible more than 8 million of stop times data comming from various city representing the public transportation offer ?
- How to deal with the variants of the GTFS being a bit different between cities even with a standard).
- How to explore the commute opportunities with various transit system and transport agencies around a given location ?
- How to visualize accessibility and reachable areas around a position on an interactive map ?
- How to have a glimpse of the future of the surrounding transportation offer ?
Accomplishments that we're proud of
- Developping a tool for merging in one database 8 million stop times of various GTFS (Montréal, Longueuil, Gatineau, Laval, Québec, Sherbrooke, AMT Trains)
- Crafting of an accessibility algorithm computing the commute opportunities with a transit system around a given location
- Designing the first steps of a front end app and displaying the result of the accessibility algorithm
What's next for HackQC17-8-Euclide
- Bike-share integration in the accessibility algorithm
- Cities accessibility analysis
- Web application development to be continued


Log in or sign up for Devpost to join the conversation.