-

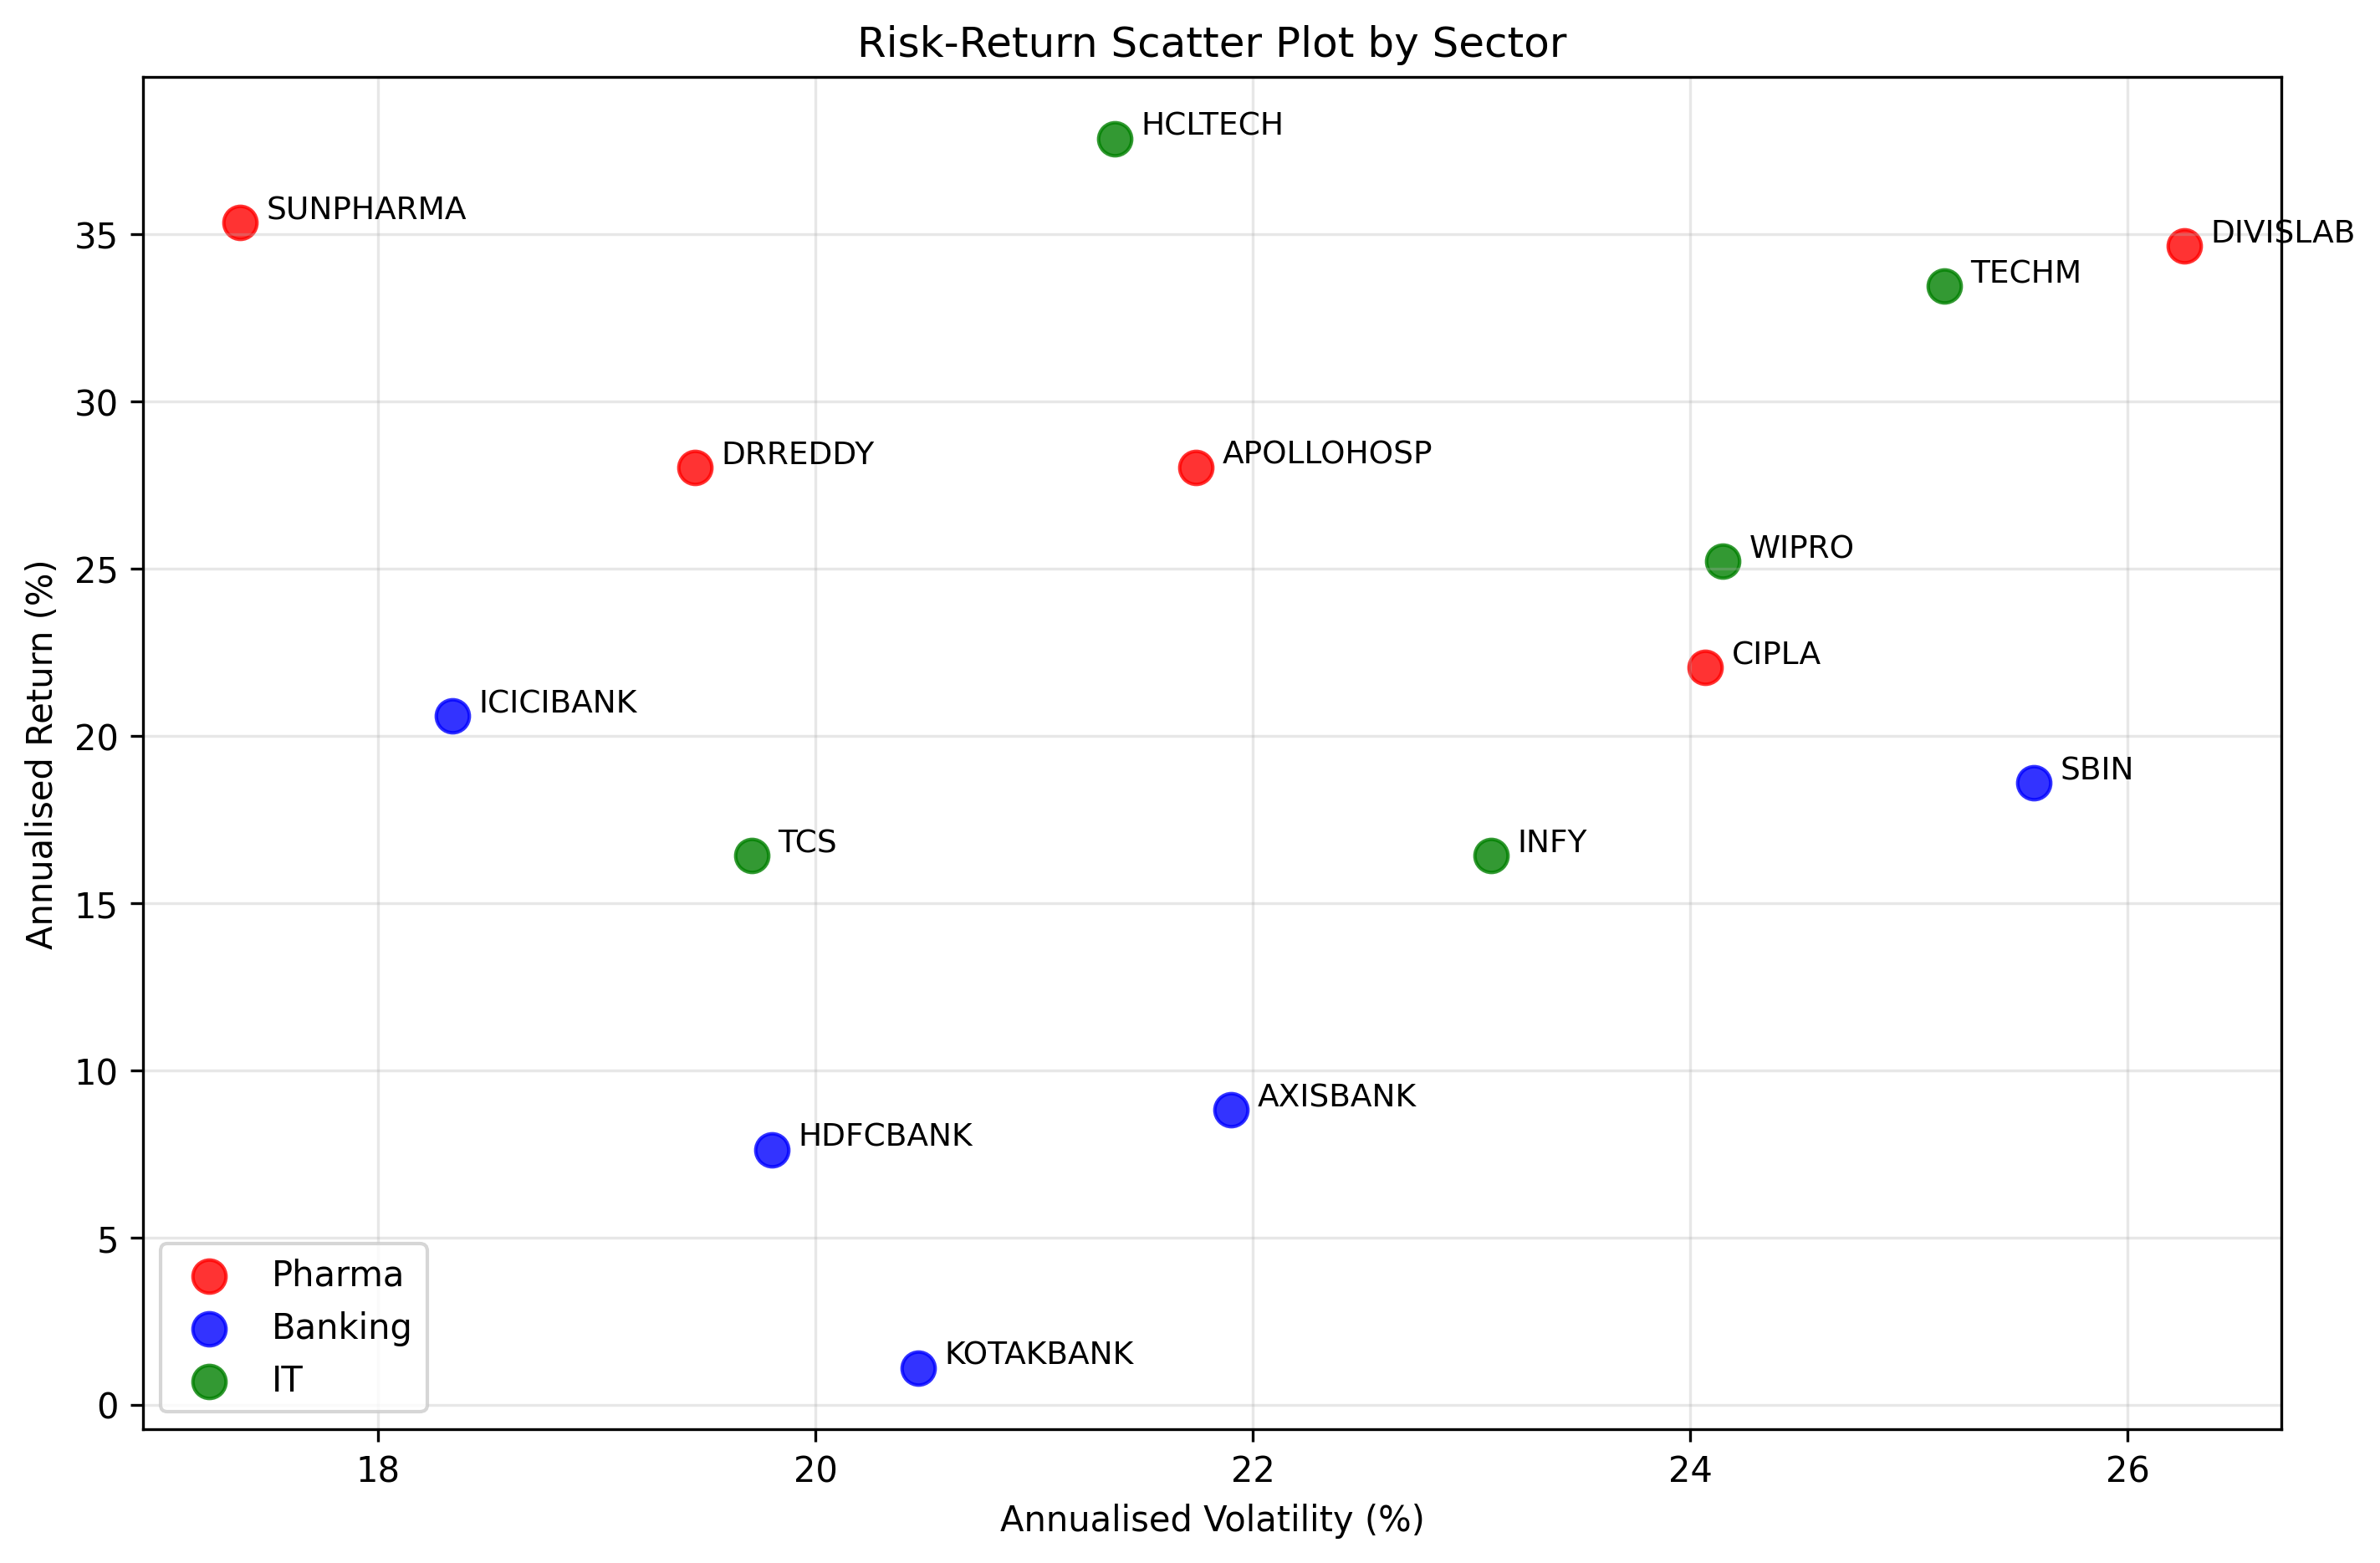
Scatter plot for risk and return by sector
-
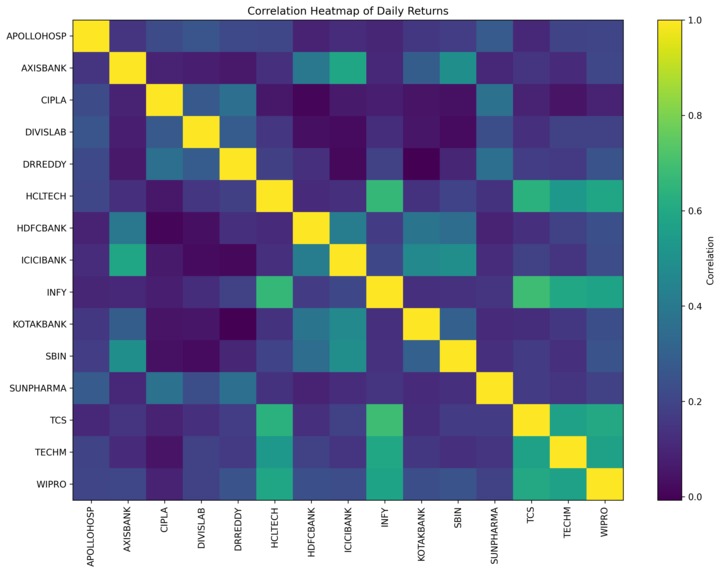
Corelation heatmap of daily returns
-
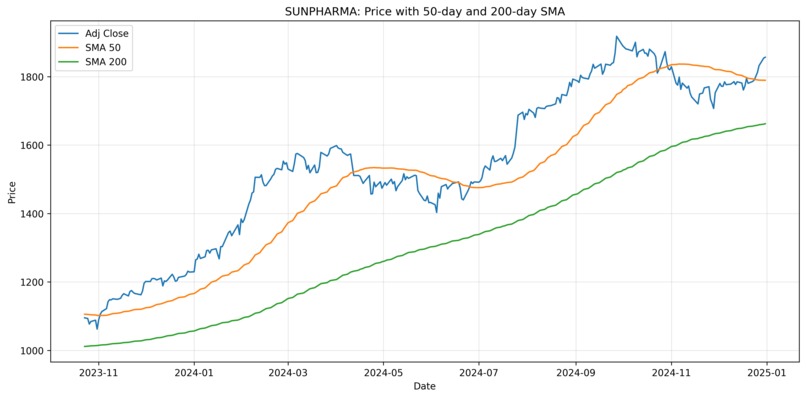
SUNPHARMA SMA chart
-
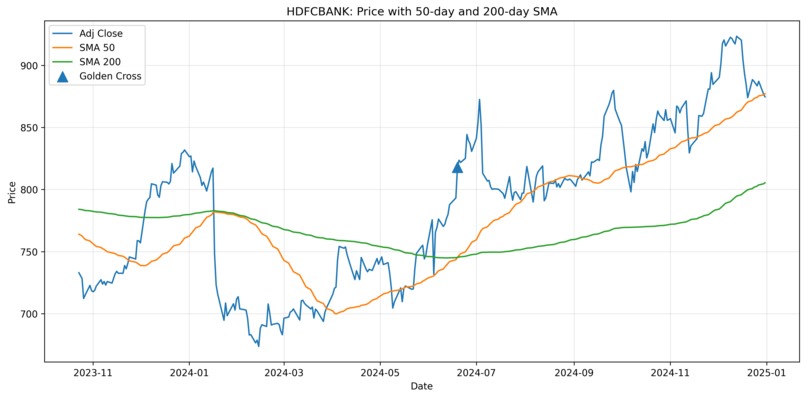
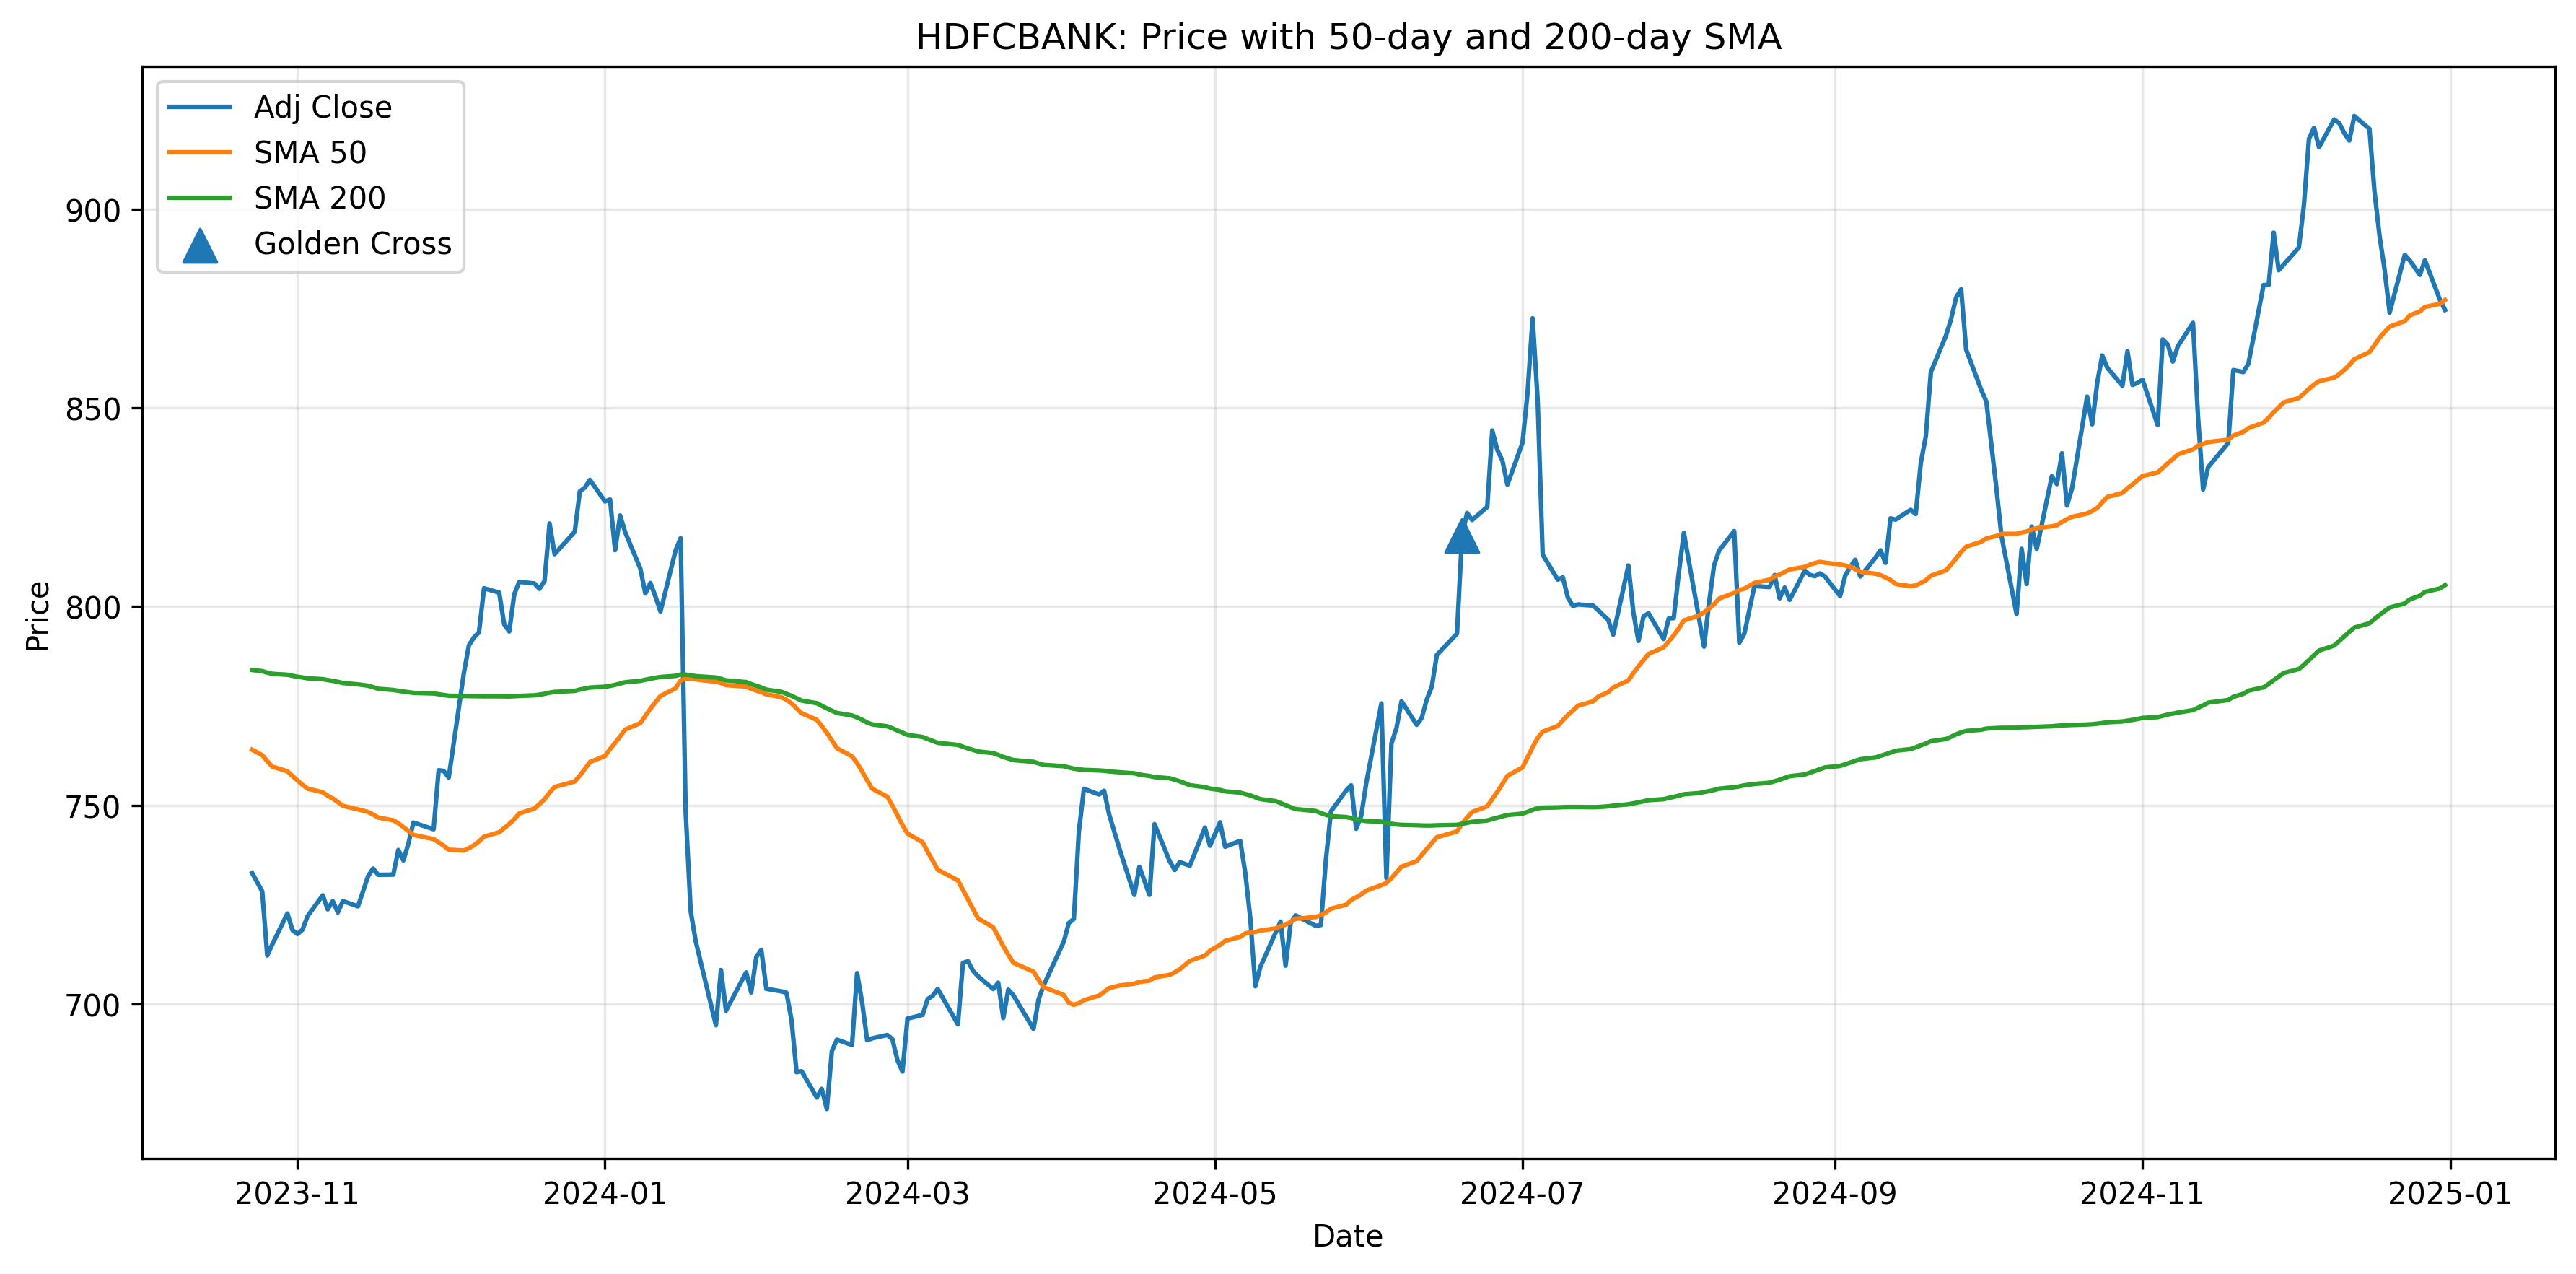
HDFC SMA chart
-
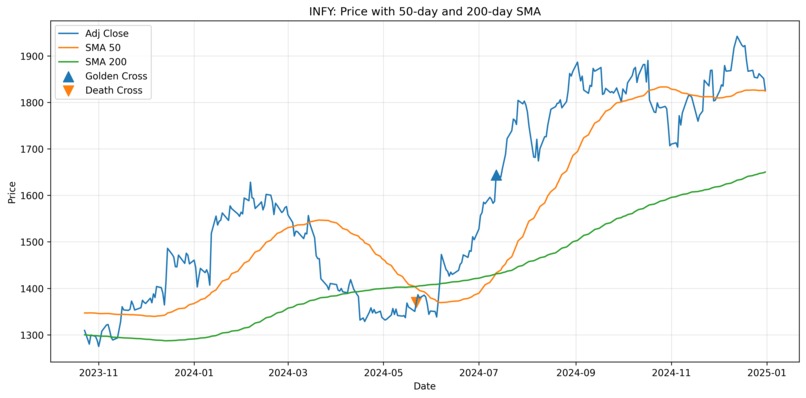
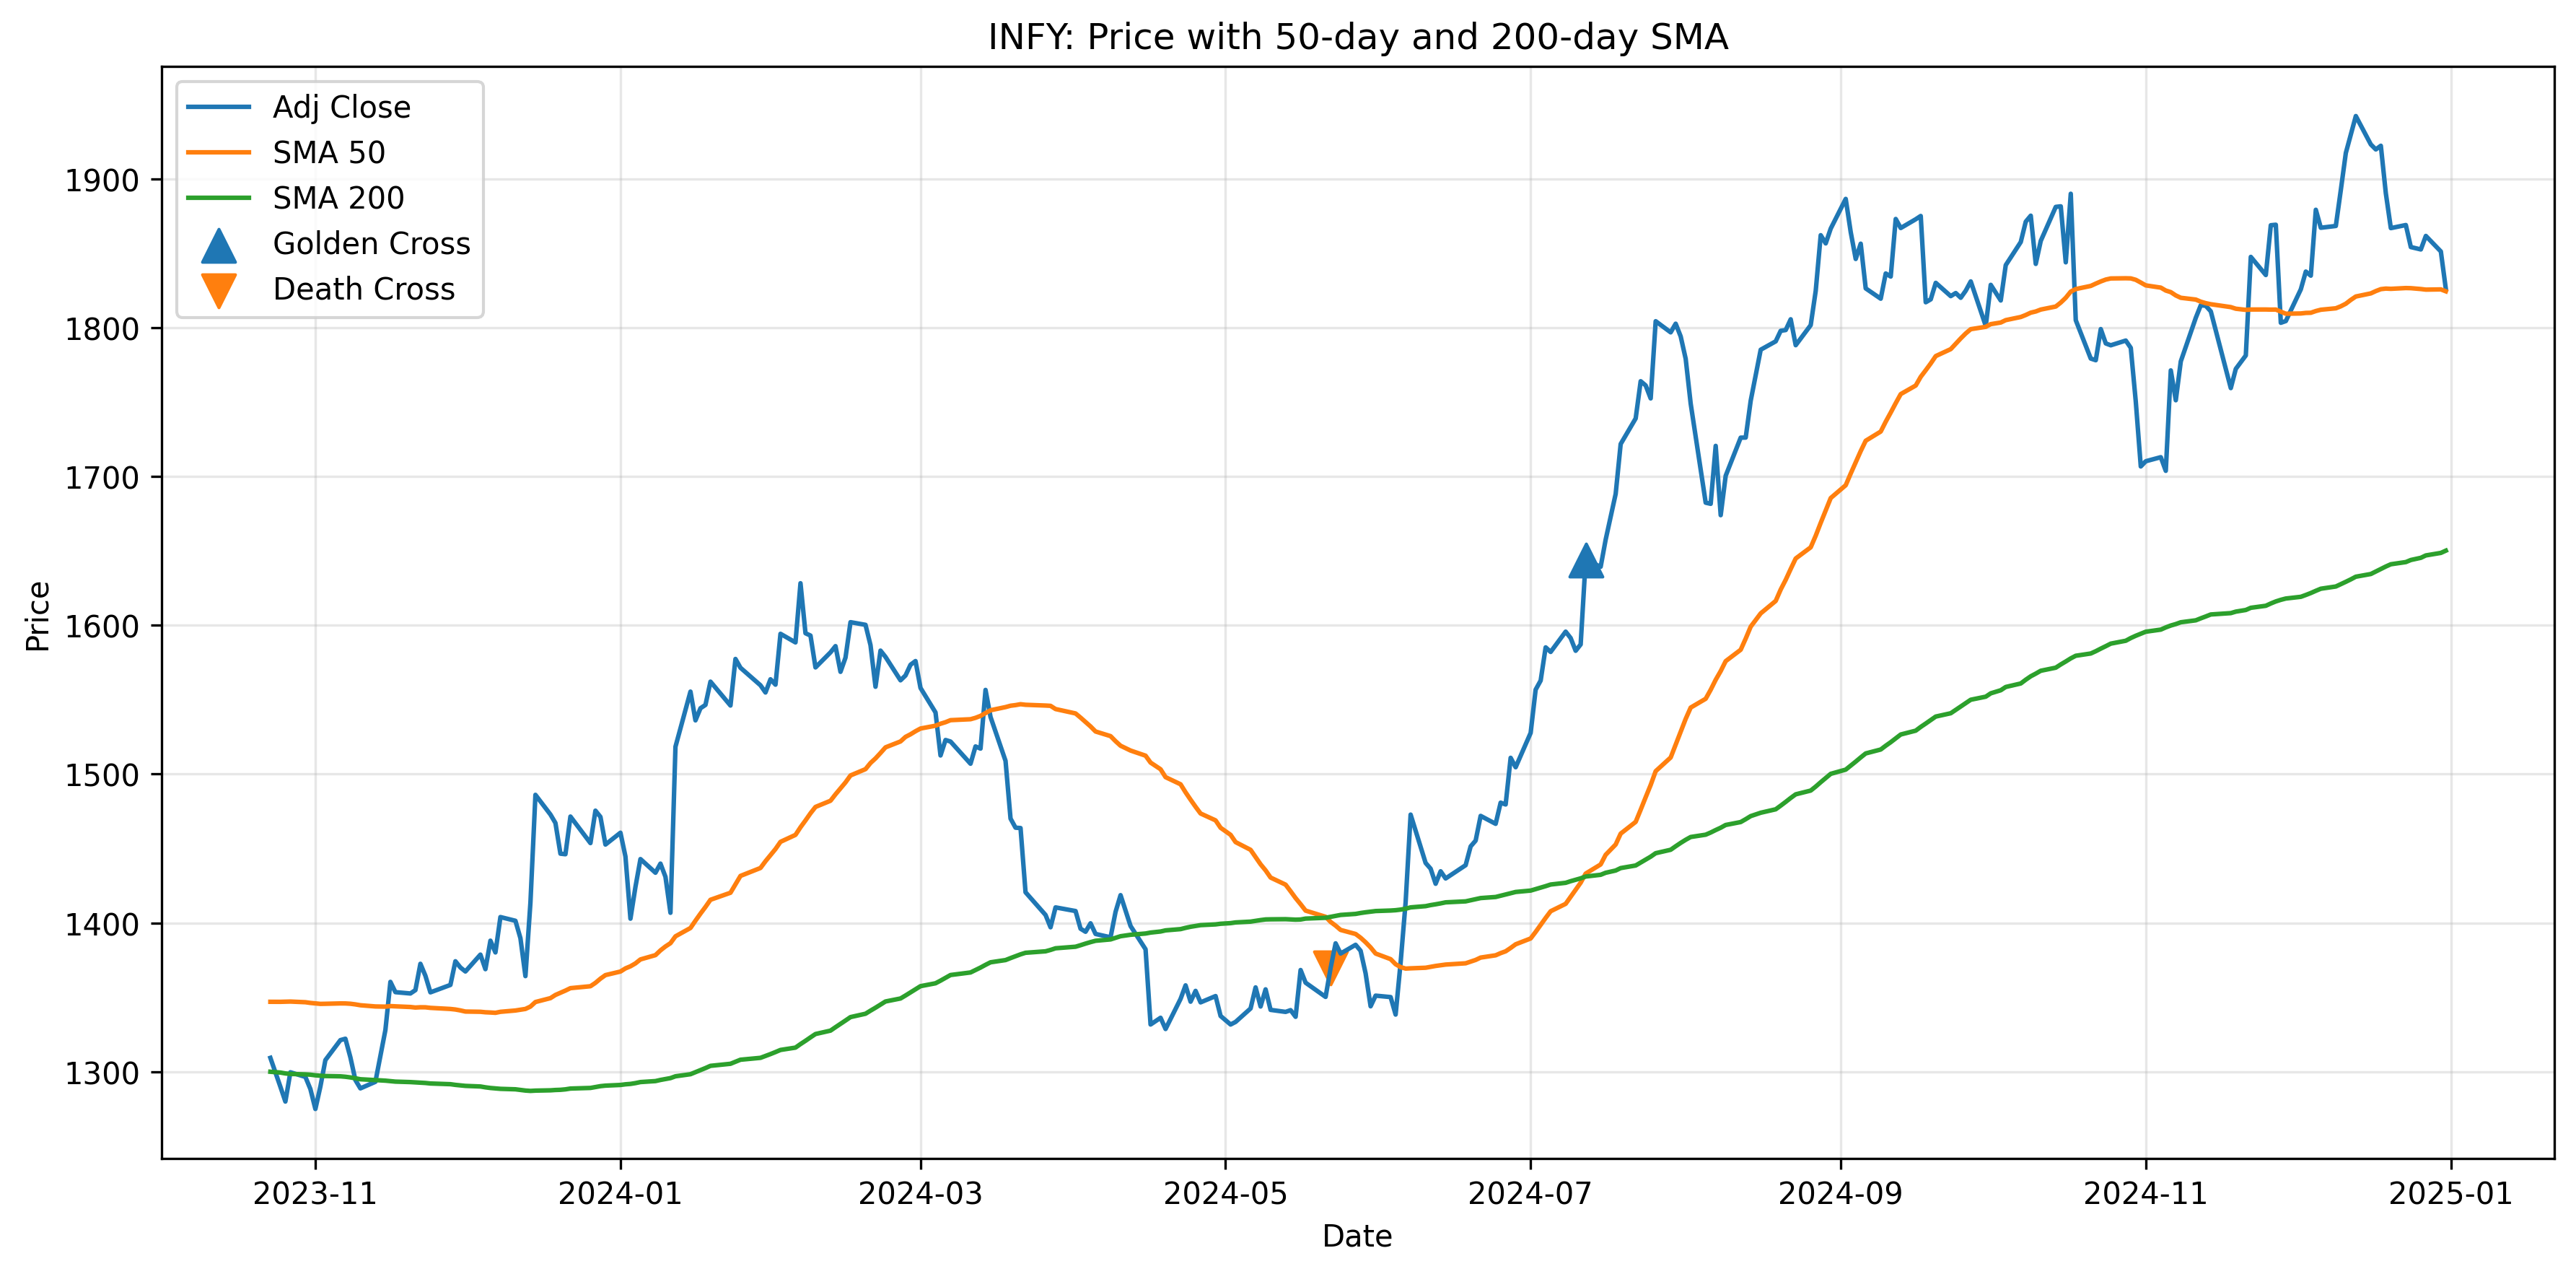
INFY SMA chart


Inspiration
We wanted to build a project that goes beyond simple stock price tracking and focuses on what actually matters in portfolio decisions: risk, return, resilience, and explainability. The challenge inspired us to combine finance, data analysis, automation, and machine learning into one practical system that can support better investment decisions using real NSE market data.
What it does
PortfolioIQ analyzes 15 NSE-listed stocks across Banking, IT, and Pharma using historical market data. It computes key risk-return metrics such as annualized return, volatility, Sharpe ratio, beta, drawdown, and SMA signals. It compares an equal-weight portfolio with a recommended allocation, stress-tests both under a market crash scenario, automates stock alerts using n8n, and applies machine learning to classify relative stock outperformance within sectors.
How we built it
We fetched and cleaned two years of daily OHLCV data, then built the analytics pipeline in Python using pandas, numpy, matplotlib, and scikit-learn. We computed stock-level and portfolio-level risk metrics, created technical signal dashboards, and designed a more defensive Portfolio B using Sharpe, beta, drawdown, and sector behavior. For automation, we built an n8n workflow that sends alerts when selected stocks move more than 2% from the previous close. For ML, we engineered market features and compared Logistic Regression with Random Forest on a proper time-based split.
Challenges we ran into
One challenge was making sure the project remained focused on risk and return analysis rather than drifting into unsupported price prediction. Another was building an ML task that matched the challenge requirement of relative outperformance instead of naive forecasting. We also had to carefully avoid data leakage, especially in the temporal train-test split, and make our portfolio decisions defensible using computed metrics rather than intuition alone. On the automation side, converting the workflow logic into a clean, live-demo-ready n8n flow took iteration.
Accomplishments that we're proud of
We are proud that we built an end-to-end workflow rather than isolated analyses. The project covers data acquisition, cleaning, metric computation, portfolio construction, technical signals, stress testing, automation, and machine learning in one coherent pipeline. We are also proud that Portfolio B improved annualized return from 22.28% to 28.20% while keeping volatility nearly unchanged, raising the Sharpe ratio from 1.382 to 1.863. The Chaos Round result further strengthened our case by showing that Portfolio B was also more resilient in a market shock.
What we learned
We learned that strong investing decisions are not only about maximizing return, but about balancing return with volatility, drawdown, and market sensitivity. We also learned that technical indicators like SMA crossovers are useful for confirmation, but should not be used in isolation. In the ML part, we saw how difficult short-horizon relative outperformance prediction is, and why proper temporal validation matters in finance. Most importantly, we learned how to turn raw market data into a defendable, presentation-ready decision framework.

Log in or sign up for Devpost to join the conversation.