-
-
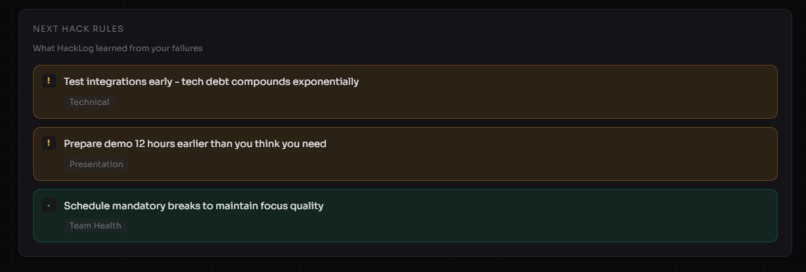
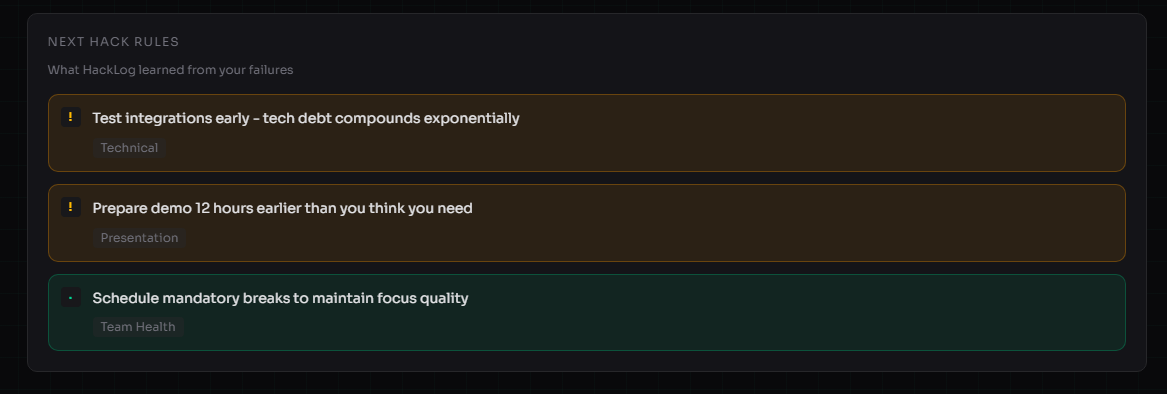
Recommendation section
-
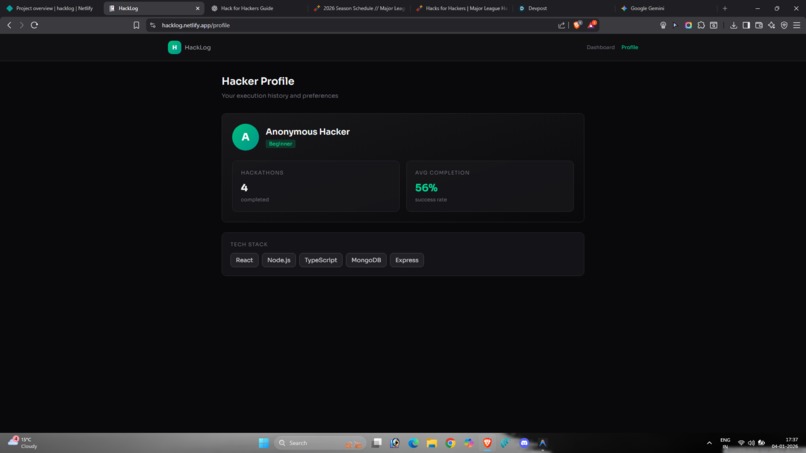
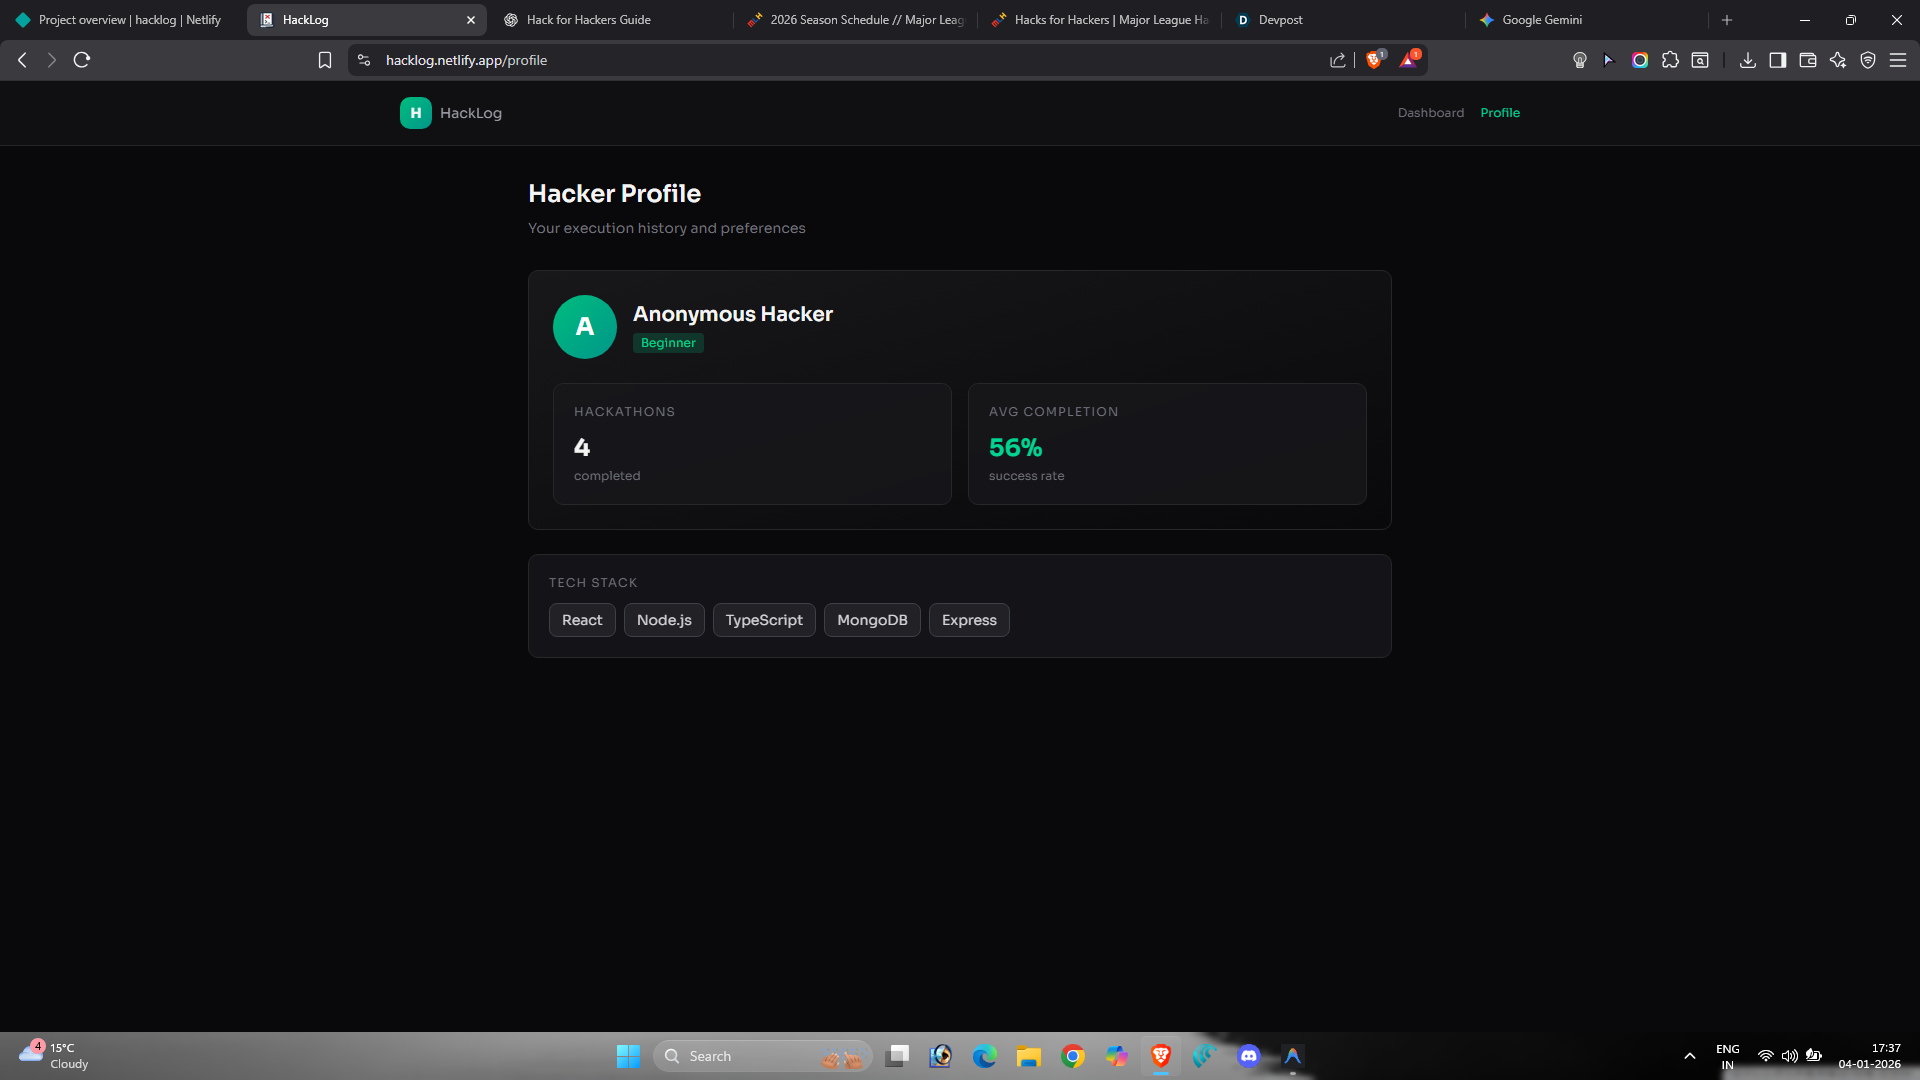
Profile Page
-
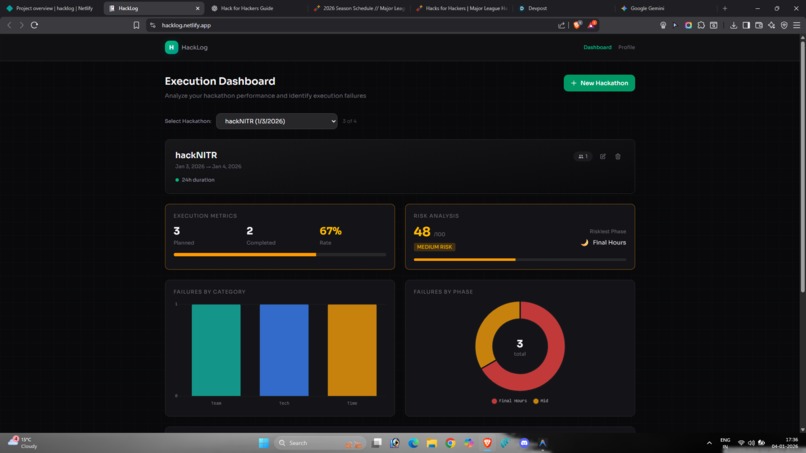
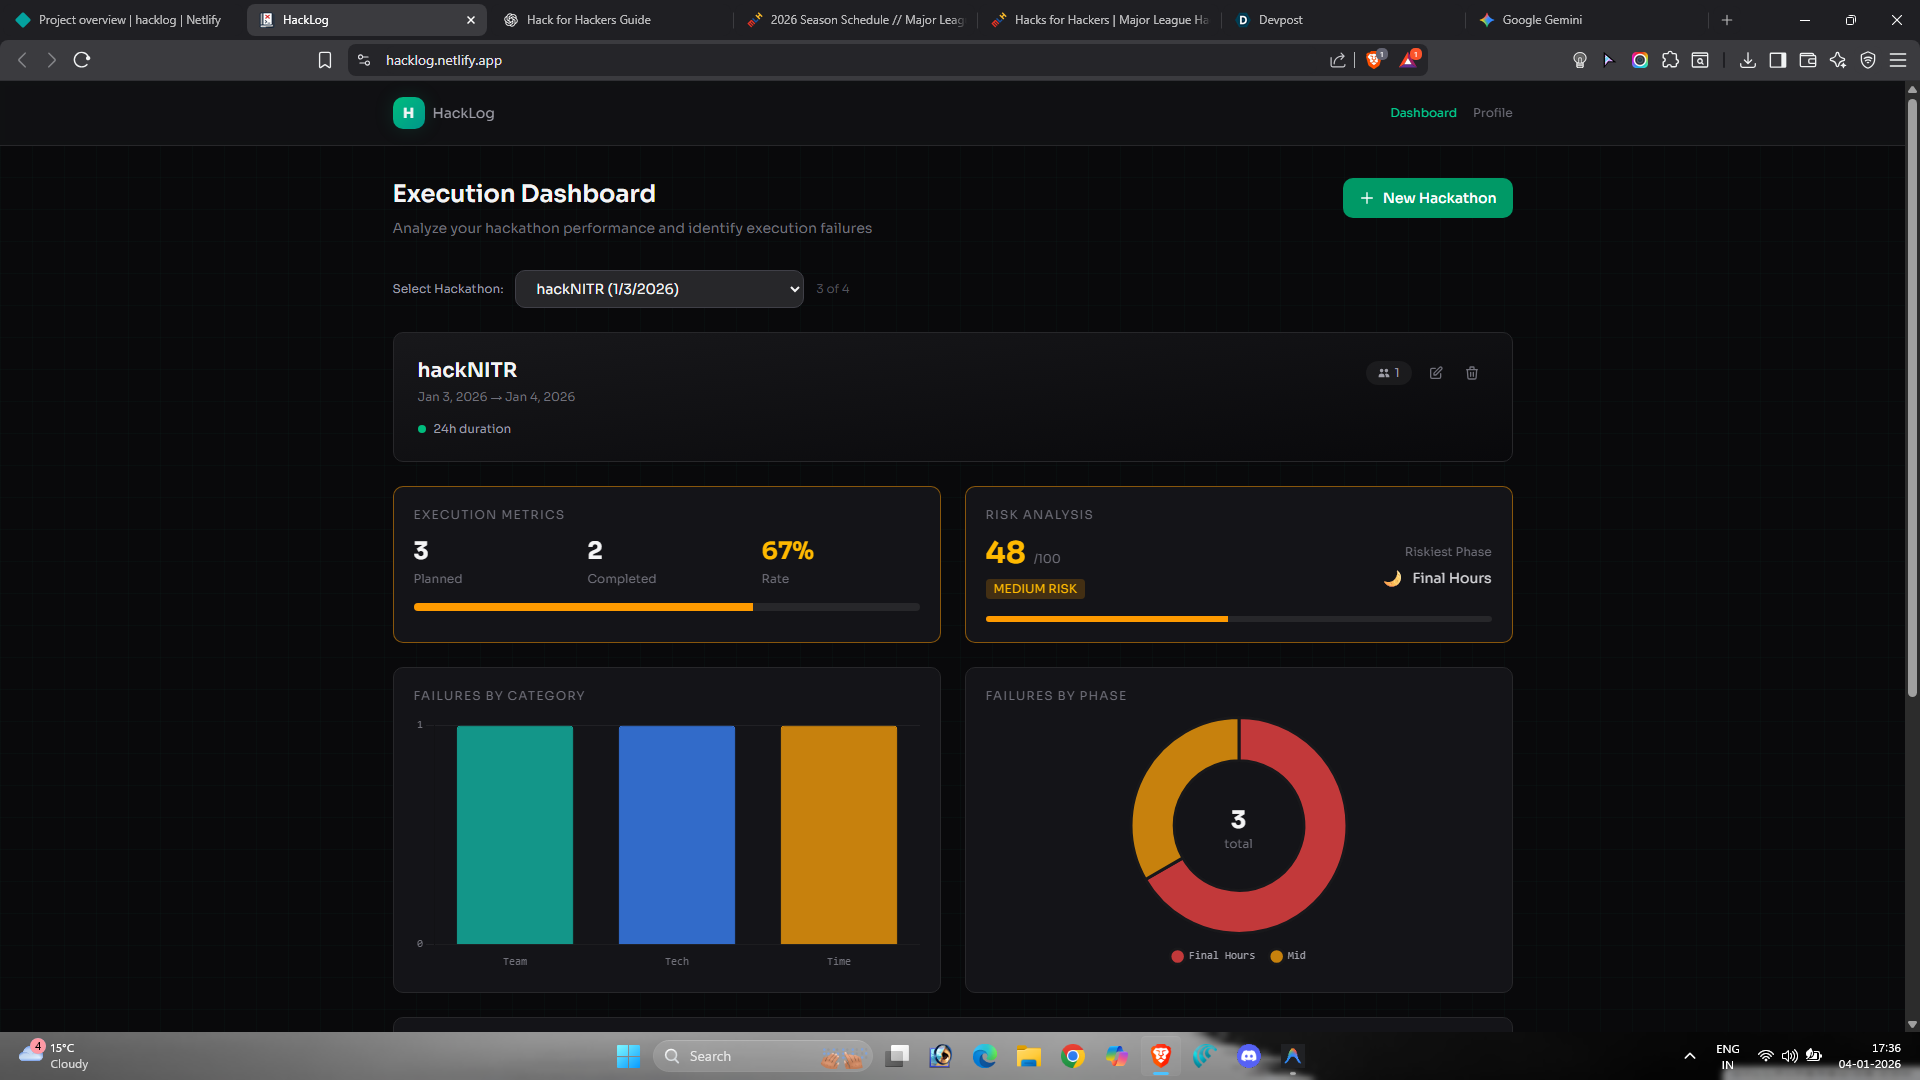
Dashboard page
-
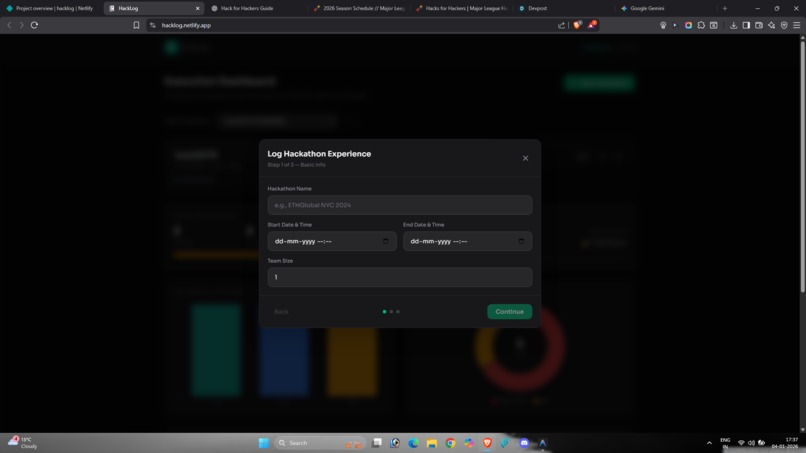
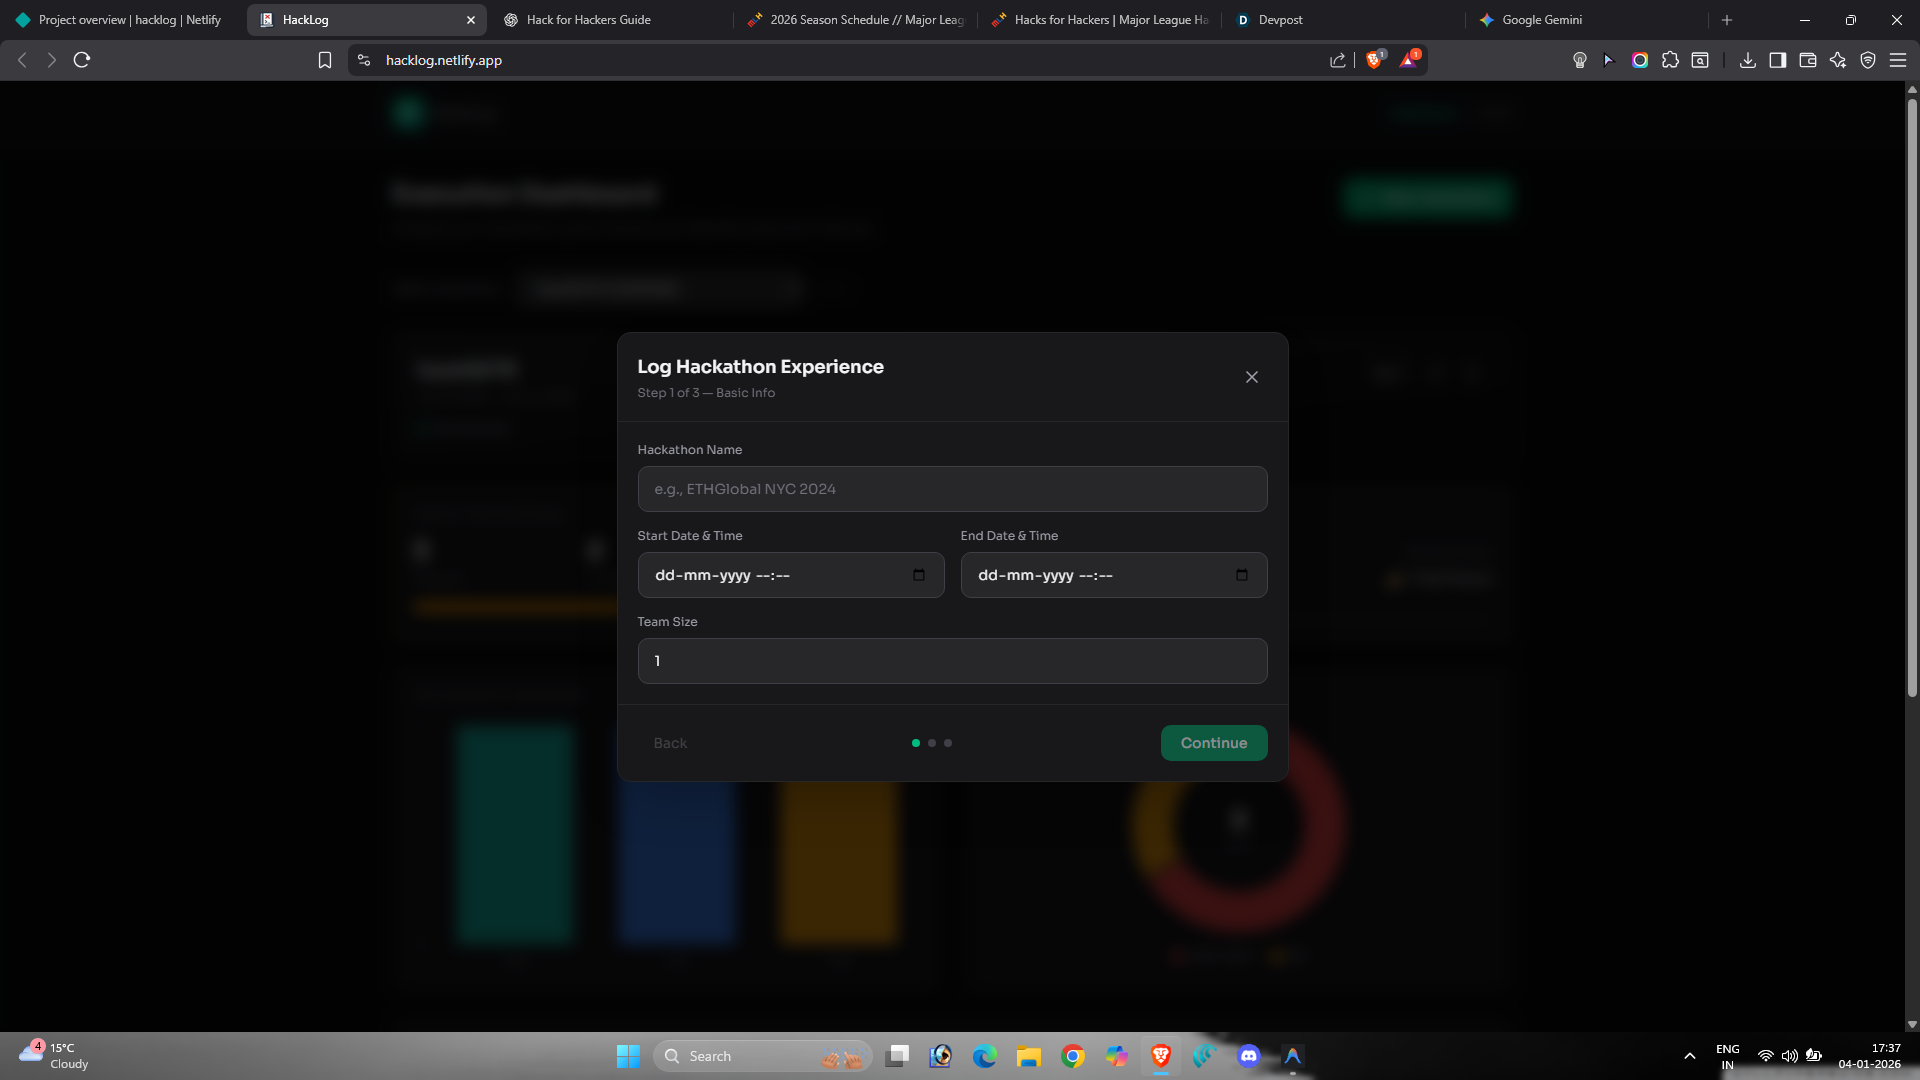
New Hackathon Detail
Inspiration
Hackathons don’t usually fail because of bad ideas.
They fail because of poor execution — scope creep, time mismanagement, late-stage chaos, and mistakes teams repeat because they never document or analyze them.
After participating in hackathons myself, I realized that while we celebrate wins, we almost never systematically track failures. Every hackathon ends, lessons are forgotten, and the same problems show up again in the next one.
HackLog was inspired by a simple question:
What if hackathon failures were treated as data instead of anecdotes?
What it does
HackLog is a failure-driven hackathon analytics platform that helps hackers learn faster from execution failures and perform better in future hackathons.
Instead of focusing on idea generation or task management, HackLog captures:
- what went wrong
- when it went wrong
- why it went wrong
It then analyzes these patterns to provide:
- execution metrics
- risk indicators
- actionable rules for the next hackathon
HackLog turns post-hackathon reflection into a data-driven feedback loop.
How we built it
HackLog is a full-stack web application with a clean separation between frontend, backend, and analytics logic.
- Frontend: Next.js, React, TypeScript, Tailwind CSS
- Data Visualization: Recharts & Chart.js
- Backend: Node.js with Express
- Database: MongoDB Atlas
- Deployment: Netlify (frontend) and Railway (backend)
MongoDB Atlas was used to model hackathons and nested failure data in a flexible document structure, making it well-suited for post-mortem analysis and pattern detection.
Key Features
Execution Dashboard
- Planned vs completed features
- Completion percentage
- Automatically calculated hackathon risk score
- Identification of the riskiest phase (Early, Mid, Final Hours)
Failure Logging & Analytics
- Categorized failures (Scope, Time, Tech, Focus, Team)
- Phase-based analysis
- Severity ratings and timestamps
- Visual breakdowns using charts
Smart Insights
- Rule-based, prioritized recommendations generated from failure patterns
- Actionable guidance such as reducing scope, freezing features earlier, or preparing demos ahead of deadlines
Multi-Hackathon Tracking
- Track and compare multiple hackathons
- Identify recurring execution issues over time
Challenges we ran into
One major challenge was balancing feature depth with clarity.
It was easy to keep adding features, but the real challenge was designing insights that were meaningful without over-engineering or adding unnecessary complexity.
Another challenge was ensuring that analytics and visualizations remained useful even with limited or incomplete data, which required careful handling of edge cases and empty states.
Accomplishments that we’re proud of
- Built and deployed a complete end-to-end system within a hackathon
- Designed a tool focused on execution learning, not just productivity
- Successfully turned qualitative failures into structured, analyzable data
- Delivered a product that feels usable beyond the hackathon itself
What we learned
This project reinforced an important lesson:
Execution is a skill, and skills improve fastest when failures are measured, not ignored.
Building HackLog highlighted the importance of product thinking, clear data modeling, and designing systems that help users improve over time rather than just complete tasks.
What’s next for HackLog
- Team-level analytics and collaboration
- Deeper pattern detection across multiple hackathons
- Exportable post-mortem reports
- Integration with development tools like GitHub for execution correlation
Built With
- chart.js
- express.js
- mongodb-atlas
- next.js
- node.js
- react
- recharts
- tailwind
- typescript


Log in or sign up for Devpost to join the conversation.