-
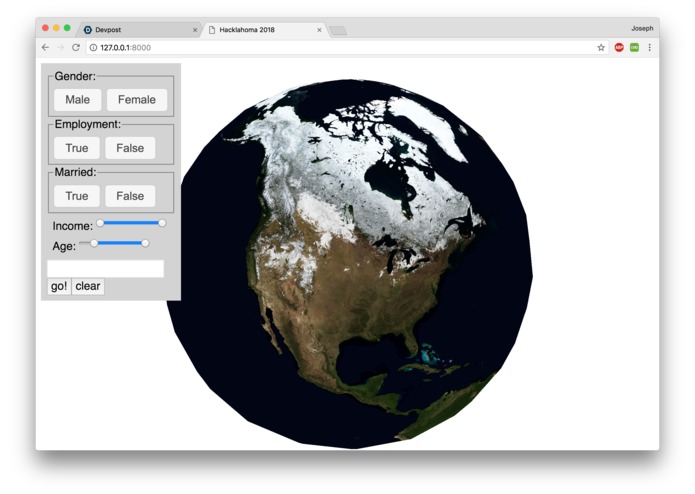
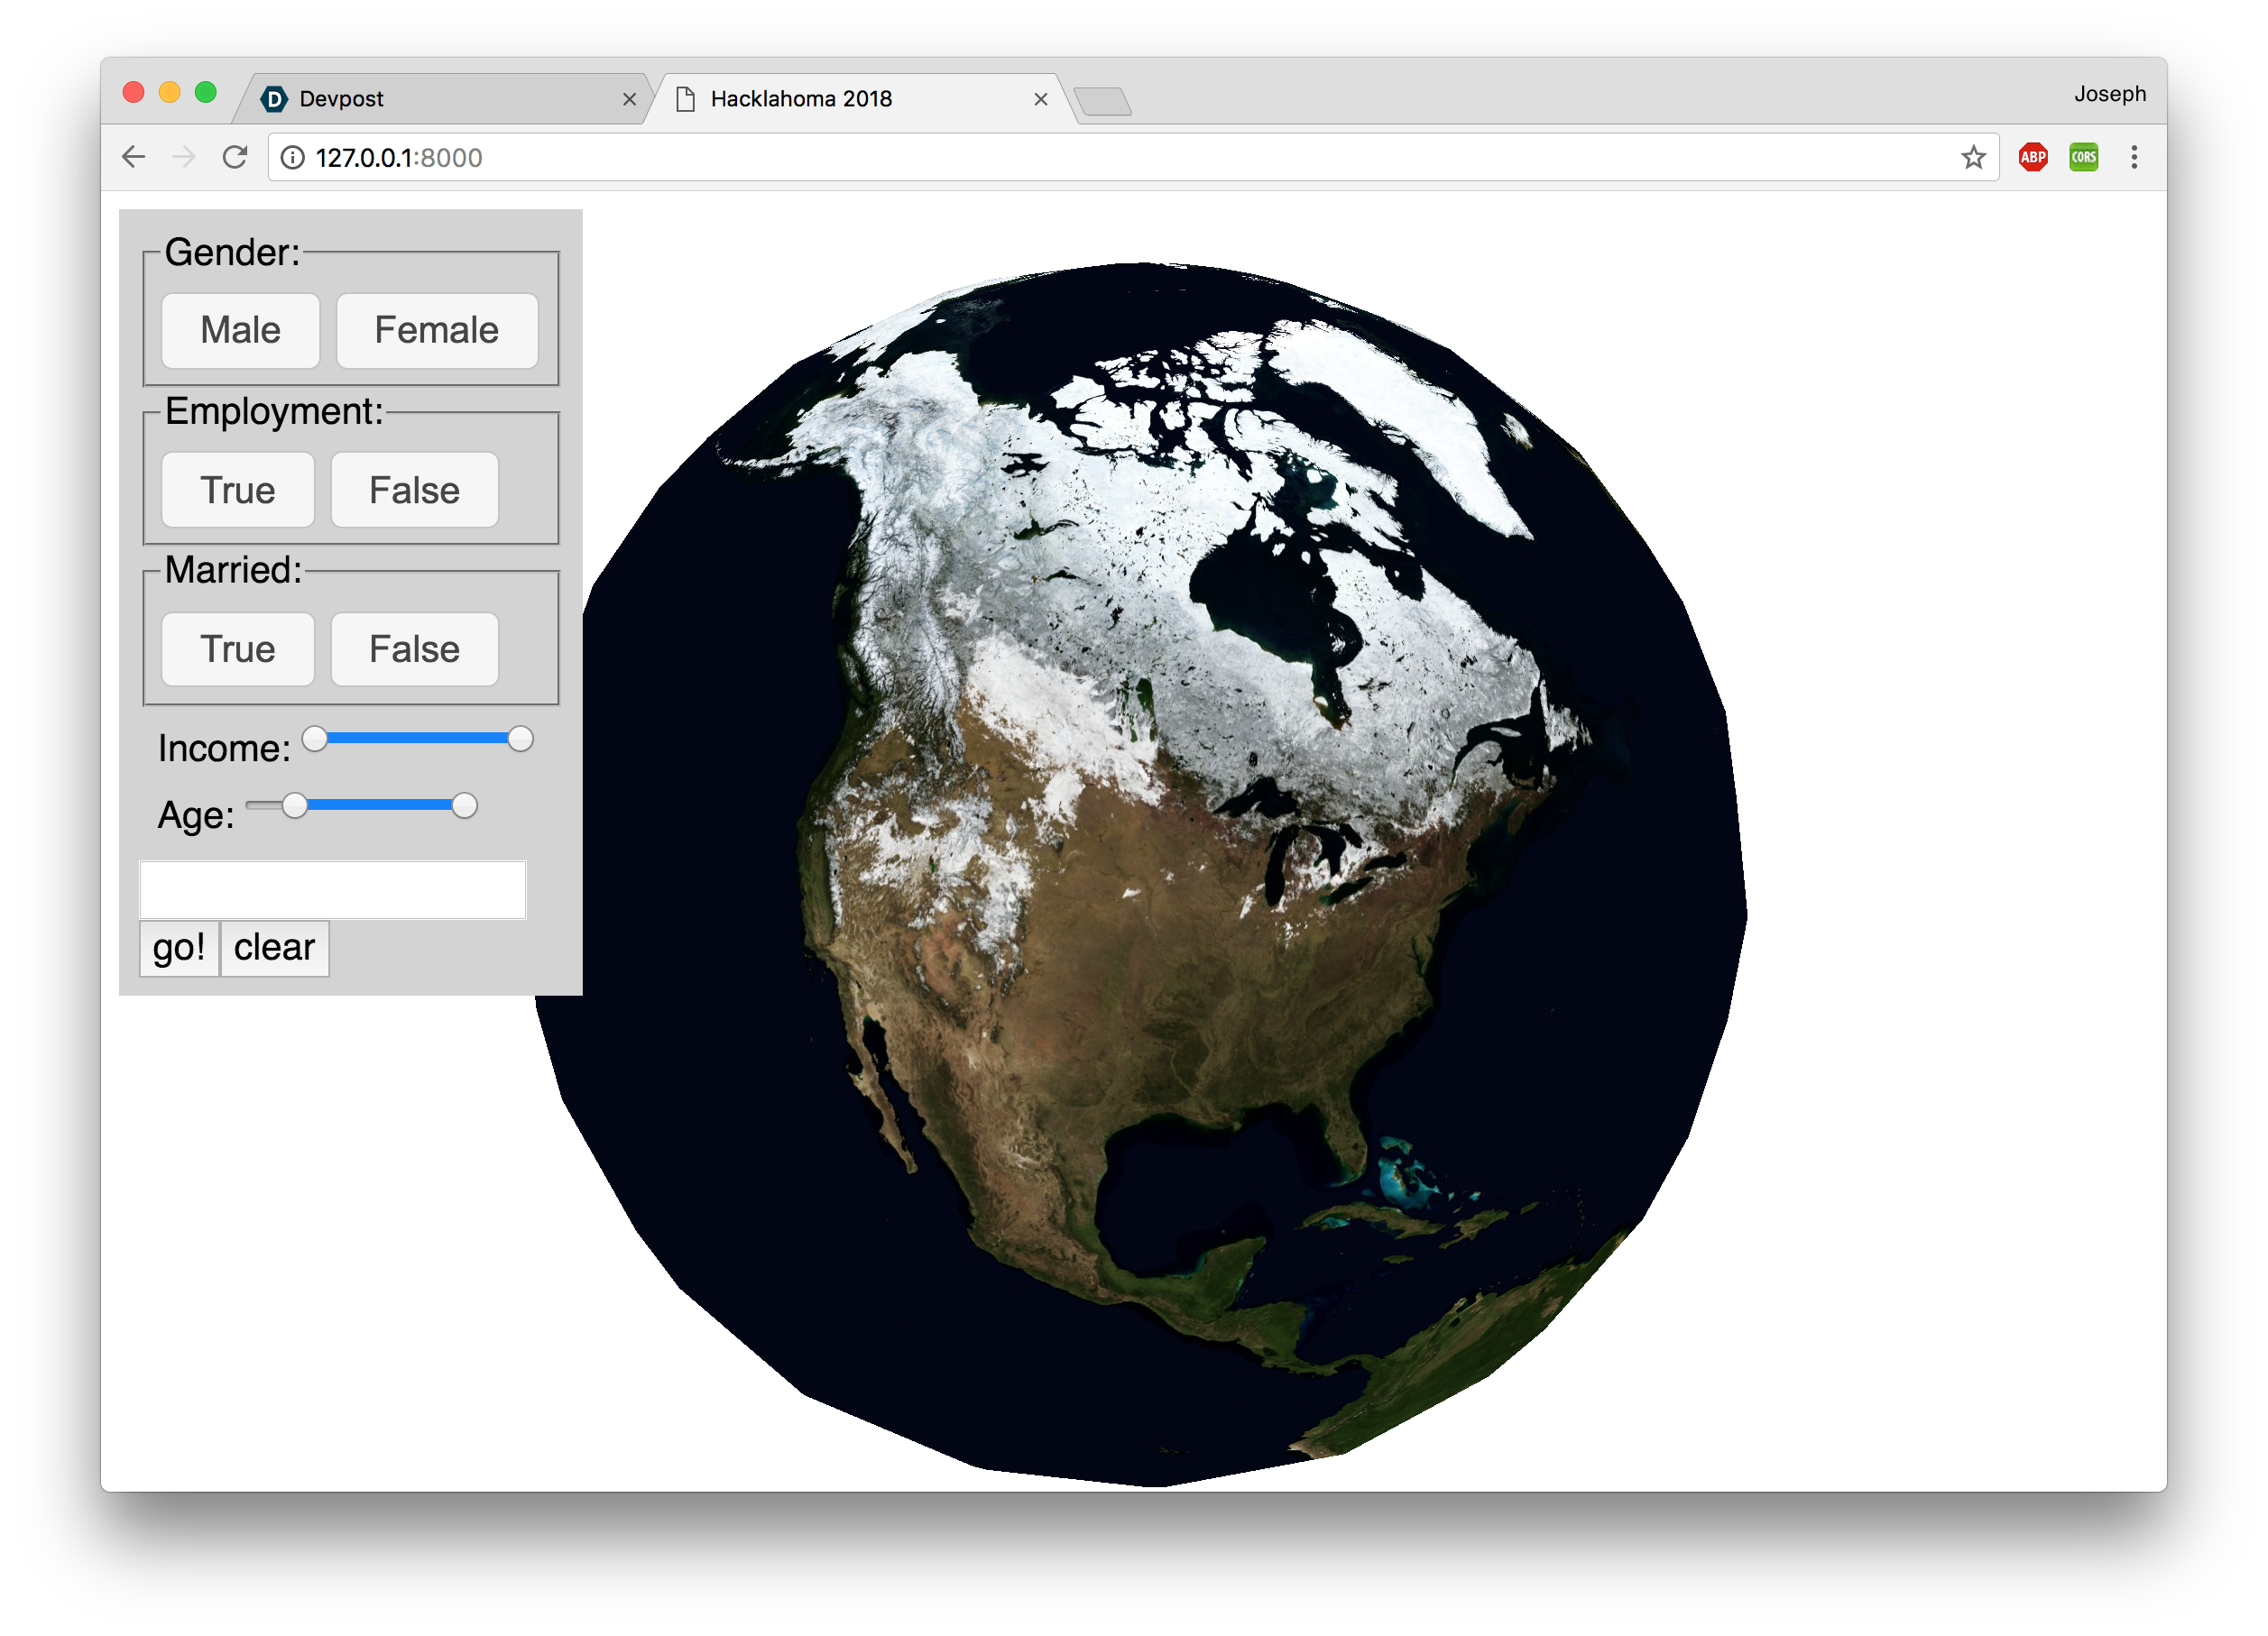
Entry page
-
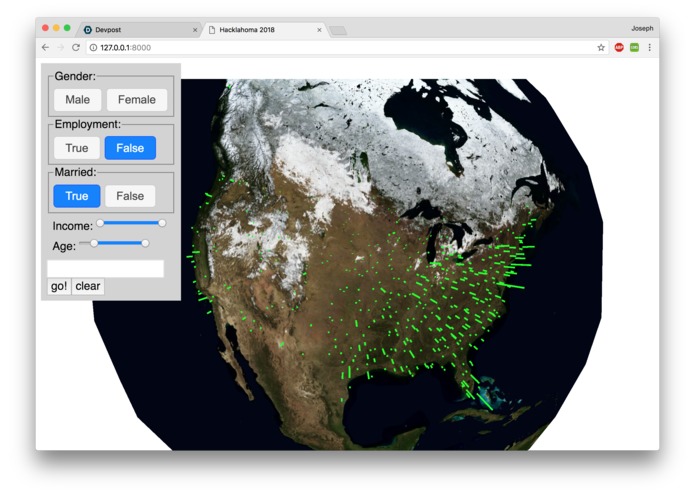
Sample query
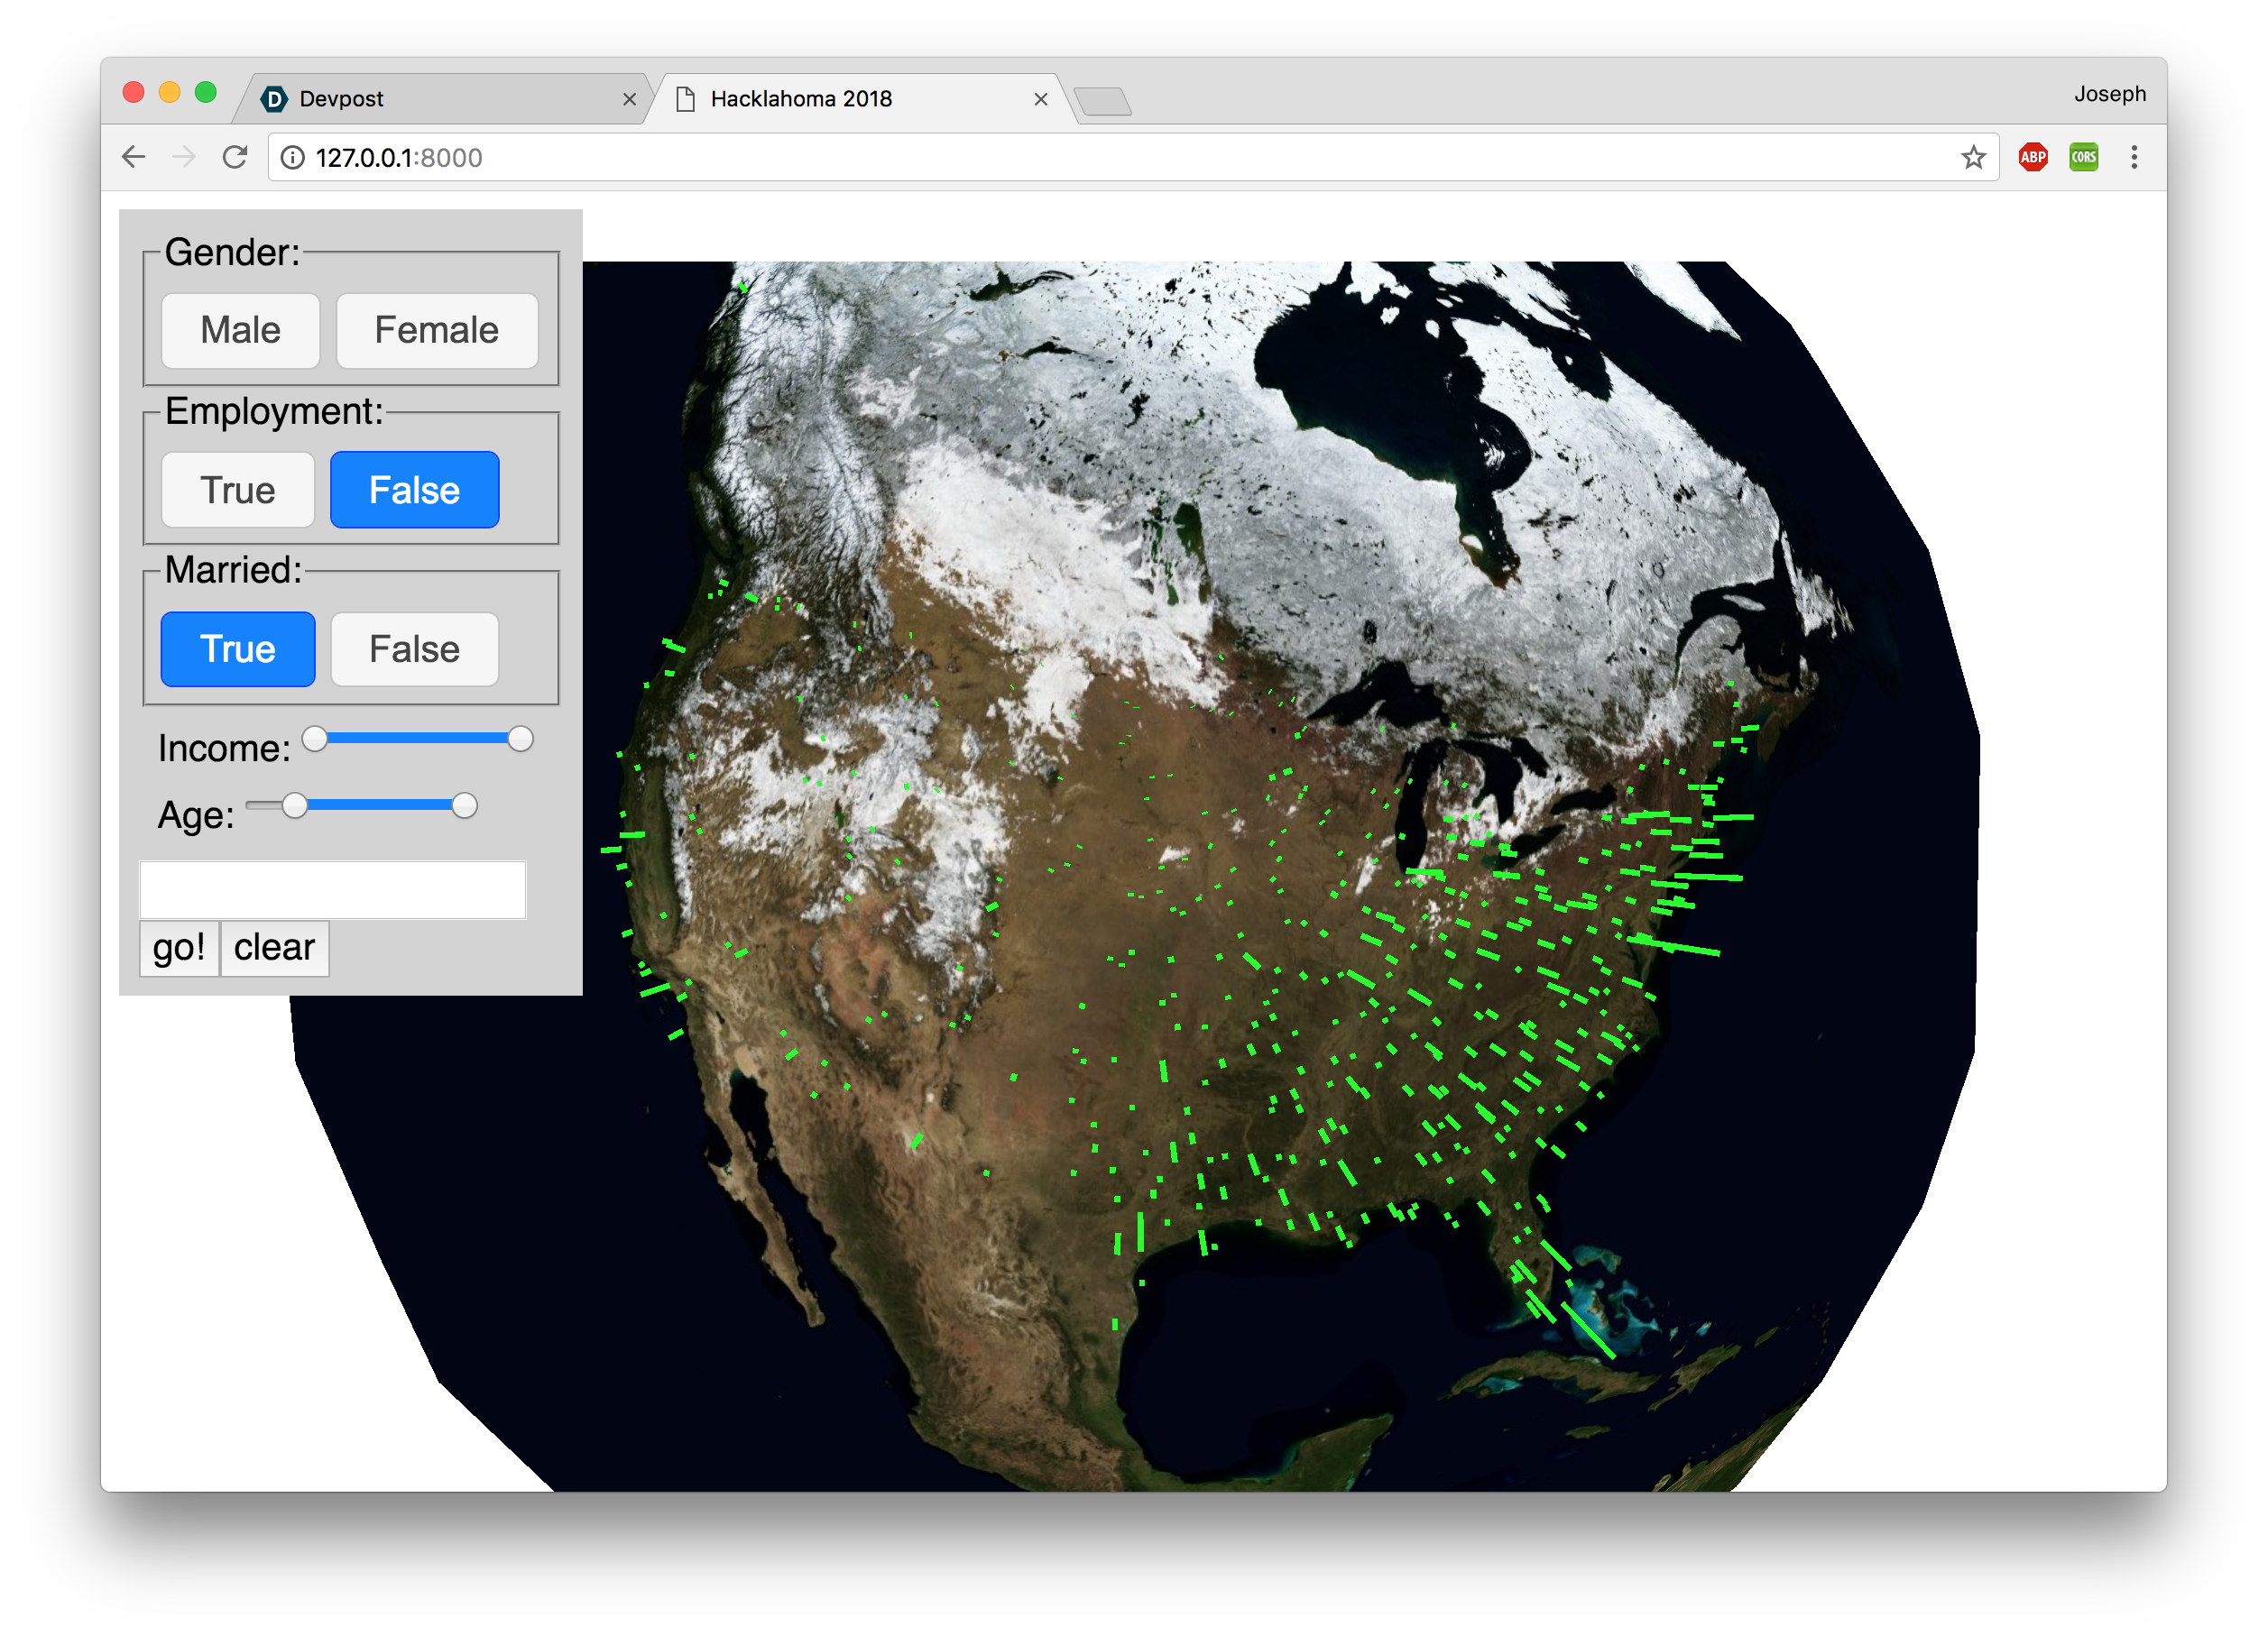
vquery
Hackathon at University of Oklahoma 2018 Team: Bruce Zheng, Joey Sapp
Summary
vquery is a statistical visualization of Vitech's customer base using the data they provided hackers at Hacklahoma 2018. We give the option for users to adjust details of the customers they are viewing. The height of each "pole" or cylinder is determined by the amount of policies that Vitech has sold in the area.
Technical Details
Written and developed using primarily Javascript, vquery utilizes multiple frameworks such as node, express, p5.js with an underpinning of web sockets in socket.io. These allowed us to perform well as a team as well as incredible ease of development.
A user visiting vquery is greeted by a projection of our globe. Our application has a straightforward panel of options to parse through data - specifically, data provided to us by a sponsor of the hackathon, Vitech. Upon querying your local browser instance, the options are sent from the client to our node.js instance running in the background. This is accomplished using web sockets.
After this our query is handed off to a relational database implemented using an NPM package fast-csv. The result is sent via web sockets back to the client and we compute which points to display on the globe.
Our reach goal was to implement a fully-functional location system (i.e. search based on area) but are providing a histogram of the requested area using Vitech's dataset.


Log in or sign up for Devpost to join the conversation.