-
-
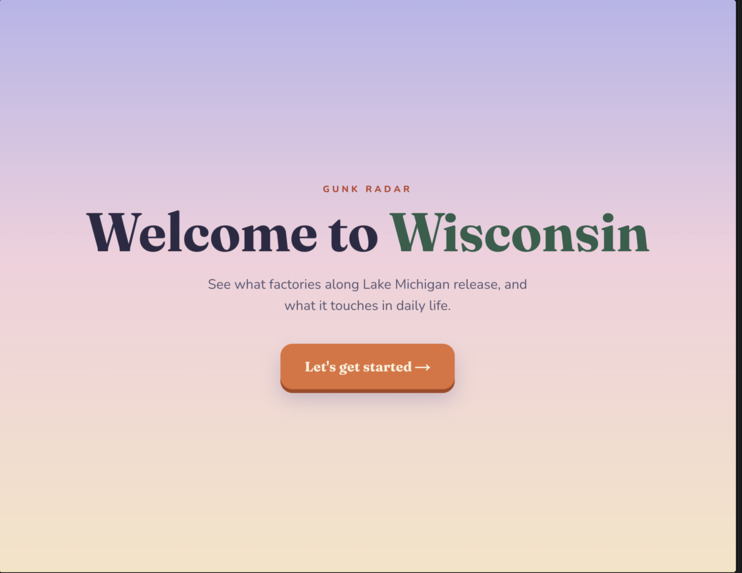
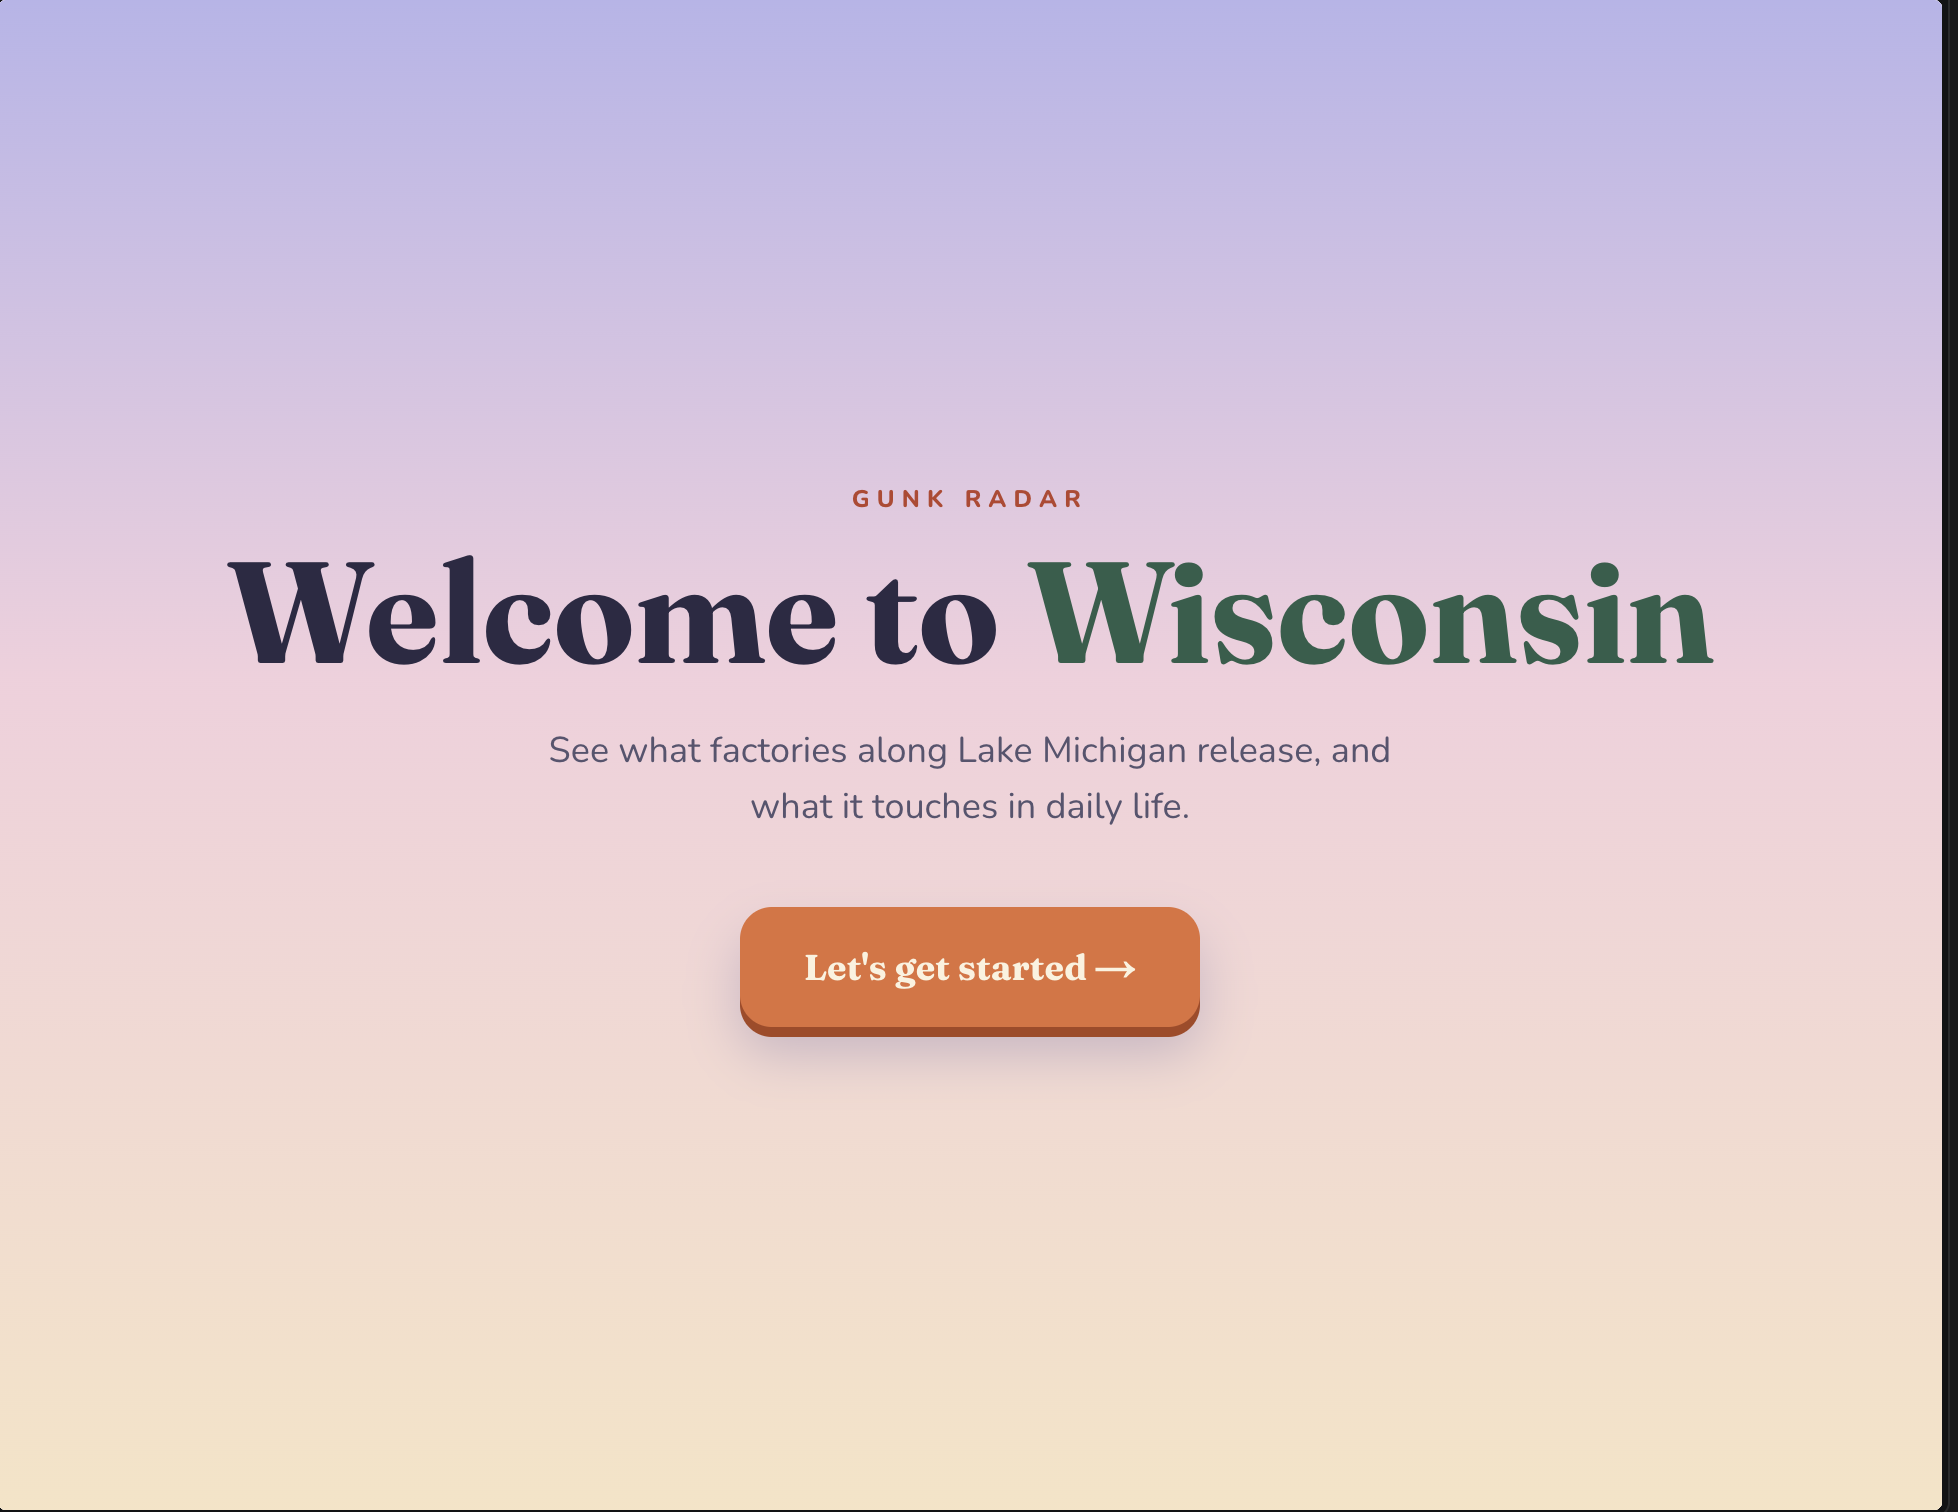
Welcome page
-
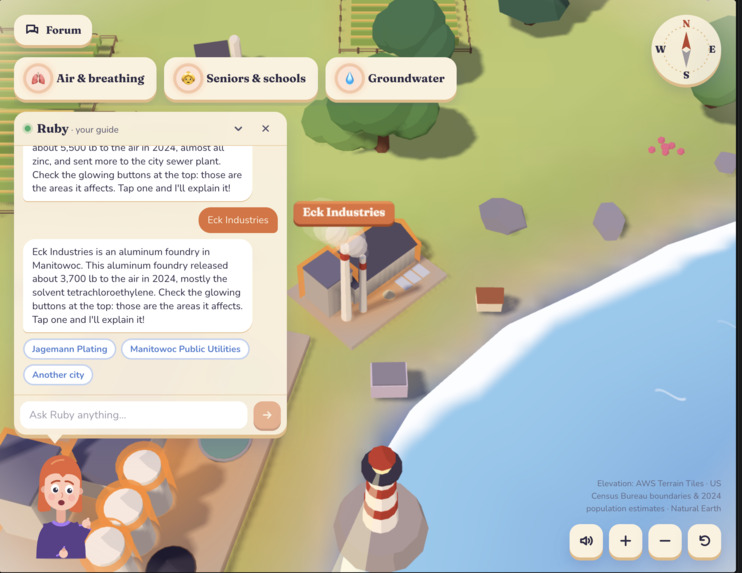
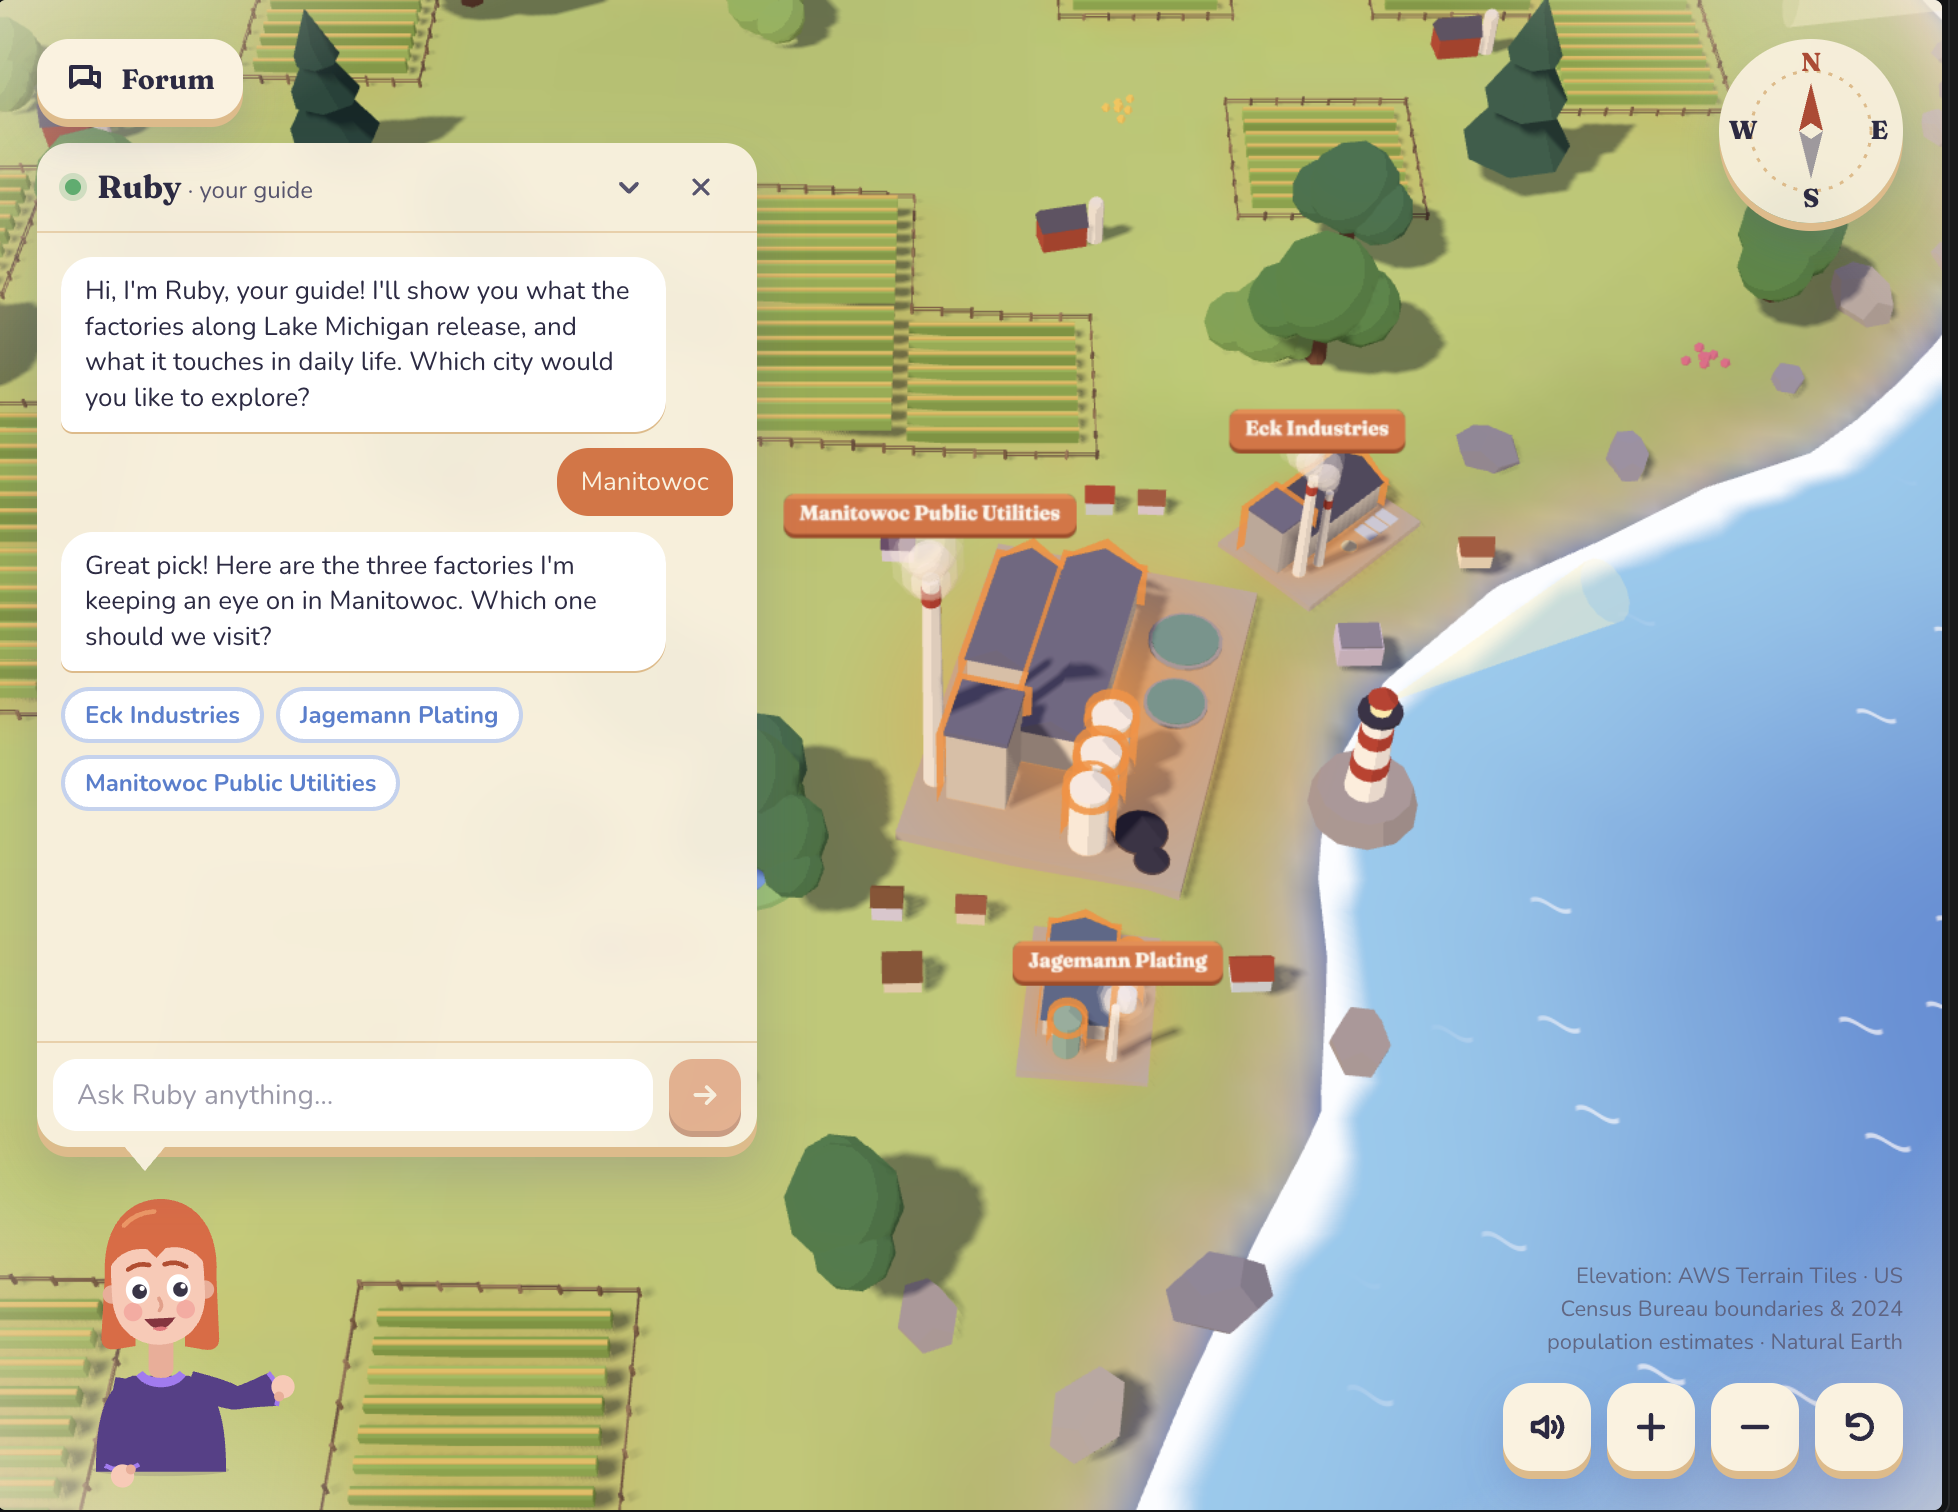
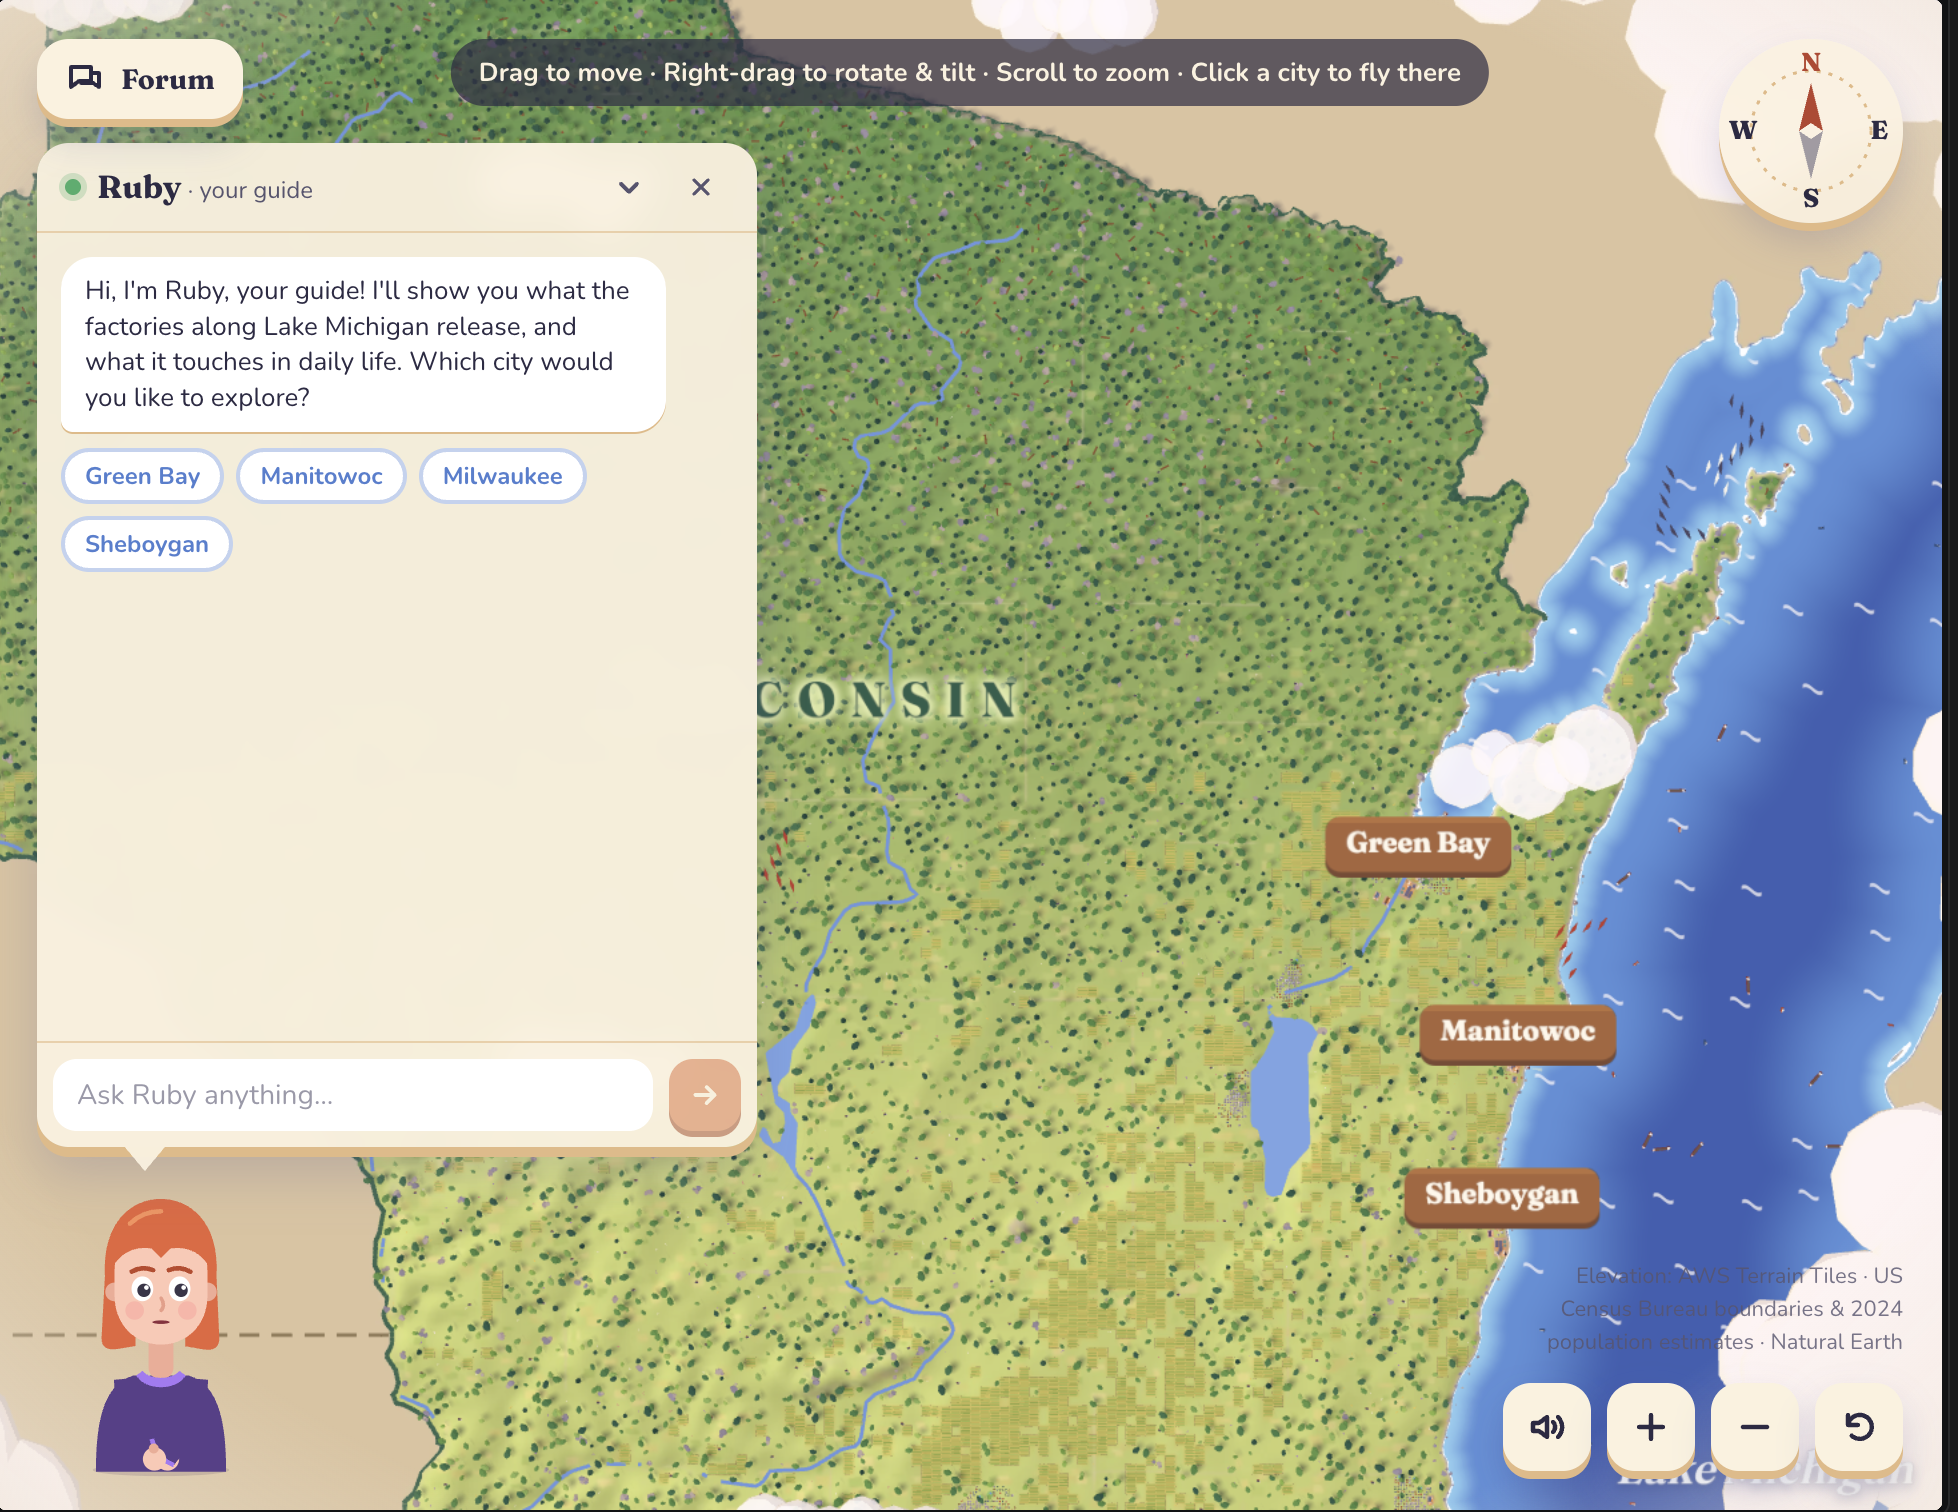
Conversing with the AI assistant
-
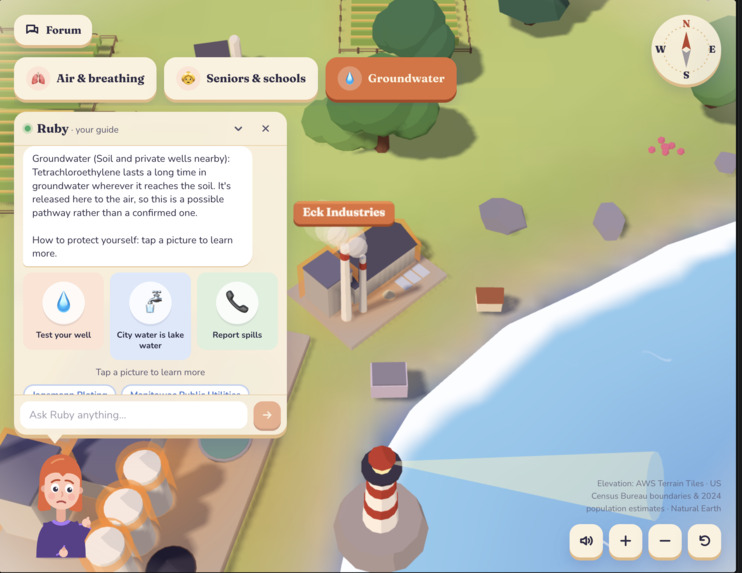
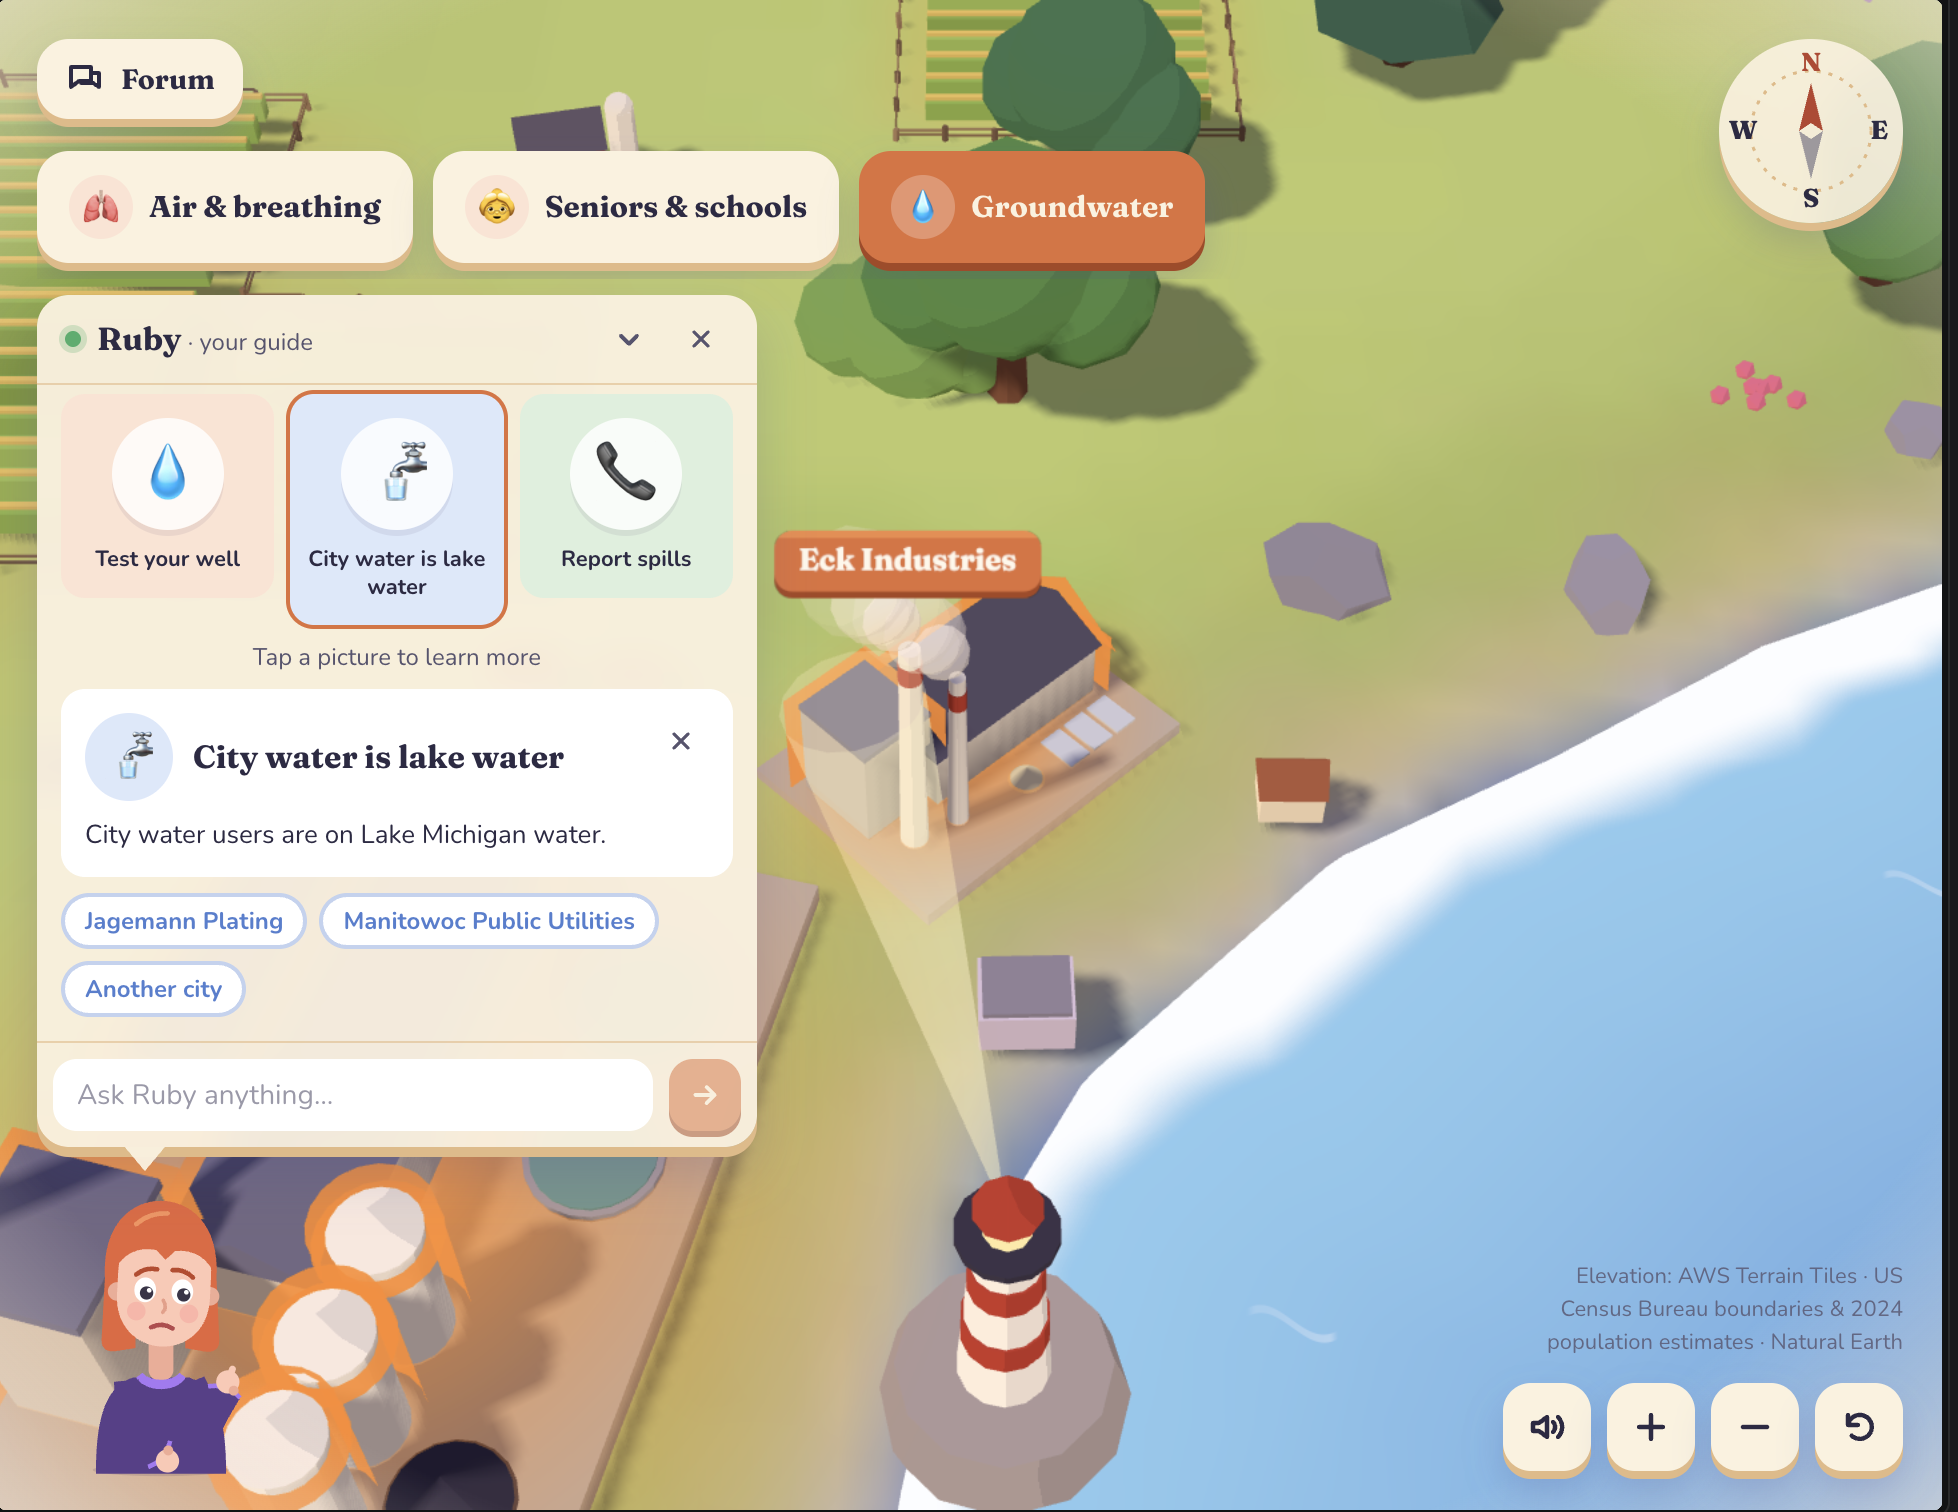
Interacting with the AI assistant
-
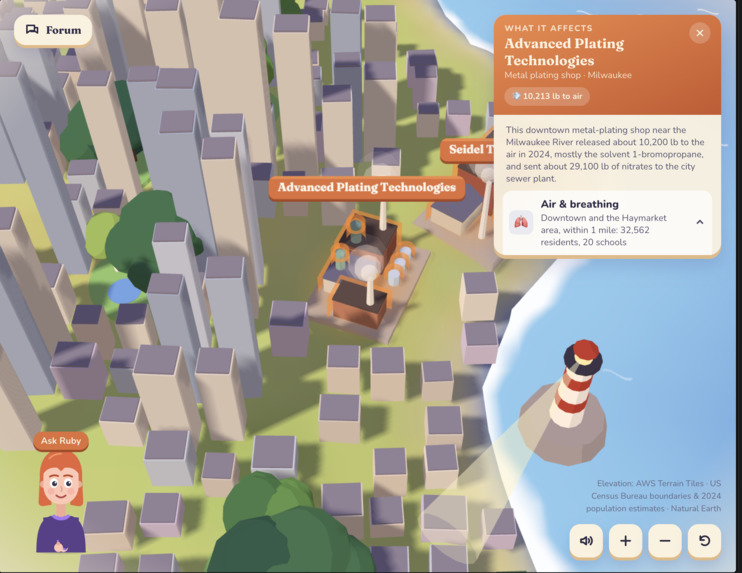
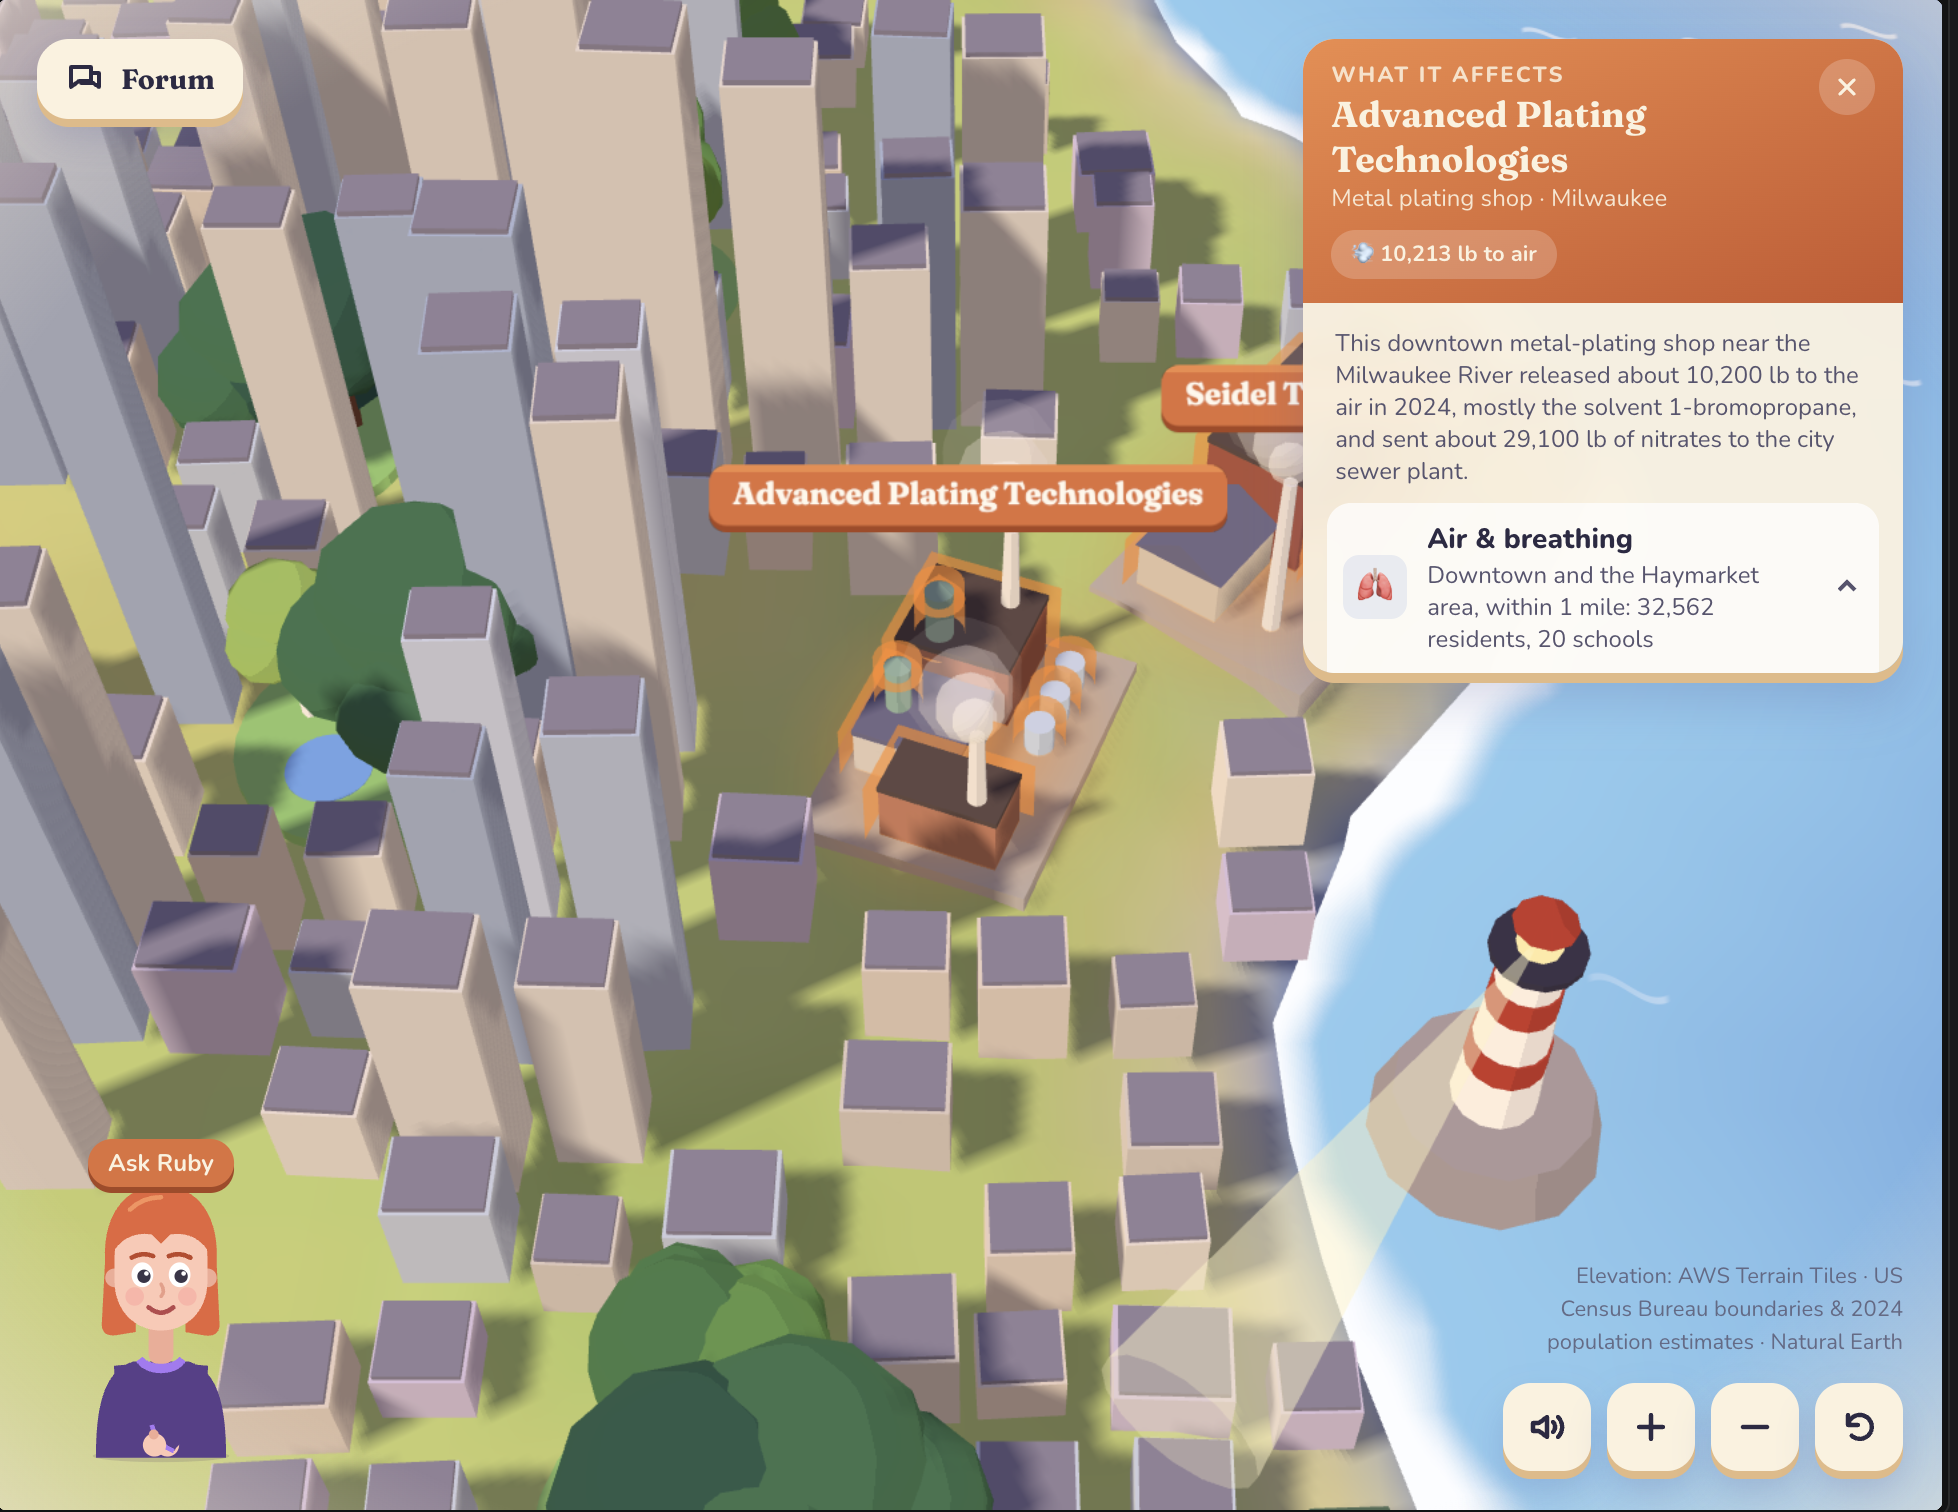
Selecting a factory in Milaukee
-
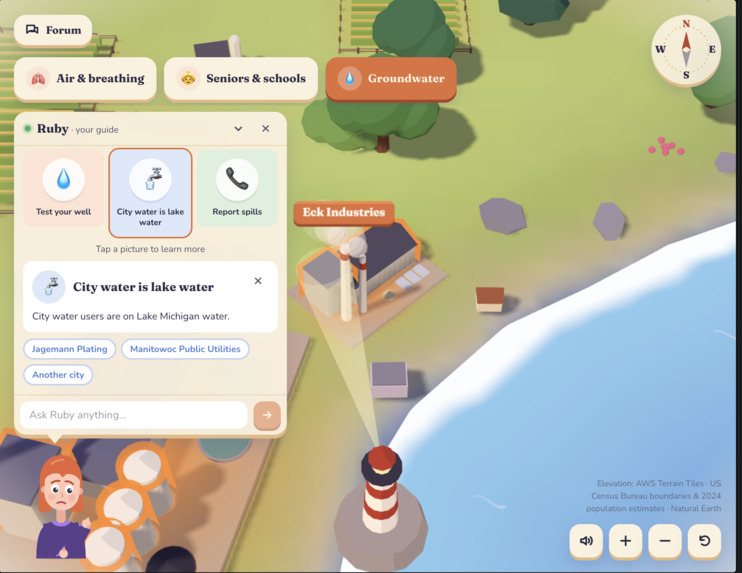
Interacting with the AI assistant
-
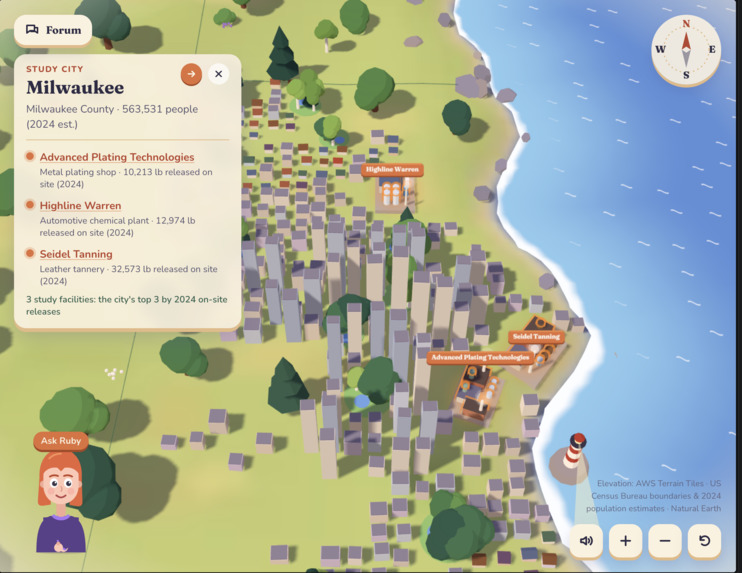
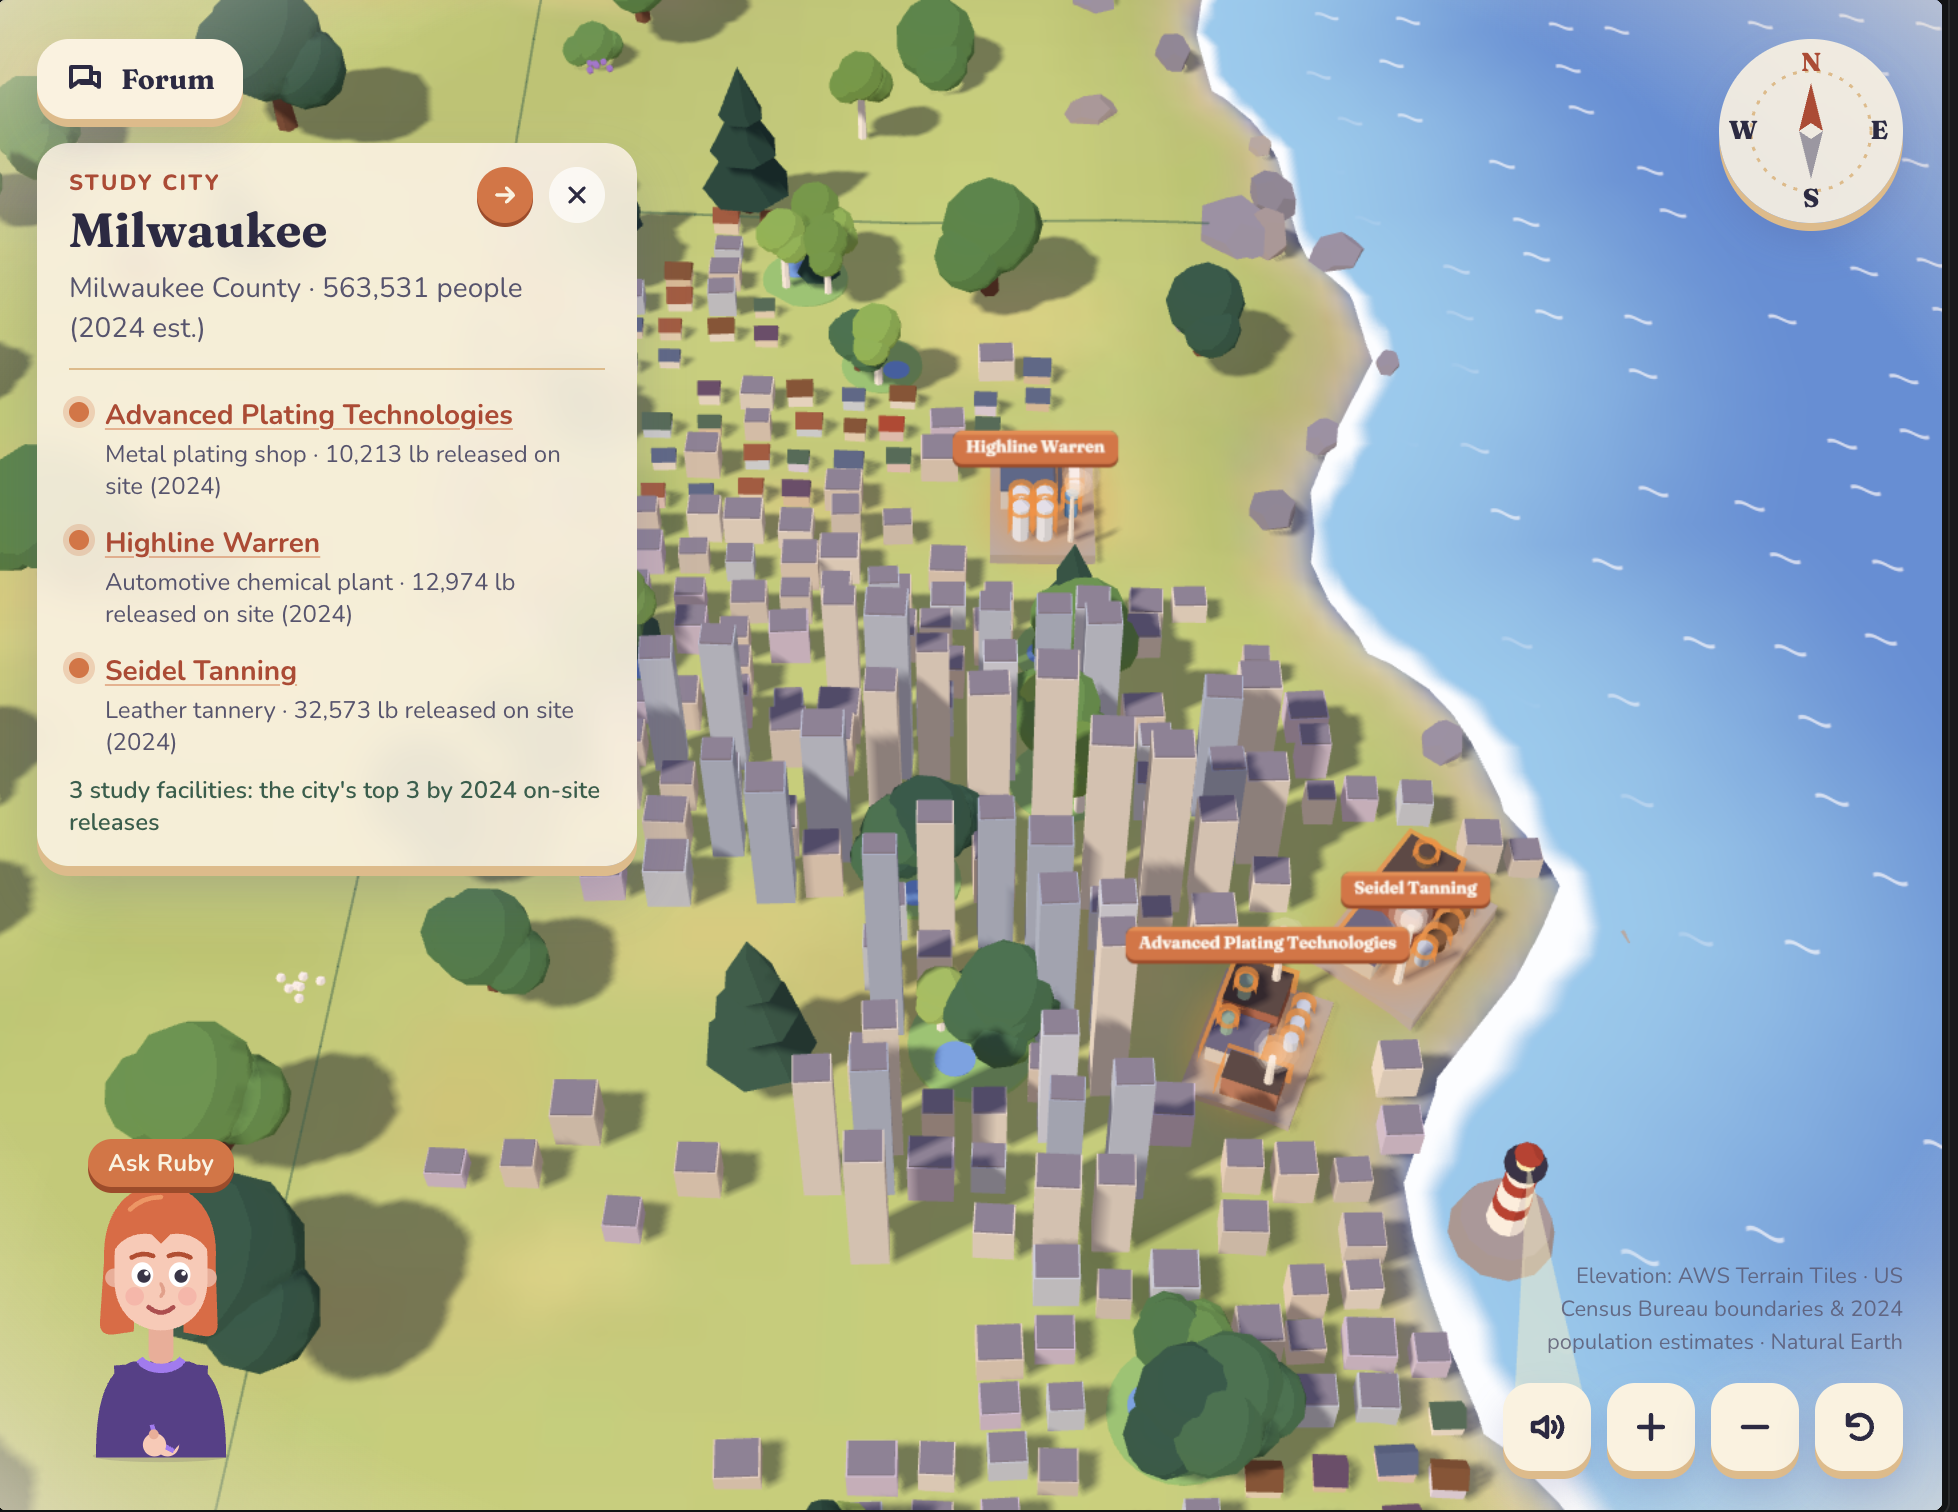
Selecting Milaukee
-
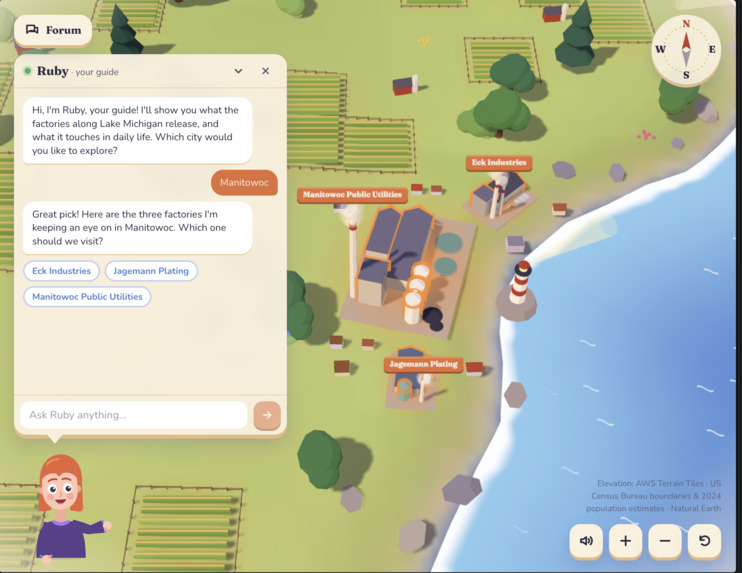
Using the built in AI assistant
-
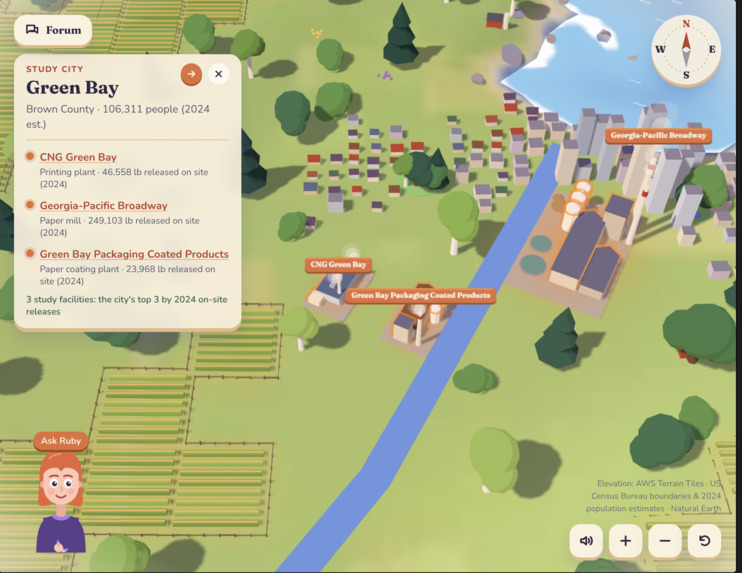
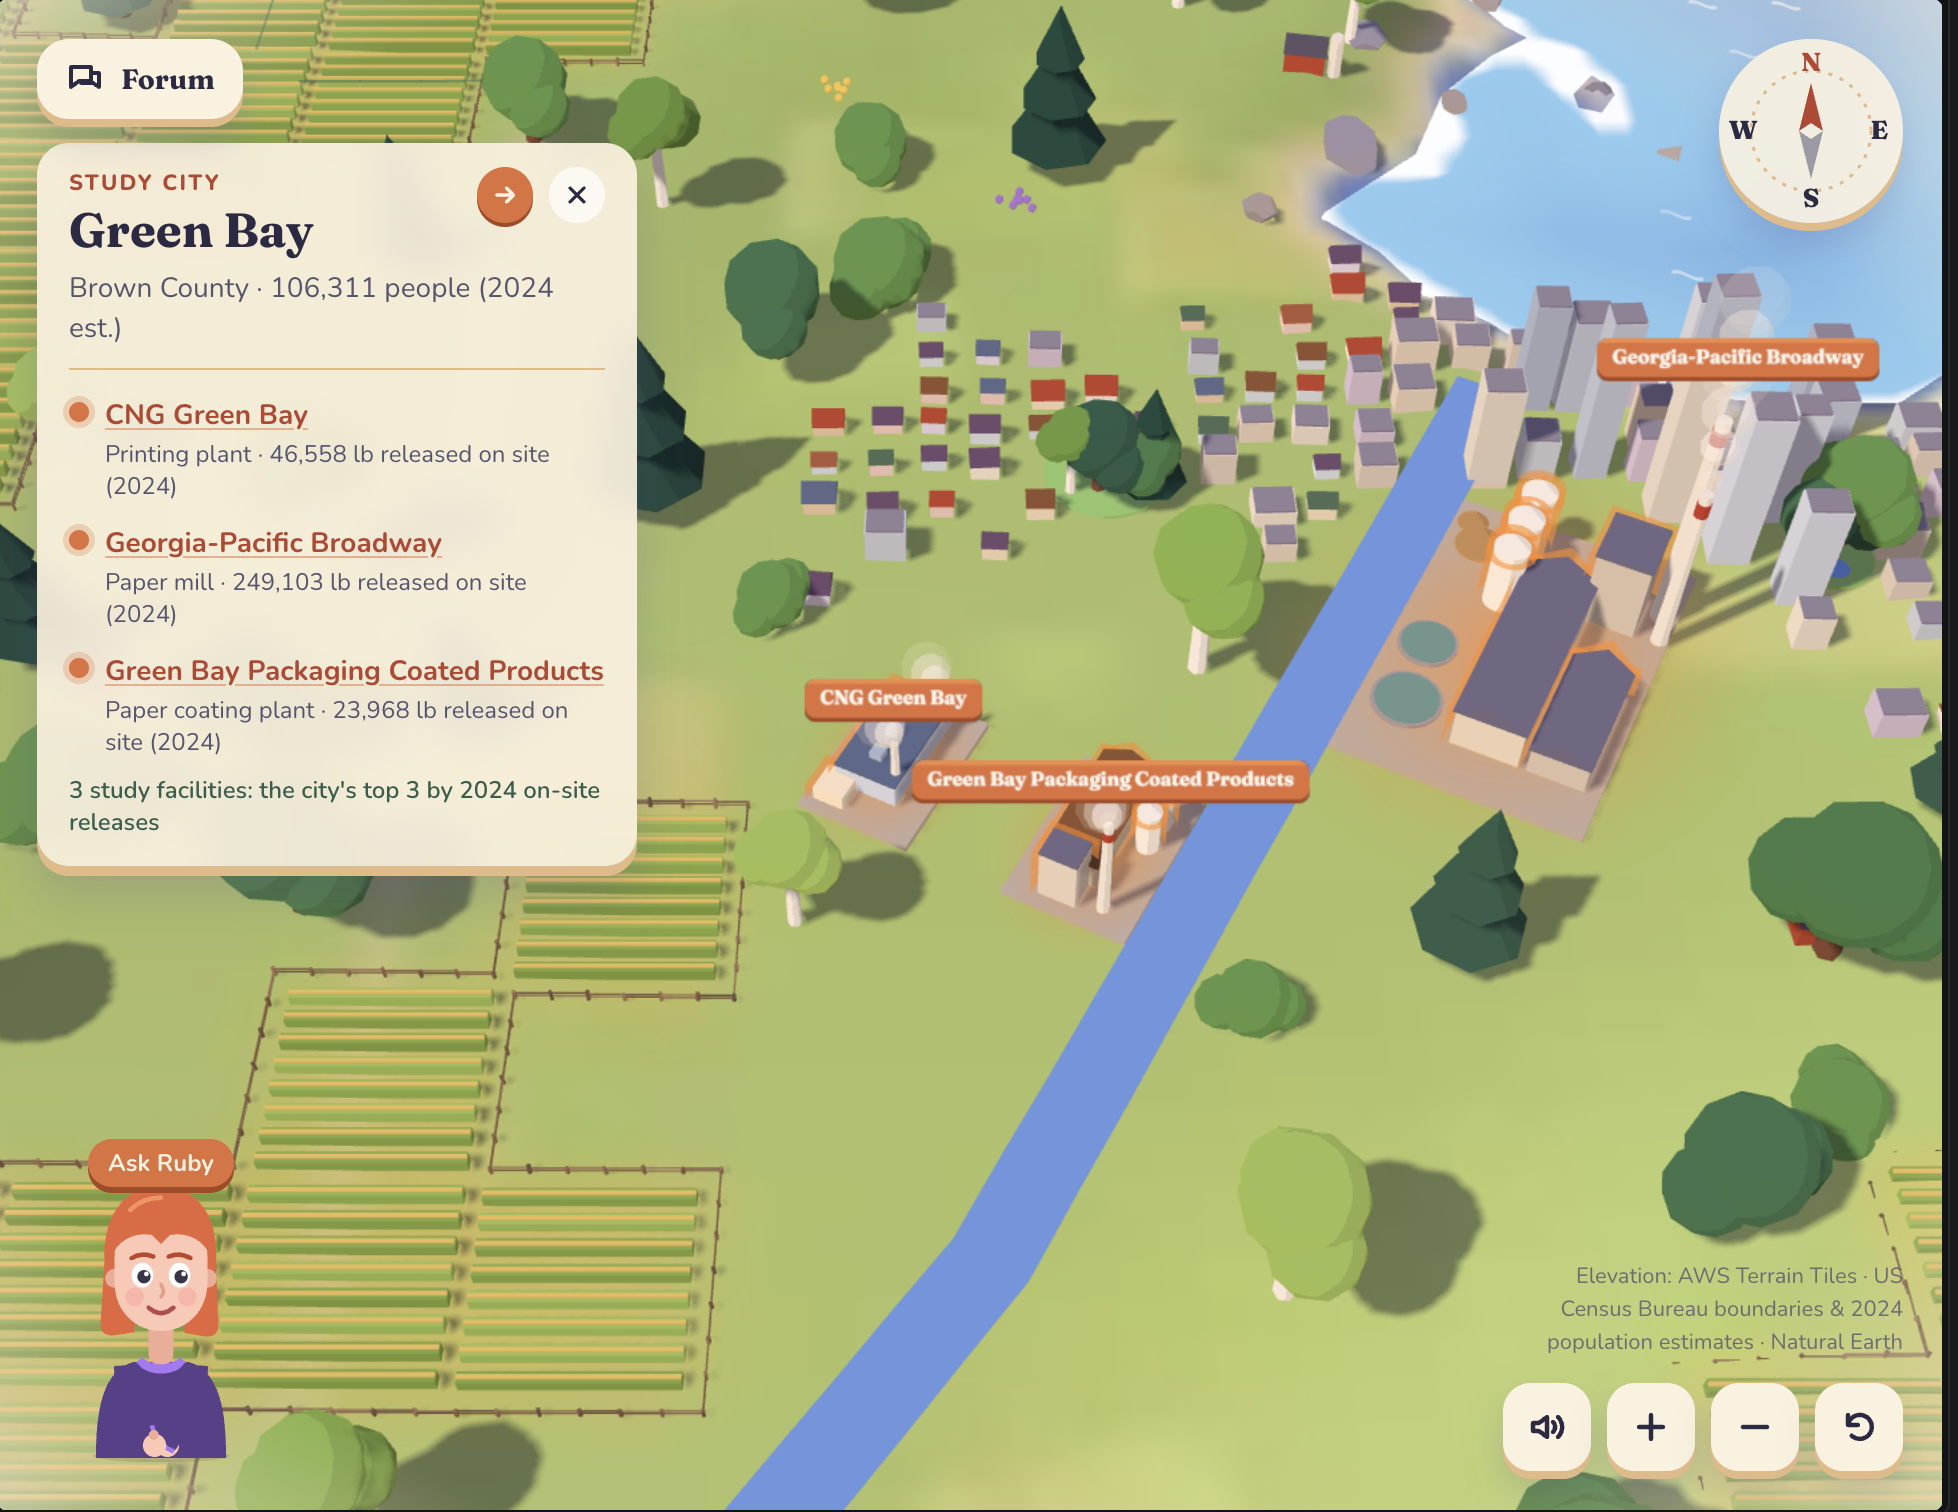
Selecting Green Bay
-
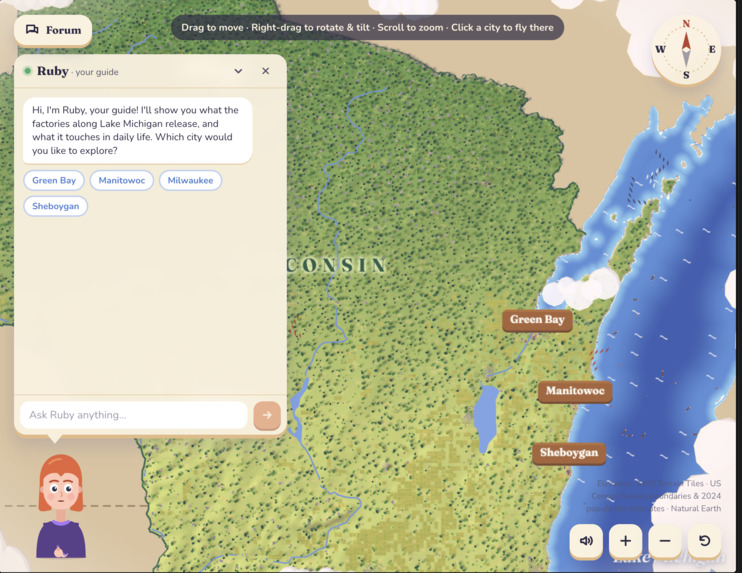
Home view
Inspiration
My inspiration for this project came from the fact that I had never built a visual interactive map because I didn't have time before, and I thought a 24-hour hackathon would be a perfect place to make my first project in this field since I had a lot of mentors around me to help me if I ran into any issues.
What is it?
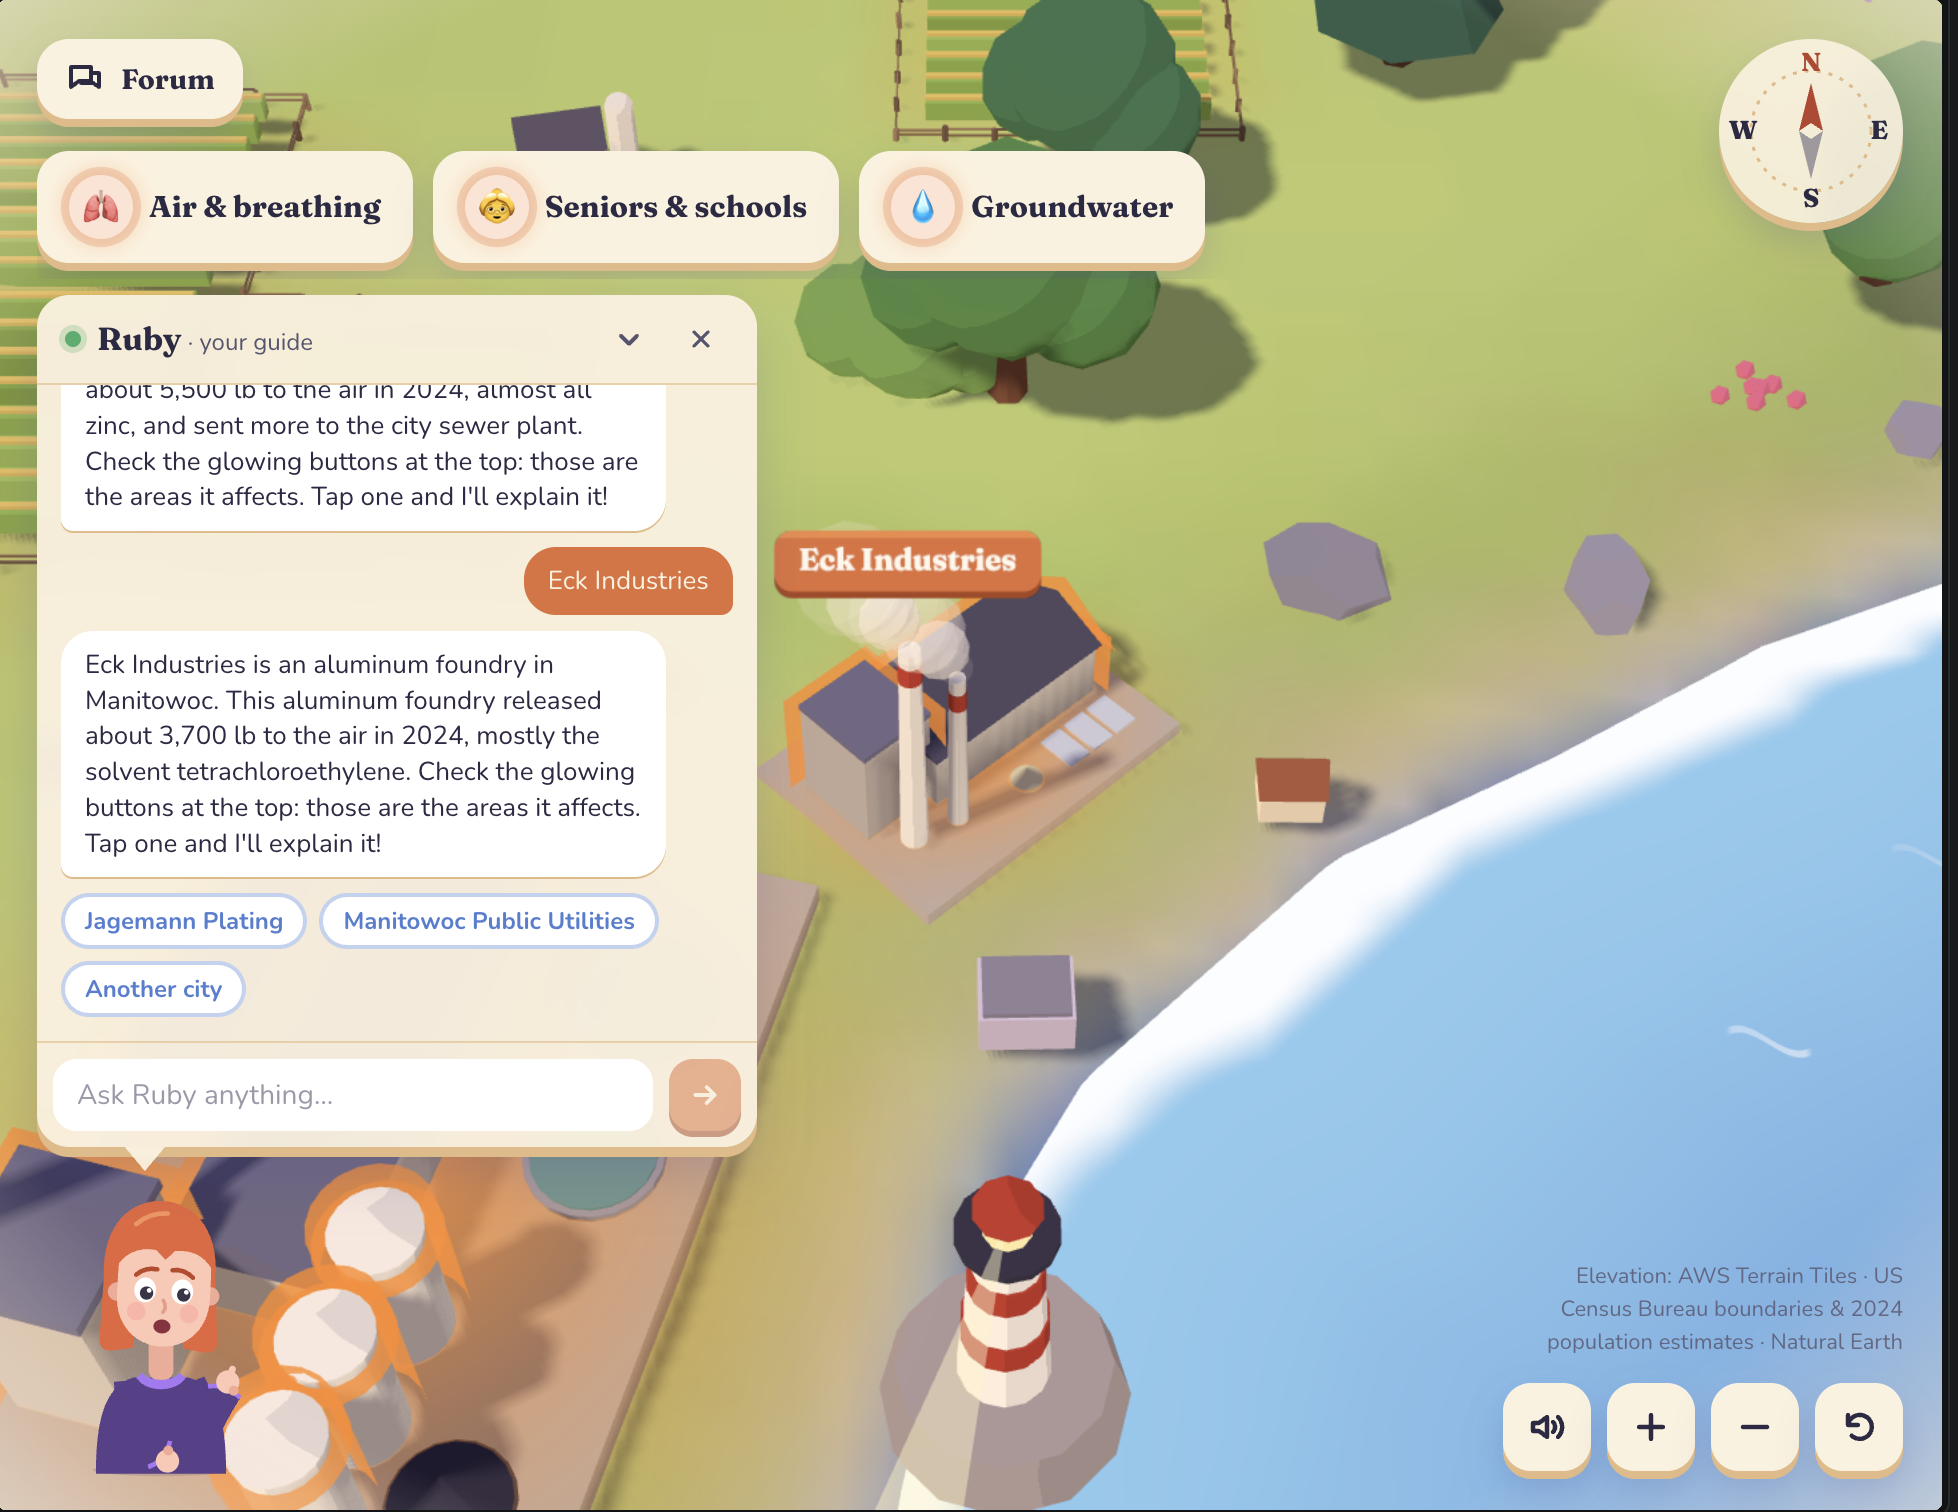
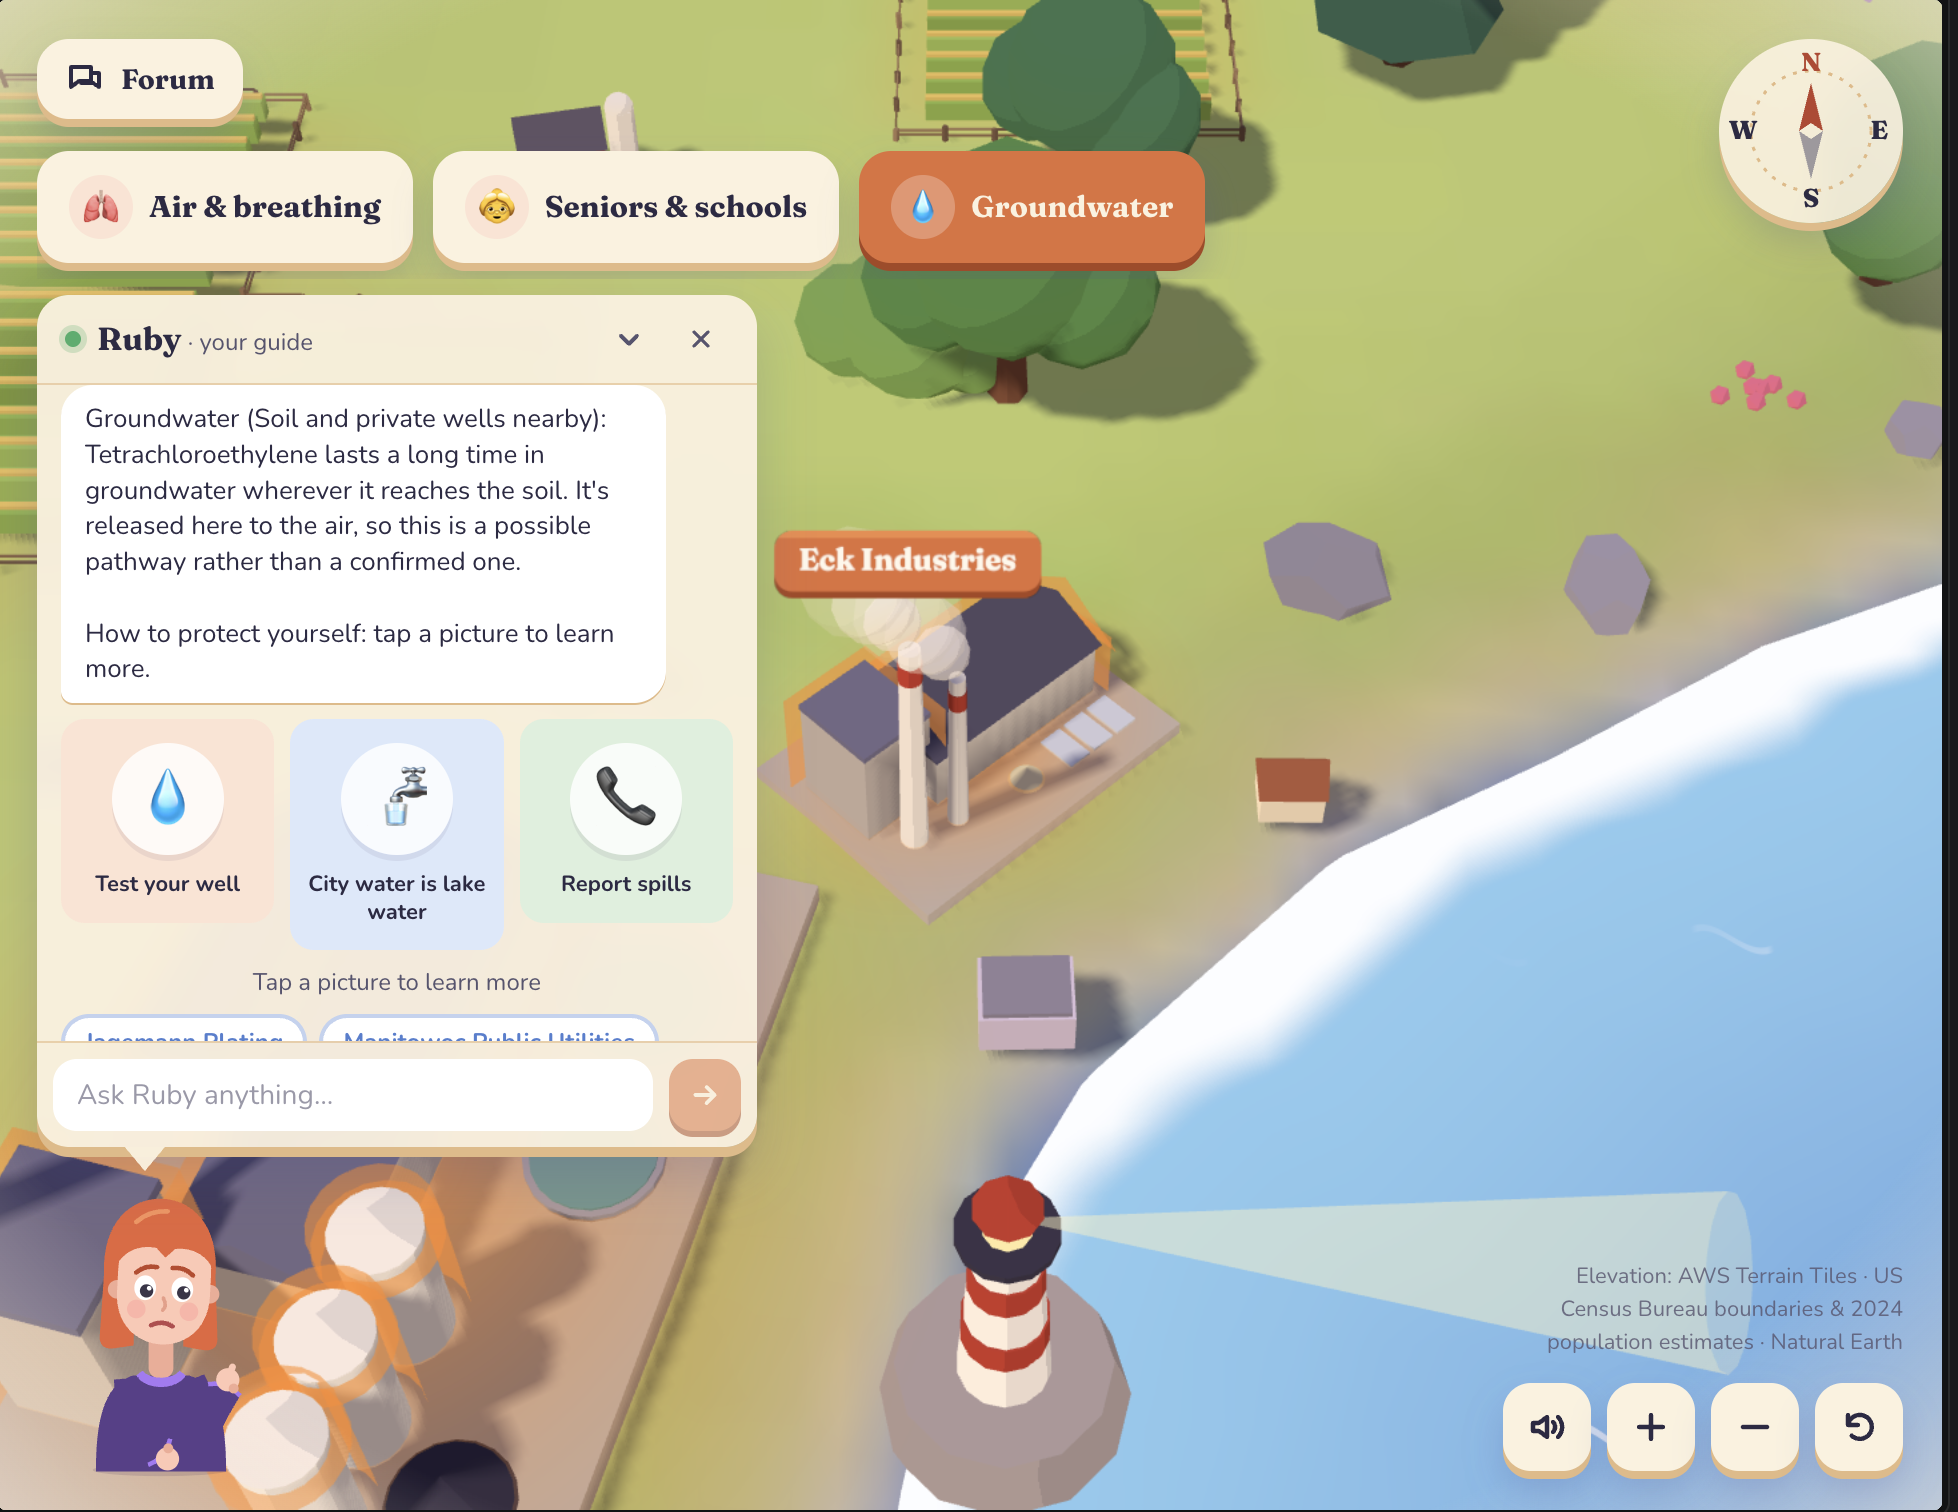
Gunk Radar is an interactive 3D map of Wisconsin. It shows industrial pollution around Green Bay, Manitowoc, Sheboygan, and Milwaukee by focusing on three major factories in each city. These three factories of choice are the leading causes of pollution in each city according to publicly available data. Using EPA Toxics Release Inventory data, it highlights the top-releasing factories in each city, what they emit, and how those chemicals affect nearby air, water and communities. It aims to make environmental data easy to explore.
Which Code Editor was used?
I made this project primarily using Visual Studio. I also tried other technologies like Loveable and Modal, but I found that Claude Code worked best with Visual Studio.
Challenges
The Challenges I ran into were finding accurate data at first, and the other main challenge I ran into was loading the visual textures. Since I was using a graphics-intensive front end, it was really slow to develop the front end. It took 80% of my time fixing bugs and aligning everything.
Accomplishments
I am really proud of the fact that I built a graphics-intensive, interactive front-end design that was in the theme of environment and sustainability.
Learnings
I learned about making an end-to-end web app that is interactive and visually engaging. I learnt a lot about software design and how that affects user retention.
Built With
- claude
- gemini-api
- github
- java
- loveable
- modal
- python
- tailwind
- visual-studio


Log in or sign up for Devpost to join the conversation.